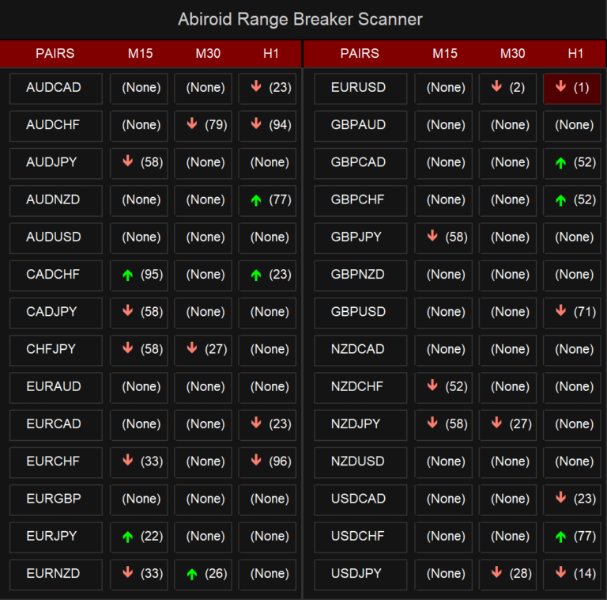
• Обзор
  • Отзывы
  • Обсуждение

Abiroid Range Breaker Arrow

Detailed blog post with extras downloads:

https://www.mql5.com/en/blogs/post/759154


About:

Price ranges most of the time in forex… Like 70-80% of the time. And then it breaks out of the range to continue in a trend.

Even in a trend, price makes smaller ranges all the time.

Range Breaker Scalper is a tool to find the times when price breaks out of a range.

A sudden break means that price will continue on for next few bars towards the breakout.

So, these areas are best for scalping. Especially if breakout has happened towards the trend direction of higher timeframes.


Don’t trade all signals. Please use this with a validating strategy which will check ongoing trends.

And trade on at least M15+ and preferably H1.

This post describes some good strategies that work very well.


Features:

  • Range Breakout
    • Breakout Bar: Min/Max Length
    • Bull/Bear Power
    • Tight Range before Breakout
  • NRTR Trend and HTF NRTR Trend
  • MA Stack Trend
  • Zigzag High Low Trend checks
  • Volume and Waddah Volatility Checks

Settings:

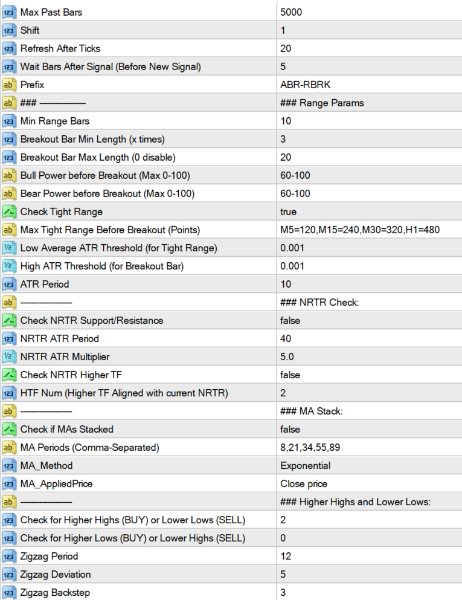
Max Past Bars: Total number of bars to scan

Shift: Starting at bar number

Wait Bars After Signal: After a signal, wait for at least these bars before searching for new signal

Prefix: It will use this prefix to draw all chart objects. And when indicator is unloaded, all the objects starting with this prefix are deleted. So make sure to have a unique prefix.


Breakout Settings:

Min Range Bars: Minimum number of bars before breakout which make the range.

Breakout Bar Min Length (x times): Minimum Candle length for breakout bar.

Suppose if it’s 3, and Min Range Bars is 10:

then it will check if current bar candle is more than 3 times the average of past 10 bars.


Sometimes, if breakout bar has already reached too far, then it will retrace. So we should avoid those breakouts.

Breakout Bar Max Length (0 disable):

Use this to set a limit for breakout bar. Suppose it’s 20, then breakout bar should NOT be more than 20 times the average of past 10 bars.

Set this to 0, to disable this check.


Bull Power/Bear Power of Range (Before Breakout):

This is the percentage of Bullish or Bearish Average height of the past 10 bars (between open and close), before breakout bar.

Usually if range has already started to move in a bullish direction.

And then a strong Bullish Breakout bar happens, then next fews bars would most likely also go upwards. If not, then it’s a false breakout.

So, keeping close stops will help. And keeping Take Profit at least 1.5-2 times more than stop loss will guarantee good profits.


To get all signals, keep this value to 0-100


Check Tight Range:

If you are only looking for a pattern with a very tight range and then a strong breakout, then keep this setting as true.

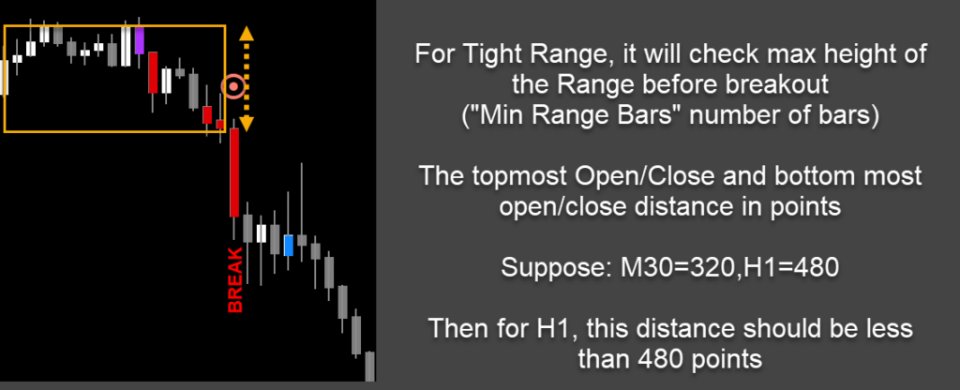
And define the Max points for each Timeframe you need. Default settings are not too tight. So will still give good signals.

Use this for calculating points:


Check Low Volatility Tight Range:

If true, then tight range last bar should have a low volatility, so that a high volatility breakout will be even stronger.


When using Tight Range, you can turn off some settings like Bull Bear Power, volume check, MA stack check, etc.

Because having too many checks on will be very restrictive.

Max tight range is the points value for breakout. If you don’t want this, keep it blank. Instead use ATR.

Low average ATR is for the average of smaller bars in Tight range. And the High ATR is for the breakout bar.

So, it will check that volatility was low when price entered range. And the strong breakout bar had a high ATR threshold.

You can change it to a higher number for really strong breakouts.


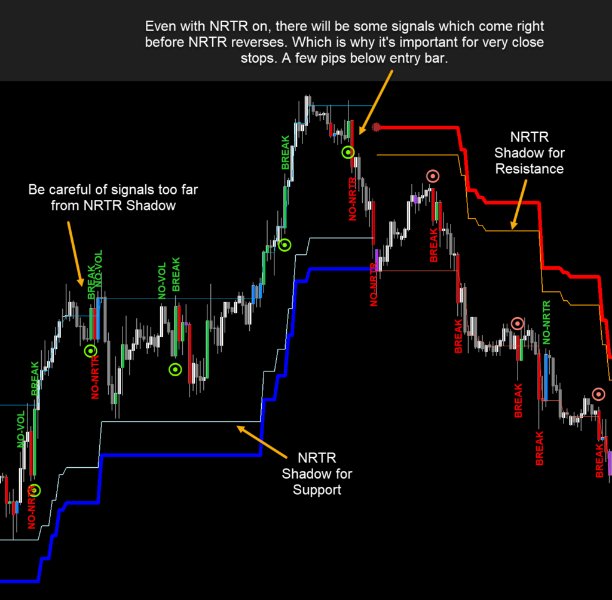
NRTR Support/Resistance Settings:

If price is above NRTR Blue Support Line, then it will only show Upward Breakout Signals.

If it is below Red Resistance line, then it will show only downwards breakout signals.


“Check NRTR Support/Resistance” is for current timeframe

But if you need to check for higher timeframes, thne keep “Check NRTR Higher TF” true.

Suppose, you have M15 as current TF and HTF Num is 2. Then it will check NRTR trend on M30 and H1.

If signal is not aligned with higher TF trend, then it will be ignored.


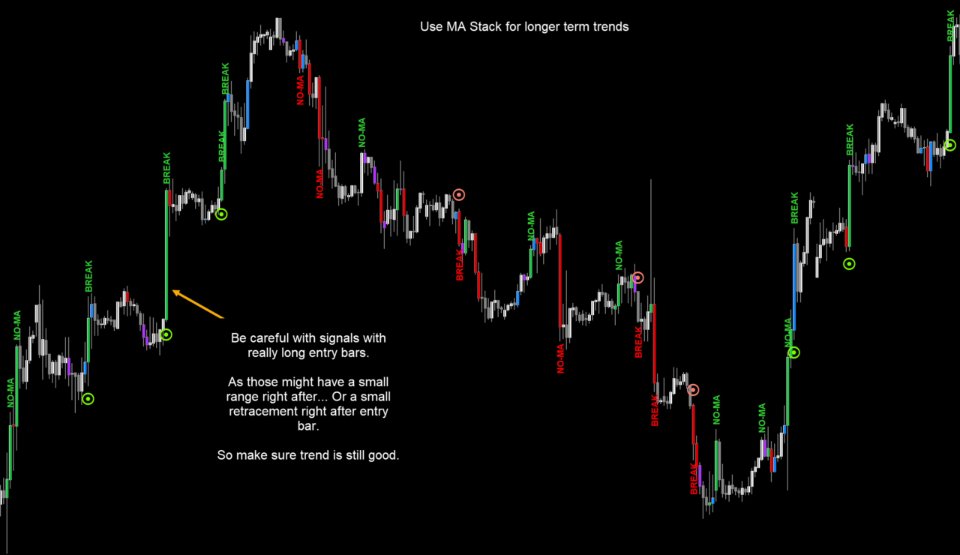
MA Stack Settings:

This Breakout strategy also works well when following a good ongoing trend. And finding smaller ranges inside the trend.

So, if you need to find overall trend, you can check if MAs are stacked. Using 5 MAs like default settings: 8,21,34,55,89

This will give you fewer signals. Because all 5 MAs to be stacked can be rare. So, only use this if you want to trade highly trending pairs.

As it will skip signals when price is in smaller trends or ranges.


Or else, use fewer MAs like: 8,21,34

Or use higher MAs to find overall higher trend like: 50,100,200


This will all depend on your style of trading. If you are quick scalping, only a few bars, then keep it off.

Because it takes time for trend to be established, and then MA Stacking happens. So, use it when you need to trade trends.


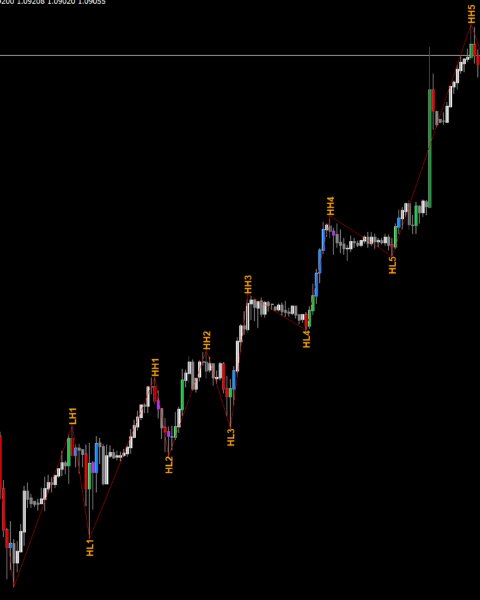
High/Low Detection:

Instead of NRTR or MA, you can also check how many higher highs and Lower lows price has been making. For an up trend, if price has already made 2 or more higher highs, then price is still in a good strong Up Trend. Same for a down trend Lower Lows and Lower Highs are important.

Keep “Check for Higher Highs and Lower Lows” to 0, to disable the checks. Same keep other “Check for Higher Lows or Lower Highs” to 0 to disable.


Volume and Volatility Settings:


If the breakout candle is a high volume and high volatility candle, then there is a greater chance of next few bars going in the same direction.

Which is why, when quick scalping just a few bars, you can keep these to true.


Waddah Explosion:

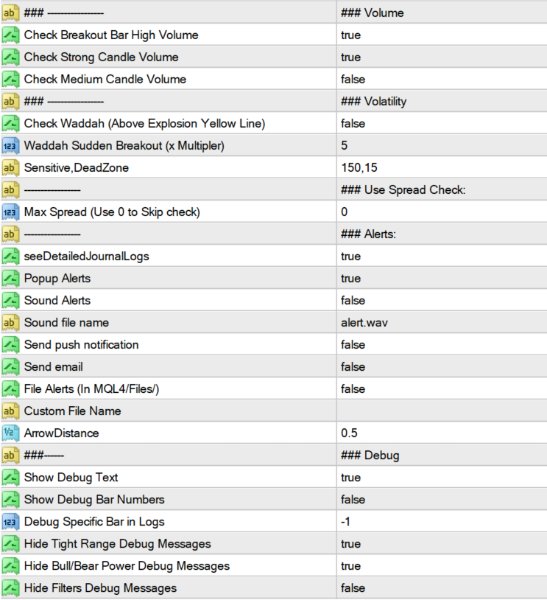
Waddah Sudden break will use a Multiplier to check breakout strength. If the Green/Red waddah bars are xMultiplier times greator than the yellow explosion line.

In image above Multiplier is 2. So for BUY, it will check if waddah green histogram is 2 times more than the yellow explosion line:


Max Spread:

Since this is a quick scalping strategy, it’s important to only trade pairs with a very small spread. To minimize losses.

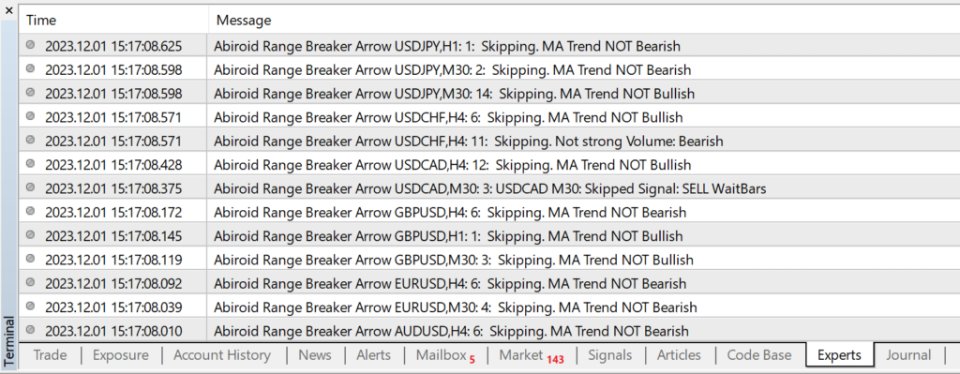
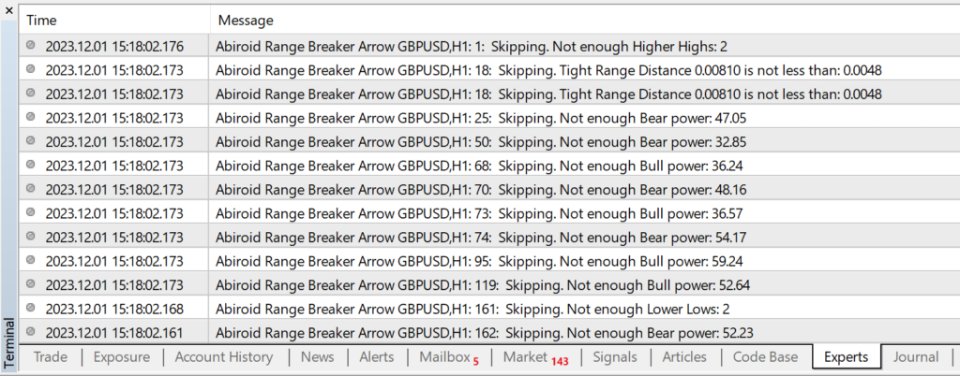
e.g.: If Max Spread is 15, then all pairs above spread 15 will be ignored. Check the detailed Experts tab logs to see why a signal is ignored:


Debug Messages:

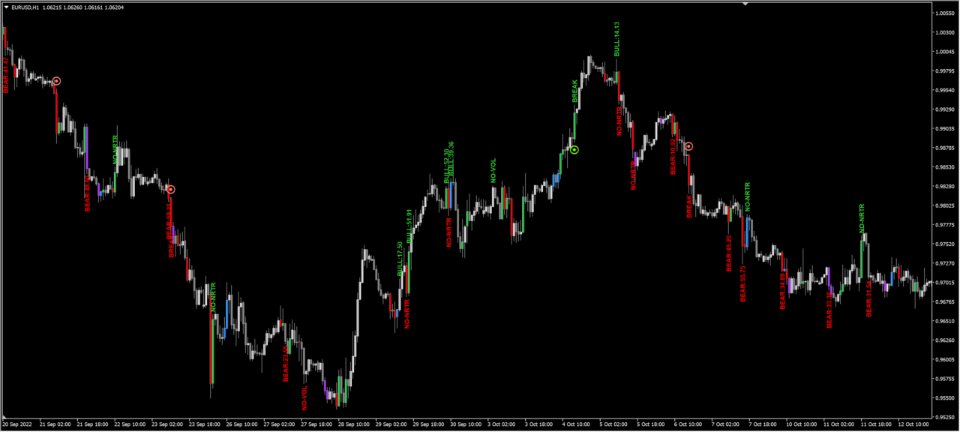
BREAK: A breakout is detected on a bar. Next it will check more filters

Skipping signals because of Filters:

NO-MA: MA Trend is not towards Breakout bar’s direction. Or MAs are not spread out and stacked yet

NO-NRTR: Current Timeframe NRTR Trend is not in breakout bar’s direction

NO-NRTR-TF: Higher Timeframe’s NRTR Trend is not aligned with breakout bar’s direction. It will be shown as NRTR-H1 for HTF H1 and so on…

BULL: % Bullish Percentage is lower than threshold. Suppose threshold is 60-100% then the debug message will show how much it actually is.

BEAR: % Bearish Percentage is lower than threshold.

NO-VOL: Breakout bar is not High/Medium volume bar

NO-WAE: Breakout bar is not High Volatility Bar

NO-HH, NO-LL, NO-HL, NO-LH: Not enough Higher-Highs OR Lower Lows, OR Higher Lows, OR Lower Highs according to defined values

Skipping Signals because of Tight Range:

TOO-LONG: Breakout Bar is longer than xMultiplier “Breakout Bar Max Length”.

NO-TIGHT: Past range bars total height is not less than the Tight Range Max height defined for that timeframe

NO-RANGE-ATR-LOW: Past range bars average ATR is not LESS than “Low Average ATR Threshold”

NO-BREAK-ATR-HIGH: Breakout bar’s current ATR is not MORE than “High ATR Threshold”


Just turn “Show Debug Bar Numbers” true temporarily in Arrows indicator. To see which bar has skipped signal and match it in the logs.

Рекомендуем также
History Exporter can help to export your orders history from MT4 account. After that you can use another data analysis tools to get what you want.  File format is .csv file, the content such as below OrderID,Symbol,Type,Lots,OpenTime,OpenPrice,StopLoss,TakeProfit,CloseTime,ClosePrice,Commission,Swap,MagicNo,Comment,ProfitUSD,ProfitPips,NetProfit,Duration,(Days),(HH:MM:SS), 21520206,EURCHF,buy,0.05,2020.03.10 08:06:15,1.06304,0.00000,0.00000,2020.03.11 13:37:38,1.06015,-0.60,-0.05,28282888,RedRab
FREE
Title: RapidNews Trader – High Frequency Trading Price will change soon ! RapidNews Trader's unique strategy revolves around swift analysis of market sentiment shifts during major economic announcements. By leveraging sophisticated algorithms and real-time data feeds, this Expert Advisor identifies potential market opportunities milliseconds after news breaks. The result? A remarkable ability to enter and exit trades with precision, maximizing profit potential. Key Features: High-Frequency Tradi
It's a variation of mid of HH and LL since it compares the higher of HH or LL against a period and twice the number of bars back to avoid whipsaws. I used to display this against lines on a chart, but made a histogram out of it and it looks interesting. It looks good at gauging trend strength and general turns (see image below). The name of the indicator is BAM, which is an acronym for "Below and Above Mid". Ways to use it: 1. To see general trend on longer TFs (more than 30 bars back).
The Definitive Performance Testing Solution for MetaTrader Environments What This Tool Does This specialized benchmark utility measures the performance of your MetaTrader environment, providing insights that impact your trading execution. Unlike generic system benchmarks, this tool evaluates performance specifically within the MetaTrader runtime environment. For Professional Traders & Developers: Performance Metrics : Measurements of calculation throughput and memory efficiency Trading-Specific
This indicator takes input from the RSI and a trend filter, and presents the output in a separate indicator window as a histogram. Great for scalping. Settings: No need to set up the indicator. Features Alerts. How to use: Simply attach to any chart Zoom chart in to get a better view of the histo color. Buy:  Blue histo color on multiple timeframes. (e.g,. M30-H1-H4) Sell: Red histo color  across on multiple timeframes. Or backtest and use as you see fit for your strategy. Best results on Major
!!!!FIFO COMPLIANT!!!! ONLY 5 COPIES LEFT AT $49 and Price goes up to $99 This is an automated or semi automated expert advisor.  This EA is based on trend...and there's nothing better than the heikin-ashi zone trade candles to show you price action trend. Download the Heikin Ashi Zone candles for   free here. It's recommended to use this EA as a semi automated trader. Example of semi automation: You look at higher time frames of the EURUSD and see it's in a down trend. So you open an M15 chart
Это скринер позволяет выявлять активы которые больше чем обычно перекупленны (% рост) или перепроданны (% падение) в рамках выбранного отрезка времени (тайм фрейма). На рынке правит закон, купить дешевле, продать дороже , но без автоматического сканера вам будет весьма сложно выявлять валюты / акции которые перекупленные или перепроданные больше обычного скажем в рамках текущей недели, или текущего часа, или месяца. Инструментов может быть десятки или сотни, иногда просто физически можно не успе
В качестве главной стратегии советник использует скальпинг на основе статистической модели Bollinger Band (полосы Боллинджера). Советник использует две стратегии выхода - первый и второй кинжалы. Первый кинжал предполагает выход на середине средней линии, а второй выходит по трейлингу после получения максимально возможной прибыли. Для снижения риска рекомендуется использовать обе стратегии. При этом лот делится на две части. Рекомендуемые параметры: M5/M15, EURAUD/GBPAUD, ECN-счет Добавьте ссылк
Представляем EA Meta 4: AI Distance В постоянно меняющемся мире финансов своевременное получение информации и отслеживание трендов — ключ к успеху. EA Meta 4 с гордостью представляет наш последний продукт: AI Distance . Этот продвинутый Expert Advisor (EA) разработан для того, чтобы помочь инвесторам оптимизировать торговые решения на основе анализа новостей и рыночных тенденций. Ключевые особенности AI Distance: Мониторинг новостей в реальном времени: AI Distance использует технологии ИИ для от
Balance Injection EA is an adaptive expert, which is scanning old signal to catch right Trend and jump to market by creating single order. Balance Injection Expert users can set their maximal DD in the expert setting and is preferable to attach it to EURUSD chart. Expert is already pre-set with optimum setting and is advisable to use the default setting for beginner users. Balance should be at least 5000 USD to keep maximal DD in a good position.  FOR Beginner Users please use Input Settings in
Индикатор отображает на графике текущее время сервера и время до закрытия текущего бара. Информация бывает очень полезной в моменты выхода новостей, когда трейдеры ждут именно закрытия свечи, для начала торговой сессии. Размер и цвет шрифта можно подстраивать под Ваш шаблон графика. Настройки: Text color - цвет текста отображения Tezt size - размер текста отображения Добавляйте меня в друзья, чтобы не пропустить обновления и выходы новых роботов ->   Dmitrii Korchagin Посмотрите мои другие проду
FREE
SAWA Framework  is the perfect tool for automatic or manual trading ! How does it work? You can trade manually or use it in automatic mode with your own strategy. The expert advisor opens a position when all signals enabled agree on the direction of the trend. It includes 3 types of Money Management: Fix Lot. Auto-lot calculated with a percentage of the account Balance in risk. Auto-lot calculated with a multiplier of the previous position. 3 types of Martingales: Disable. Enable adding in pro
Dynamic Range Indicator for MQL4 Introducing our cutting-edge Dynamic Range Indicator , specifically designed for 5-minute charts, featuring a proven back-testing record to ensure reliable performance. Key Features: Blue and Red Lines: The indicator uses two dynamic lines to represent market volatility. Calculation Method: The lines are constructed using the last 14 days' average absolute movement of 5-minute closing prices, multiplied by today's session open price. Indicator Formula: Today's op
С помощью алгоритма форекс индикатора тренда Practica Trend данного, вы можете достаточно быстро понять, какая именно тенденция в данный момент развивается на рынке.Индикатор Practical Trend сопровождает длинные тренды, можно использовать без ограничений по инструментах или таймфреймах. При помощи этого индикатора можно пытатся прогнозировать будущие значения. Но основное применение индикатора заключается в генерации сигналов на покупку и продажу.  Индикатор Practical Trend применяют на рынках
Rira Renko
Vitor Palmeira Abbehusen
RENKO on Time Chart This indicator is an enhanced Renko, so you can watch the Renko bricks on the chart to understand price movement more clearly the other improvement is automated box size according to ATR (Average True Range) period you can set the ATR number as you want and the box size of Renko changes automatically based on price movement Inputs Mode: Box size is the input to specify the size of the Renko box you want to print on the chart. This input lets you choose the fixed box siz
Осциллятор помогает определить направленность рынка Показывает направленность движения цены и раскрашивается в соответствующий цвет. Позволяет вести трендовую и контр трендовую торговлю Работает на всех таймфреймах, на любых валютных парах, металлах и криптовалюте Можно использовать при работе с бинарными опционами Отличительные особенности Не перерисовывается; Простые и понятные настройки; Работает на всех таймфреймах и на всех символах; Подходит для торговли валютами, металлами, опционами и кр
Robot nest- это робот советник , работающий по ценовым уровням рассчитанным по квантовой системе . Советник сделан с статическими гибкими настройками , что позволяет наиболее точно определять уровни цены .есть возможность работать с изменением периода расчётного времени .Советник применяет страховочные лакирующие ордерами и фиксирует профит только с положительным балансом. подходит для любых стилей торговли , скальпинга , среднесрочной и долгосрочной торговли. Есть возможность применять в торгов
Introducing the Open Order Timer EA Are you tired of manually opening trades at specific times?  Are you longing for a trading tool that can execute orders with pinpoint precision? Are you struggling to time your trades accurately in a fast-paced market environment? Introducing Open Order Timer, an Expert Advisor that automatically opens positions at your desired times with just a few clicks. This powerful tool takes the guesswork out of timed trading, allowing you to focus on your strategy whil
Эксперт выполняет торговые операции группового закрытия позиций. Позиции группируются по типу. Можно отбирать ордера по величине прибыли (убыткам). Есть возможность формировать группы закрытия произвольно. Можно выставить задание на автоматическое закрытие группы позиций по достижению определенного уровня прибыли/убытков или уровня цены. Дополнительные функции эксперта вызываются горячими клавишами: SHIFT+A - show/hide Auto exit options. SHIFT+S - show/hide Settings panel. SHIFT+V - sound ON/OFF
Торговля сильными валютами против слабых валют - всегда самая безопасная игра. Этот индикатор измеряет относительную силу между основными валютами и облегчает выбор инструментов, облегчает вход и выход. Основная идея состоит в том, чтобы атаковать слабые валюты, используя сильные в качестве контрвалюты, и наоборот. Покупайте силу против слабости и короткую слабость против силы. [ Руководство по установке | Руководство по обновлению | Устранение неполадок | FAQ | Все продукты ] Найти сильные и с
Этот мощный индикатор обнаруживает 21 паттерн одновременно на 28 парах и на всех таймфреймах. Просто установите индикатор на один график, чтобы увидеть все паттерны, формирующиеся на всех парах и таймфреймах. Распознаваемые паттерны: Медвежьи: Медвежий Брошенный младенец; Медвежье поглощение; Медвежья модель Харами; Медвежий Кикер; Завеса из темных облаков; Вечерняя звезда доджи; Вечерняя звезда; Падающая звезда; Три черные вороны; Три изнутри вниз; Три внешних бара вниз; Бычьи: Бычий Брошенный
SUPER Correlation Lines for Symbols  Multi timeframes Multi Currencies Indicator Each line indicates 2 symbols correlation based on Multi timeframes symbols strength calculations 5 symbols  -> 10 correlation indicator lines  Strategy:1  is based on selecting the NEW weaker/stronger correlation  line : *****New Weaker Line Crossing DOWN the old weaker line : SELL SYMBOL1 && BUY SYMBOL2 *****New Stronger Line Crossing UP the old weaker line :   BUT SYMBOL1 && SELL SYMBOL2 You close trades when n
EPriceJPY - это советник для автоматической торговли, ориентированный на USDJPY. Торговая концепция Концепция работы EPriceJPY основана на алгоритме, который пытается определить тренд. Если быть точнее, EPriceJPY работает со своей собственной логикой вычислений. Он пытается найти вершину или впадину тренда и соответственно открыть короткую или длинную позицию. Не ожидайте, что EPriceJPY откроет сделку на самом высоком или самом низком уровне, поскольку EPriceJPY торгует только при подтверждении
This Dashboard displays signals in grid view for the 28 major fx currency pairs. It is Mainly used for forex scalping in between 10 to 20 pips maximum and can be used on major trend market decisions. It Uses mainly Moving average and does not give false signal. All you need to note is the point in the grid where the signal occurs.  A beep sound is heard whenever there is a new signal and it will be displayedat the top of the chart.
MTF MultiMeter
GRANTLEY LAURENCE CAUSE
Benefits: A new and innovative way of looking across multiple timeframes and multiple indicators on any chart. Provides instant multi-timeframe analysis of any market. i.e. forex currency pairs, cryptocurrency pairs, commodities, etc. It offers precise indications across multiple timeframes of volatility as measured by RSI, ADX and STOCH within one chart. Helps you determine high probability trading setups. See example strategy in comments. Can see bullish/bearish volatility building across mult
Time Closer can help you closing all the open position at the specified time "Everyday". Mainly for Day trader that don't want to hold position overnight, or over different session, or over a specific time. Simple Parameter to use. Usage Download and drag Time Closer on the chart (Chart Symbol should be the same Chart Symbol as you want the position close) Check Allow AutoTrading is "On" Set parameters Input Parameters Turnon  True - Turnon the utility False - Turnoff the utility Close All Open
Индикатор Block Master Pro предназначен для визуального определения зон на графике, где возможно сосредоточены объемы крупных участников рынка. Эти зоны, называемые ордер-блоками, представляют собой диапазоны цен, где крупные игроки размещают свои ордера, что может сигнализировать о возможном развороте цены и движении в противоположную сторону. Основные особенности: Идентификация ордер-блоков : Block Master Pro эффективно выявляет ордер-блоки, определяя ценовые диапазоны, где размещены крупные
When running the backtest, it is important to consider the time difference between your local time and GMT. The backtest relies on the GMT time zone to determine trade openings and closings. Failing to account for the time difference may lead to inaccurate backtest results. If you're unable to locate your GMT Offset time zone, please inform us, and we'll gladly assist you. Overview Cyrus EA is an automated forex robot that utilizes a trend-following strategy for analyzing market movements and
OrderHelper script is super easy and trader friendly to use. It would boost your trading experience. Because it is designed to open one to multiple orders quickly with just one click. Besides using the OrderHelper script, traders can define various parameters for open orders such as the symbol, order type, lot size, stoploss, takeprofit and more. Basically, with this script traders can manage their open orders more efficiently and save their trading time. OrderHelper manages: • Open the number
+Pips is a simple indicator which was design with FIVE trading confirmations in mind that works on all pairs and time frame. It's great for scalping, as it is a powerful indicator on its own. This indicator can be used by any type of trader(new or experience). The choice of sending notification to your mobile device and sounding alerts is up to the user as this is an optional setting. This is all you need no more cluster to your charts. If high probability and low risk trades, that alerts and se
С этим продуктом покупают
Gann Made Easy - это профессиональная, но при этом очень простая в применении Форекс система, основанная на лучших принципах торговли по методам господина У.Д. Ганна. Индикатор дает точные BUY/SELL сигналы, включающие в себя уровни Stop Loss и Take Profit. Пожалуйста, напишите мне после покупки! Я поделюсь своими рекомендациями по использованию индикатора. Также вас ждет отличный бонусный индикатор в подарок! Вероятно вы уже не раз слышали о торговли по методам Ганна. Как правило теория Ганна от
Enigmera
Ivan Stefanov
5 (7)
ENIGMERA: Основы рынка Важно: демо-версия на MQL5.com работает в Strategy Tester и может не полностью отображать функциональность Enigmera. Ознакомьтесь с описанием, скриншотами и видео для подробной информации. Не стесняйтесь обращаться с вопросами! Код индикатора был полностью переписан. Версия 3.0 добавляет новые функции и устраняет ошибки, накопившиеся с момента появления индикатора. Введение Этот индикатор и торговая система представляет собой уникальный подход к финансовым рынкам. ENIGMER
Инновационный индикатор, использующий эксклюзивный алгоритм для быстрого и точного определения тренда. Индикатор автоматически рассчитывает время открытия и закрытия позиций, а также подробную статистику работы индикатора на заданном отрезке истории, что позволяет выбрать наилучший торговый инструмент для торговли. Вы также можете подключить свои пользовательские стрелочные индикаторы к Scalper Inside Pro для проверки и расчета их статистики и прибыльности. Инструкция и настройки: Читать... Осно
Dynamic Forex28 Navigator — инструмент для торговли на рынке Форекс нового поколения. В НАСТОЯЩЕЕ ВРЕМЯ СКИДКА 49%. Dynamic Forex28 Navigator — это эволюция наших популярных индикаторов, объединяющая мощь трех в одном: Advanced Currency Strength28 Indicator (695 отзывов) + Advanced Currency IMPULSE with ALERT (520 отзывов) + CS28 Combo Signals (бонус). Подробности об индикаторе https://www.mql5.com/en/blogs/post/758844 Что предлагает индикатор Strength нового поколения?  Все, что вам нравило
Представляю Вам отличный технический индикатор GRABBER, который работает, как готовая торговая стратегия "Все включено"! В одном программном коде интегрированы мощные инструменты для технического анализа рынка, торговые сигналы (стрелки), функции алертов и Push уведомлений.  Каждый покупатель этого индикатора получает дополнительно БЕСПЛАТНО:  Grabber Утилиту для автоматического управления открытыми ордерами, Пошаговый видео-мануал : как установить, настроить и торговать, Авторские сет-файлы для
Scalper Vault — это профессиональная торговая система, которая дает вам все необходимое для успешного скальпинга. Этот индикатор представляет собой полную торговую систему, которую могут использовать трейдеры форекс и бинарных опционов. Рекомендуемый тайм фрейм М5. Система дает точные стрелочные сигналы в направлении тренда. Она также предоставляет вам сигналы выхода и рассчитывает рыночные уровни Ганна. Индикатор дает все типы оповещений, включая PUSH-уведомления. Пожалуйста, напишите мне после
PUMPING STATION – Ваша персональная стратегия "всё включено" Представляем PUMPING STATION — революционный индикатор Forex, который превратит вашу торговлю в увлекательный и эффективный процесс! Это не просто помощник, а полноценная торговая система с мощными алгоритмами, которые помогут вам начать торговать более стабильно! При покупке этого продукта вы БЕСПЛАТНО получаете: Эксклюзивные Set-файлы: Для автоматической настройки и максимальной эффективности. Пошаговое видео-руководство: Научитесь т
After your purchase, feel free to contact me for more details on how to receive a bonus indicator called VFI, which pairs perfectly with Easy Breakout for enhanced confluence!   Easy Breakout is a powerful price action trading system built on one of the most popular and widely trusted strategies among traders: the Breakout strategy ! This indicator delivers crystal-clear Buy and Sell signals based on breakouts from key support and resistance zones. Unlike typical breakout indicators, it levera
Golden Trend Indicator
Noha Mohamed Fathy Younes Badr
4.9 (10)
Golden Trend indicator  is The best indicator for predicting trend movement this indicator never lags and never repaints and never back paints    and give  arrow buy and sell    before the candle appear  and it will help you and  will make your trading decisions clearer its work on all currencies and  gold and crypto and all time frame This unique  indicator uses very secret algorithms to catch the  trends, so you can trade using this indicator and see the trend clear on charts  manual guide and
Lux Trend
Mohamed Hassan
5 (3)
After purchase, please contact me to get your trading tips + more information for a great bonus!   Lux Trend is a professional strategy based on using Higher Highs and Lower Highs to identify and draw Trendline Breakouts! Lux Trend  utilizes two Moving Averages to confirm the overall trend direction before scanning the market for high-quality breakout opportunities, ensuring more accurate and reliable trade signals. This is a proven trading system used by real traders worldwide, demonstrating
FX Volume
Daniel Stein
4.59 (34)
FX Volume: Оцените подлинную динамику рынка глазами брокера Краткий обзор Хотите вывести свою торговлю на новый уровень? FX Volume дает вам информацию в реальном времени о том, как розничные трейдеры и брокеры распределяют свои позиции — задолго до появления запаздывающих отчетов типа COT. Независимо от того, стремитесь ли вы к стабильной прибыли или ищете дополнительное преимущество на рынке, FX Volume поможет выявлять крупные дисбалансы, подтверждать пробои и совершенствовать управление риск
TPSproTREND PrO
Roman Podpora
4.68 (25)
VERSION MT5        —        ИНСТРУКЦИЯ RUS           —        INSTRUCTIONS  ENG Основные функции: Точные сигналы на вход БЕЗ ПЕРЕРИСОВКИ! Если сигнал появился, он остается актуальным! Это важное отличие от индикаторов с перерисовкой, которые могут предоставить сигнал, а затем изменить его, что может привести к потере средств на депозите. Теперь вы сможете входить в рынок с большей вероятностью и точностью. Также есть функция окрашивания свечей после появления стрелки до достижения цели (take
Volatility Trend System - торговая система дающая сигналы для входов.  Система волатильности дает линейные и точечные сигналы в направлении тренда, а также сигналы выхода из него, без перерисовки и запаздываний. Трендовый индикатор следит за направлением среднесрочной тенденции, показывает направление и ее изменение. Сигнальный индикатор основан на изменении волатильности, показывает входы в рынок. Индикатор снабжен несколькими типами оповещений. Может применяться к различным торговым инструмен
В настоящее время скидка 20%! Лучшее решение для новичка или трейдера-эксперта! Эта приборная панель работает на 28 валютных парах. Он основан на 2 наших основных индикаторах (Advanced Currency Strength 28 и Advanced Currency Impulse). Он дает отличный обзор всего рынка Forex. Он показывает значения Advanced Currency Strength, скорость движения валюты и сигналы для 28 пар Forex на всех (9) таймфреймах. Представьте, как улучшится ваша торговля, когда вы сможете наблюдать за всем рынком с помощ
Важным ключевым элементом в трейдинге являются зоны или уровни, от которых принимаются решения о покупке или продаже торгового инструмента. Несмотря на попытки крупных игроков скрыть свое присутствие на рынке, они неизбежно оставляют следы. Наша задача заключалась в том, чтобы научиться находить эти следы и правильно их интерпретировать. ИНСТРУКЦИЯ RUS       INSTRUCTIONS  ENG        Рекомендуем использовать с индикатором -  TPSpro  TREND PRO -  Version MT5 Основные функции: Отображения активных
Gold Venamax – это лучший биржевой технический индикатор. Алгоритм индикатора анализирует движение цены актива и отражает волатильность и потенциальные зоны для входа. Особенности индикатора: Это супер индикатор с Magic и двумя Блоками трендовых стрелочников для комфортной и профитной торговли. Красная Кнопка переключения по блокам выведена на график. Magic задается в настройках индикатора, так чтобы можно было установить индикатор на два графика с отображением разных Блоков. Gold Venamax можно
Introduction to X3 Chart Pattern Scanner X3 Cherart Pattern Scanner is the non-repainting and non-lagging indicator detecting X3 chart patterns including Harmonic pattern, Elliott Wave pattern, X3 patterns, and Japanese Candlestick patterns. Historical patterns match with signal patterns. Hence, you can readily develop the solid trading strategy in your chart. More importantly, this superb pattern scanner can detect the optimal pattern of its kind. In addition, you can switch on and off individu
[ MT5 Version ]  [ Kill Zones ]  [ SMT Divergences ] How to trade using Order Blocks:  Click here User Interface Performance:  During testing in the strategy tester, the UI may experience lag. Rest assured, this issue is specific to the testing environment and does not affect the indicator's performance in live trading. Elevate your trading strategy with the  Order Blocks ICT Multi TF  indicator, a cutting-edge tool designed to enhance your trading decisions through advanced order block analys
Gold Trend – хороший биржевой технический индикатор. Алгоритм индикатора анализирует движение цены актива и отражает волатильность и потенциальные зоны для входа. Самые лучшие сигналы индикатора: Для SELL = красная гистограмма + красный указатель SHORT + желтая сигнальная стрелка в этом же направлении. Для BUY = синяя гистограмма + синий указатель LONG + аква сигнальная стрелка в этом же направлении. Преимущества индикатора: И ндикатора выдает сигналы с высокой точностью. Подтвержденный сигнал
Персональная реализация Order Blocks, простой, но эффективной стратегии позиционной торговли. Трейдер должен войти в рынок или искать сделки в направлении последнего блока ордеров, если ценовой диапазон не был нарушен в направлении, противоположном прорыву. Открытые блоки для наглядности не прорисовываются. [ Руководство по установке | Руководство по обновлению | Устранение неполадок | FAQ | Все продукты ] Бычий открытый блок - это первый бычий бар после нового рыночного минимума. Медвежий откр
Currency Strength Wizard — очень мощный индикатор, предоставляющий вам комплексное решение для успешной торговли. Индикатор рассчитывает силу той или иной форекс-пары, используя данные всех валют на нескольких тайм фреймах. Эти данные представлены в виде простых в использовании индексов валют и линий силы валют, которые вы можете использовать, чтобы увидеть силу той или иной валюты. Все, что вам нужно, это прикрепить индикатор к графику, на котором вы хотите торговать, и индикатор покажет вам ре
Supply Demand Analyzer is an advanced trading indicator meticulously designed for the precise identification, analysis, and management of supply and demand zones. By integrating real-time data and advanced algorithms, this tool enables traders to recognize market phases, price movements, and structural patterns with unparalleled accuracy. It simplifies complex market dynamics into actionable insights, empowering traders to anticipate market behavior, identify trading opportunities, and make info
СЕЙЧАС СКИДКА 31% !!! Лучшее решение для новичка или трейдера-эксперта! Этот индикатор является уникальным, высококачественным и доступным торговым инструментом, поскольку мы включили в него ряд собственных функций и секретную формулу. Всего на ОДНОМ графике он выдает алерты по всем 28 валютным парам. Представьте, как улучшится ваша торговля, ведь вы сможете точно определить точку запуска нового тренда или возможность скальпирования! Построенный на новых базовых алгоритмах, он позволяет еще
Linear Trend Predictor - Трендовый индикатор сочетающий в себе точки для входа и линии поддержки направления. Работает по принципу пробития ценового канала High/Low. Алгоритм индикатора фильтрует рыночный шум, учитывает волатильность и рыночную динамику. Возможности индикатора Методами сглаживания показывает рыночную тенденцию и точки входа для открытия ордеров BUY или SELL. Подходит для определения краткосрочных и долгосрочных движений рынка, анализируя графики на любых таймфреймах. Адаптивн
Best Currency Strength Indicator
Tumelo Patrick Rakotsoane
4.5 (46)
Advanced Currency Strength Indicator The Advanced Divergence Currency Strength Indicator. Not only it breaks down all 28 forex currency pairs and calculates the strength of individual currencies across all timeframes , but, You'll be analyzing the WHOLE forex market in 1 window (In just 1 minute) . This indicator is very powerful because it reveals the true movements of the market.  It is highly recommended to  analyze charts knowing the performance of individual currencies or the countries eco
Попробуйте "Chart Patterns All in One" в режиме демо и получите бонус. Отправьте мне сообщение после тестирования в режиме демо, чтобы получить бонус. Оставьте комментарий после покупки, чтобы получить 8 высококачественных индикатора в качестве бонуса. Индикатор Chart Patterns All-in-One помогает трейдерам визуализировать различные графические модели, которые широко используются в техническом анализе. Он помогает определить возможное поведение рынка, но не гарантирует прибыльность. Рекомендуетс
Top Bottom Tracker - это индикатор, основанный на сложных алгоритмах, которые анализируют рыночную тенденцию и могут определять максимумы и минимумы тренда / Версия для MT5 . Цена будет постепенно увеличиваться, пока не достигнет 500$. Следующая цена --> $99 Особенности Отсутствие перерисовки Индикатор не меняет свои значения при поступлении новых данных Торговые Все пары Форекс Таймфрейм   Все таймфреймы Параметры ==== Конфигурация индикатора ==== Параметр конфигурации // 40 (Чем выше
Индикатор ручного построения зон коррекций основанных на теории Ганна. Определяются зоны путем математического вычисления с применением особых коэффициентов для различных таймфреймов начиная с м1 и заканчивая Д1. Индикатор работает как  с валютными парами и металлами, так и с крипто и даже акциями С помощью данного индикатора Вы можете легко построить опорные зоны покупок/продаж основанных на цикличности рынка, и принимать торговые решения при подходе к данным зонам Это даст Вам понимание напра
Эта система поможет найти высоковероятностные сделки в направлении сильных трендов. Возможность заработать прибыль появляется с помощью поиска завершения движения в одну сторону. Важная информация Для максимального использования потенциала сканера прочитайте полное описание (на английском языке): www.mql5.com/en/blogs/post/718109 Использование индикатора описано в записи в логе (на английском): Professional Trading With Strong Momentum Бесплатная версия индикатора работает только на парах EURUS
Wave Synchronizer - визуальный индикатор волнового анализа. Объединяет последовательности движения свечей и производит построение направленных волн, производя синхронные движения вместе с рынком. Начало каждой волны начинается с сигнальной стрелки, также есть оповещения. Индикатор никогда не перерисует и не передвинет стрелки на прошлой истории. Сигнальные стрелки появляются на закрытии свечи. Подстраивается под работу с любыми торговыми инструментами и тайм-фреймами. Прост в использовании и на
Другие продукты этого автора
About: A Fibonacci indicator is best used with other indicators like Pivots, Support/Resistance etc. Price tends to use Fibo levels as Support or Resistance lines. So, this indicator is very useful to know when price might reverse or if a level is crossed, price might continue the trend. Also, to find the best Take Profit and StopLoss lines. Don't use Fibo Indicator alone for trading as it might not always be accurate. Use it to make your strategies better as a supporting indicator. Settings: H
FREE
How To Use Check out this post for detailed description on  All Indicator extras and template: https://www.mql5.com/en/blogs/post/758259 The Best Heiken Ashi System is a simple trading system for trading based only two indicators for generate signals: Heiken ashi smoothed and Vqzz indicator multi-timeframe. The system was created for scalping and day trading but can also be configured for higher time frames. As mentioned, the trading system is simple, you get into position when the two indica
FREE
TDI Multi Timeframe Scanner: This Dashboard indicator uses the TDI (Trader's Dynamic Index) Indicator to find best trades. Read detailed How to Use Guide: https://www.mql5.com/en/blogs/post/758252 Extra indicators also available in above post. Checks for: - SharkFin Pattern Free indicator for SharkFin: https://www.mql5.com/en/market/product/42405/ - TDI Trend: Strong/Weak Trend Up/Down - TDI Signal: Strong/Medium/Weak Signal for Buy/Sell - Consolidation - Overbought/Oversold - Volatility Ban
This is a Sharkfin Arrows Indicator. Detailed explanation and TDI extras: https://www.mql5.com/en/blogs/post/759138 This indicator will show only Arrows. It does not have TDI symbols on chart. Please get the extras from links above for TDI indicators. Sharkfin Scanner (paid): https://www.mql5.com/en/market/product/123566 TDI Scanner Dash (paid): https://www.mql5.com/en/market/product/41826 About: This Indicator finds the Shark Fin Pattern. It will show an arrow in the current bar if RSI sha
FREE
This indicator is based on Guppy's GMMA Strategy. And shows arrows when GMMA lines cross up or down. To have this indicator and get alerts for Multiple Timeframes and multiple Pairs you can check out the demo of this GMMA Trend Scanner indicator: https://www.mql5.com/en/market/product/38747 About GMMA In Brief: GMMA attempts to identify trends by combining two groups of moving averages with differing time periods: The long-term EMAs (30, 35, 40, 45, 50, and 60) the behaviors of investors that h
FREE
This is a Multi-currency multi-timeframe Support/Resistance Scanner Dashboard for Metatrader 4 (MT4) platform. Get all extras and download free demo here: https://www.mql5.com/en/blogs/post/760210 Read detailed description in post above. And get the SR Indicator for individual charts. Features: Scan Support/Resistance zones (also called Supply/Demand zones) Show alert when price is inside these zones and highlights the pair/timeframe Show or hide SR zones price nearest to current price (Price
Profit Percent Series 2 The scanner dashboard available here (for  Free) : And read detailed information about MA Confluence here: https://www.mql5.com/en/blogs/post/747474 Here's a post about Common Settings for all Profit Percent Series Indicators: https://www.mql5.com/en/blogs/post/747456 Strategy: Main Signal Indicators (Any One): MA Cross (In-built) or Hull, OBV Cross, Heiken Ashi Cross Validation Indicators (Preferably less than 3): OBV (with Min Distance), Heiken Ashi, ADX, SuperTren
Dashboard uses Ichimoku Strategy to find best trades. Get extra Indicators/Template: And read more about detailed Product Description and usage here: https://www.mql5.com/en/blogs/post/747457 Please note: I won’t be able to add new settings. It already has 72 settings  :) Some people are using it with their EAs. And iCustom function can only take Max 64 settings. So, I cannot let it grow any further. I’ll definitely be maintaining the code and solving issues. Don’t worry. Please check all set
About: Get Free Scanner and example Strategies And understand detailed description here: https://www.mql5.com/en/blogs/post/759237 And also get example wrappers from above post. You can make your own wrappers if your indicators have complex conditions or for In-Built MT4 indicators. Features: - Specify your own Custom Indicator - Specify Buffer values and create Variables - Use those Variables to create your own Buy/Sell Conditions - Get Arrows Up/Down Signals - See Arrows Signals in Scanners
Abiroid Profit Percent Series 1: Arrows Indicator Stochastic Ichimoku with ATR Get the Scanner for free. For getting Profit Percentages for Multiple Timeframes and Multiple Pairs. And read detailed description about this indicator and all the settings here. And get extra Indicators, Templates and settings for download: https://abiroid.com/product/profit-percent-stoch-ichimoku-with-atr Watch the tutorial video here: https://youtu.be/C45-9kWPE2Q About The Strategy: This strategy has 3 main par
How the Indicator Works: This is a Multi-timeframe MA multimeter indicator which studies if price is above or below a particular EMA range and shows Red/Green/Yellow signals. Red: Price Below EMA range Green: Price above range Yellow: Price within range Indicator Properties: EMA Settings: - Default Period is 200. You can change all MA Settings like Period, MA Method (SMA, EMA, etc) or MA Applied Price (Close, Open, etc). - EMA Range list is a comma separated value list for different timeframes
FREE
Features: 1- Get OB/OS Levels from Golden MA Levels 2- Wait for Buy/Sell Start Level Cross 3- Optional: Should price cross Mid Level in earlier bars 4- Optional: Crossing bar High/Medium Volume 5- Optional: MA Stacked to check up/down trend for current TF 6- Optional: NRTR higher timeframes aligned Check Detailed blog post explained: https://www.mql5.com/en/blogs/post/758457 Levels with Buffers available here: Golden MA Levels Indicator: https://www.mql5.com/en/market/product/119515 Note: Arr
FREE
Features: - Moving Average Slope for Max Past Bars - Slope Period - Slope Thresholds - Multiple Slope Type options - See slope visually as a histogram - Info Panel Show/Hide Slope Calculations and Types: The slope value is calculated using the Slope Period. Suppose Period is 5, it will check the MA value for bar (x) and bar (x+5). And find the slope angle between them. Read detailed description about Slope Types and Settings here: https://www.mql5.com/en/blogs/post/747651
FREE
This Scanner Dashboard uses the Extreme TMA System Arrows Indicator to show good BUY/SELL signals. This Product contains dashboard only. It does not contain the Abiroid_Arrow_Extreme_TMA.ex4 indicator. Arrows indicator is not necessary for dashboard to work.  To see arrows, you can buy the arrows indicator separately if you like: https://www.mql5.com/en/market/product/44822 Dash shows Slopes for current and Higher Timeframes. - 1st diamond is current TF. Next diamonds are higher TFs (Please Not
Read detailed description and Get Free Demo and extra indicators: https://www.mql5.com/en/blogs/post/758610 Features: Halftrend Arrow Scan: Scan Max Past Bars for Halftrend arrows. Show how many bars back the arrow occurred in a bracket Past Bars Back Alerts: Num of bars back for which scanner will send alerts Halftrend HTF Align: Scan Higher timeframes for Trend Direction of Halftrend Indicator and if trends align show a slanting Green/Red Arrow for Up/Down trend Semafor 3 Check: Few bars bef
Features: - Current TF GMMA Cross and Trend (Mandatory Check.. G-Up/G-Down) - HTF GMMA Trend Check (Optional.. slanting arrow) - TDI or NRTR Trend Check (Optional.. diamond) Read post for detailed description and downloading extra indicators: https://www.mql5.com/en/blogs/post/758264 Scanner: This is a Dashboard Scanner for finding good trades using the GMMA method as base and TDI method for trend verification. All buttons for all Pairs and Timeframes are clickable and will change the chart f
Extreme TMA System with Arrows Indicator And Buy/Sell Boxes with Take Profit & Stop Loss This is a Non-Repainting Arrows Indicator based on the Extreme TMA System. It shows TMA cross signals and the best BUY/SELL signals. Along with the most predicted TakeProfit. And StopLoss based on TakeProfit ratio. Please note: This is an Arrows only Indicator. Dashboard is sold separately here: https://www.mql5.com/en/market/product/44825 About Indicator: This indicator shows BUY/SELL Signal Arrows and
Description This scanner uses 3LZZ TRO ex4 and scans for Semafors at given “Shift” bar. Scanner Detailed Settings: https://www.mql5.com/en/blogs/post/747456 Other Settings: Set Periods for Semafor 1,2,3 Set alerts on/off for Semafor 1,2,3 Shift bar (Bar on which semafor is scanned) Refresh After Ticks (Number of ticks when dash is refreshed) This scanner is pretty simplistic version. And a more detailed version with a different strategy is available here: https://www.mql5.com/en/market/product
FREE
Abiroid Multi Slope indicator allows you to calculate a Slope Histogram for any line of any indicator . Histogram is for 1 slope line only, but slope values can be calculated for 3 lines total. To have multiple histograms, add as many Slope indicators for custom indicators as you like on chart. You just need to provide the Indicator name, buffer value, slope's period and max number of bars back. By default it has slope calculation for TDI_v4.ex4 indicator. There is no way to specify parameters f
FREE
Moving Average Rainbow Stack: Free: Single Currency & Single Timeframe MA Stack Very useful for finding current and higher timeframe trends. Best suited for long term trend based trading. Use fewer MAs for quick scalping. And not suitable during low volatility. Only use during high volatility and steady trending markets. Use this to enhance your existing Trend based strategies to find best trends. Read detailed description https://abiroid.com/product/abiroid-ma-stack Available MTF and Scanner v
FREE
3 Level ZZ Semafor Scanner: This is a Dashboard indicator which uses 3LZZ Indicator in the background to find semafors. It will give priority to the semafors3 because they specify a strong signal. So, even if there is a sem1 or 2 on current bar, and if Sem3 was within "Check Previous Bars for Sem 3". Then it will show Sem3 instead. Read about this in detailed post: https://www.mql5.com/en/blogs/post/758250 And get all extra Indicators/Template from above link. Please note: Number of settings
Scanner Dashboard for Best Heiken Ashi VQZZ Arrows Indicator here: https://www.mql5.com/en/market/product/45900 Check out this post for detailed description on How To Use All Indicator extras and template: https://www.mql5.com/en/blogs/post/758259 Please note that if you are using too many pairs/timeframes, then VQZZ calculations might slow down the dashboard. So be careful not to use too many VQZZ Higher timeframes if you are using too many pairs. Also, VQZZ is based on higher timeframes. e.g
This is a slope indicator for COG (Center of Gravity) indicator.   Download extra COG Indicators and read detailed description and strategy here: https://www.mql5.com/en/blogs/post/759120 Description: You can set the Slope Threshold for indicating Buy/Sell heightened levels. In the above Image the Threshold is set to 0, because of that all Bullish slope is Green and Bearish is Red. Suppose we set Threshold to -10 and 10, then this is what we get: And also set Slope Period. Default is 5, which
This Indicator uses Center of Gravity (COG) Indicator to find you the best trades. It is a reversal based Swing Indicator which contains an  Arrows Indicator. That you can buy here from Metatrader Market. Check out this blog post for detailed How to Use Guide and links to free scanner: https://www.mql5.com/en/blogs/post/758262 Scanner needs this arrows indicator in same directory to run Copy scanner ex4 in same folder as your Arrows Indicator: MQL4/Indicators/Market/ All extra indicators and
This strategy is best used for Trend based trading. While market is trending, price still makes smaller ranges. Darvas boxes show breakouts from these small ranges, while still following the original market trend. Detailed Description: https://www.mql5.com/en/blogs/post/747919 Features: Darvas - Check Darvas Box Breakout -   Check Price Above/Below MA or Darvas Box has crossed MA -   Min, Max Box Height -   Max Distance Between Entry Price and Darvas Box Other Indicators: - NRTR Trend Check
Free scanner available here: https://abiroid.com/product/abiroid-ema-scalper Basic Strategy: 1: MA Crossover Up/Down Arrow (Mandatory Check) Optional Checks: 2: If NRTR Check On (Optional): For BUY: Check if NRTR blue and For SELL: NRTR Red If NRTR Shadow Distance On (Optional): Check price for 'x' bars back: at Shadow distance (ATR Multiplier distance) from NRTR line. 3: If High Volume bar On: Check if High Volume or if Medium (if on) Volume bar 'x' bars back 4: If HTF Trend Align On (Optiona
This strategy is useful for small timeframe scalping and binary options. Best timeframes: M5,M15,M30 M1 timeframe is too unpredictable. So be careful with that. Read Detailed Description and Get All: - Free Demo - Free Scanner - Extra Indicators ex4 files from https://abiroid.com/product/abiroid-donchian-scanner-and-arrows Arrows Demo only works in strategy tester. So, Arrows Demo won't work with the free scanner. Scanner needs "Abiroid Donchian Arrow.ex4" to work. So make sure both arrows and
Read detailed description and extra indicators: https://www.mql5.com/en/blogs/post/758622 This Supertrend dashboard is a multi-currency and multi-timeframe dash which gives signals whenever supertrend changes it's trend direction. Please note, that this is not a full trading system. It will help you get initial Supertrend signals and higher timeframe trend alignments. And it’s to be used with your own Supertrend Strategies. Features: 1- Select one of In-Built Supertrend Indicators: xSupertren
This is a multi-timeframe multi-currency Fibo (Fibonacci levels) and Pivots scanner which also shows Missed Pivot count and Fibo Golden Ratio Zones. Features Select separate Pivot Timeframes for each Dashboard Timeframe Check when price is near a Pivot point Check for Price Crossing Pivot Point Use Mid Pivots (Optional) Show Missed Pivots (Optional) Show High Volume Bar Use Fibo (Optional) Use Fibo Golden Ratio (Optional) Set your preferred Timeframe for Fibo or Pivots Detailed blog post: https:
This strategy is best used for Scalping and Binary Options. Strategy: There are 3 EMAs: Faster, Medium and Slower. When Price is Trending, wait for Price to bounce an EMA and scalp at each bounce. Features: - Check if 3 MAs are Stacked - Check Price Bounce Off MAs (Faster, Medium, Slower) - Min Distance Between Faster and Medium MA Filter - Max Distance Between Entry Price and Faster MA Filter - High Volume Check - Heiken Trend Check - Volatility Check - Higher/Lower Timeframes MA Stacked check
Фильтр:
Нет отзывов
Ответ на отзыв