Radius Trend by ChartPrime
- Индикаторы
- Biswarup Banerjee
- Версия: 1.0
- Активации: 20
Radius Trend by ChartPrime
Overview:
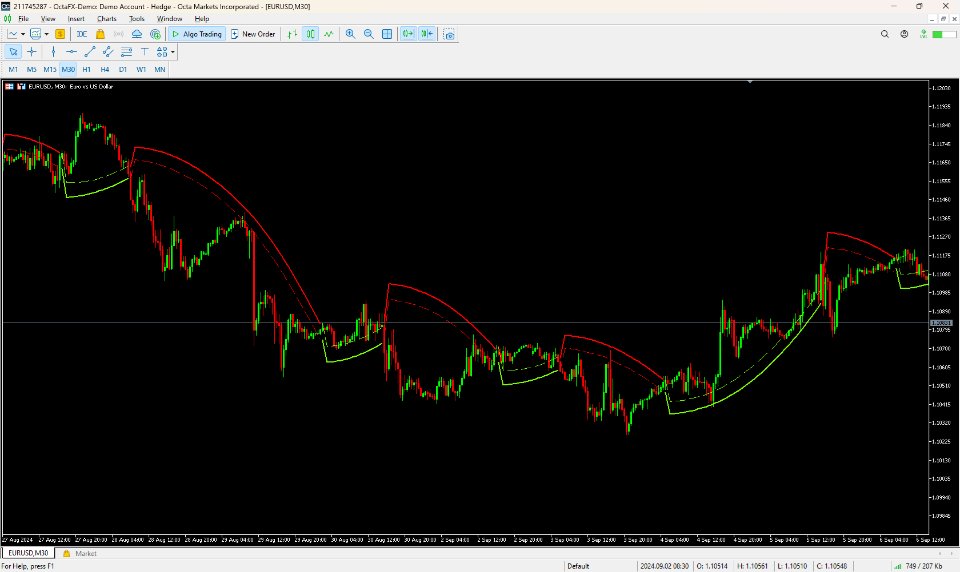
The Radius Trend indicator is an advanced technical analysis tool designed to visualize market trends through an adaptive, radius-based method. With dynamic bands that react to price action and volatility, it offers traders a unique insight into trend strength, direction, and potential reversals. Unlike traditional trend lines, this indicator adjusts dynamically like a radius sweeping across the chart, creating a fluid approach to trend analysis.
Key Features:
- Dynamic Trend Band: Automatically adapts to market conditions, adjusting based on price action and volatility.
- Radius-Based Adjustment: Uses a step-based radius approach to modify the angle of the trend band for a more responsive analysis.
- Volatility-Adjusted Calculations: Incorporates volatility by considering the price range, ensuring accurate band placement.
- Trend Direction Visualization: Color-coded visualization of trend direction, easily distinguishing between uptrends and downtrends.
- Flexible Parameters: Allows for full customization of radius step and initial distance to suit individual analysis preferences.
Additional MT5-Specific Features:
- Buffer Values for EA Integration: The indicator provides buffer values for easy integration with Expert Advisors (EAs), enabling automated trading strategies.
- Alerts and Notifications: Includes alerts, email notifications, and push notifications to keep traders informed of potential trend reversals or significant market movements.
- Multiple Timeframe Support: The Radius Trend can be applied to any timeframe, providing insights across different trading windows.
Usage:
- Trend Identification: Use the color and direction of the main trend band to determine current market trends with precision.
- Trend Strength Analysis: Analyze the slope and consistency of the trend band for insights into the strength of the trend.
- Reversal Detection: Look for price crossing the main band or dashed bands as potential signals of trend reversals.
- Volatility Assessment: The distance between the price and trend bands provides a visual cue on market volatility, indicating potential changes in momentum.
User Inputs:
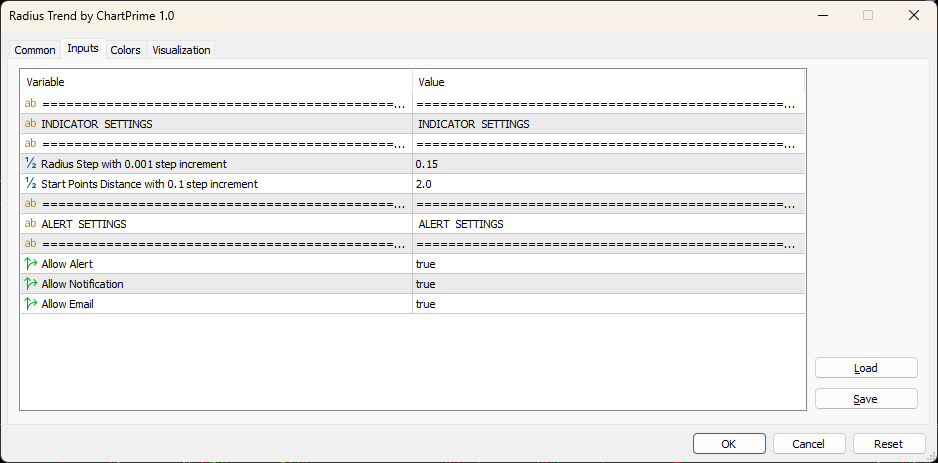
- Radius Step: Controls the rate of angle adjustment for the trend band (default: 0.15, step: 0.001).
- Start Points Distance: Sets the initial distance multiplier for the trend band calculation (default: 2, step: 0.1).
