Candle Information with Session filter
- Индикаторы
- Davit Beridze
- Версия: 1.2
- Обновлено: 24 сентября 2024
- Активации: 10
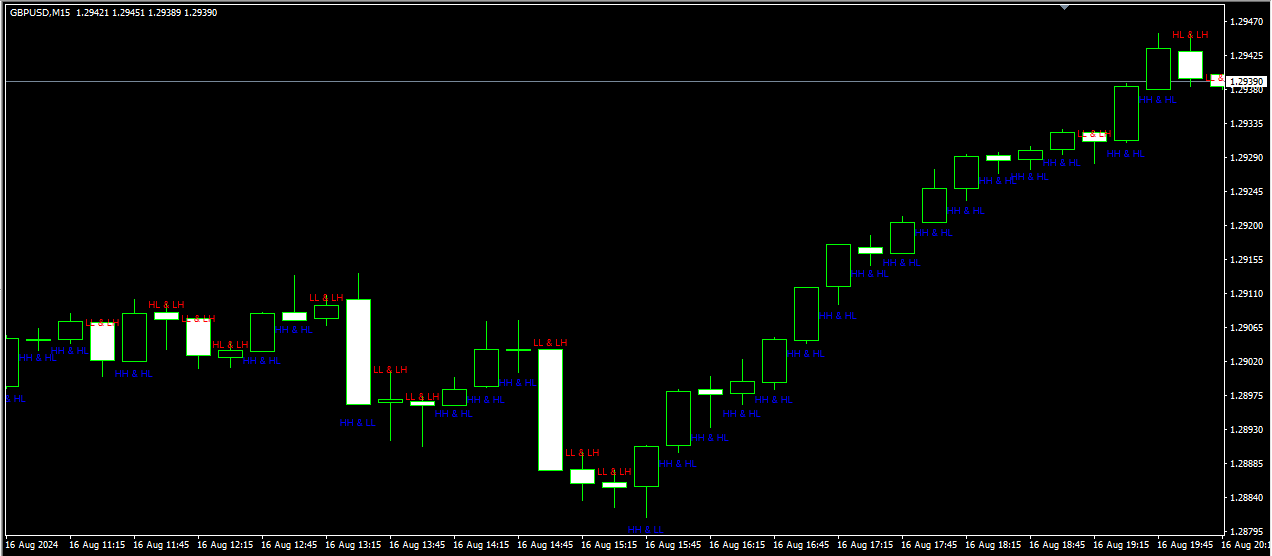
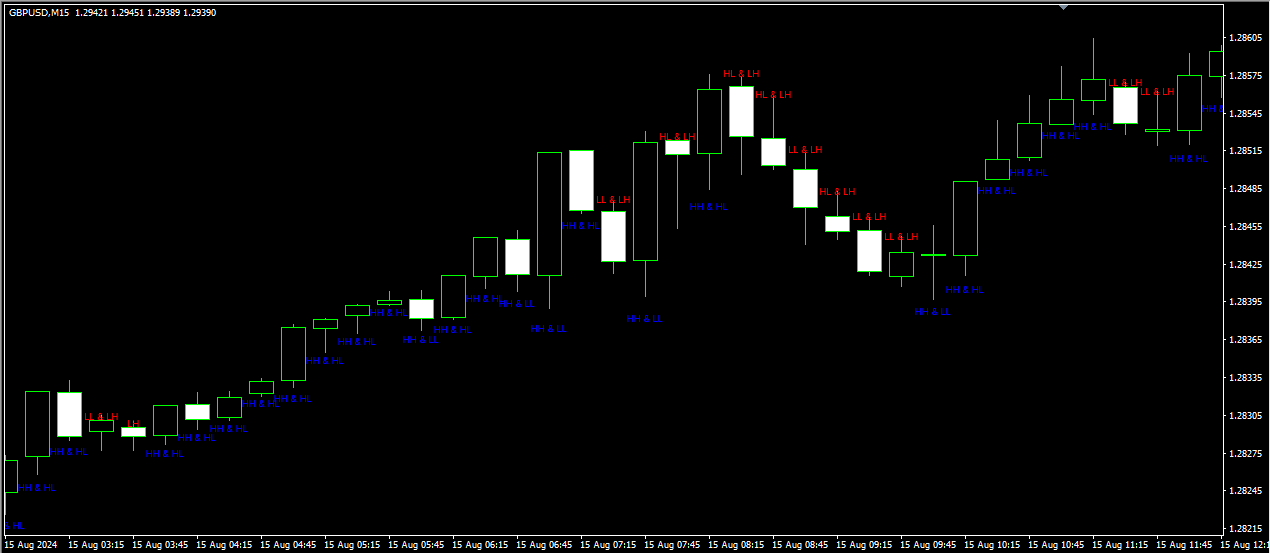
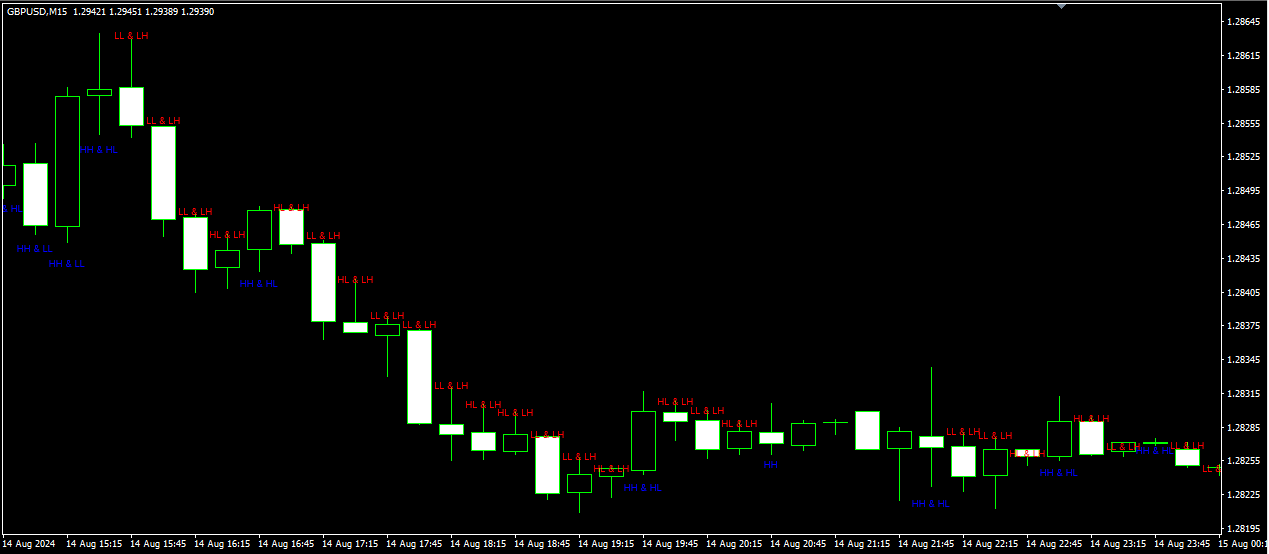
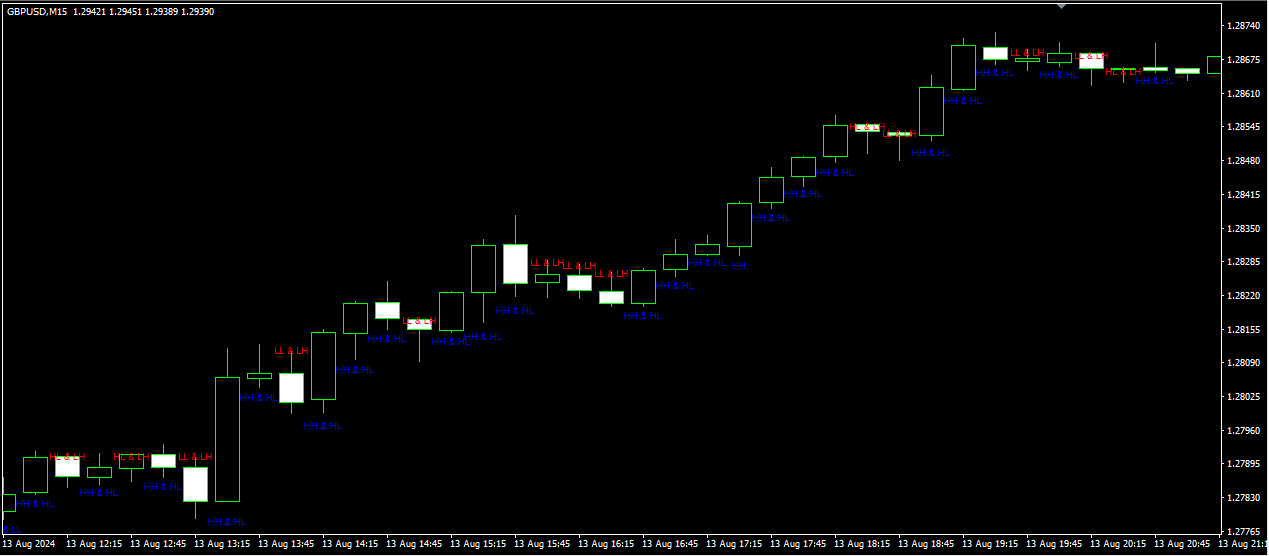
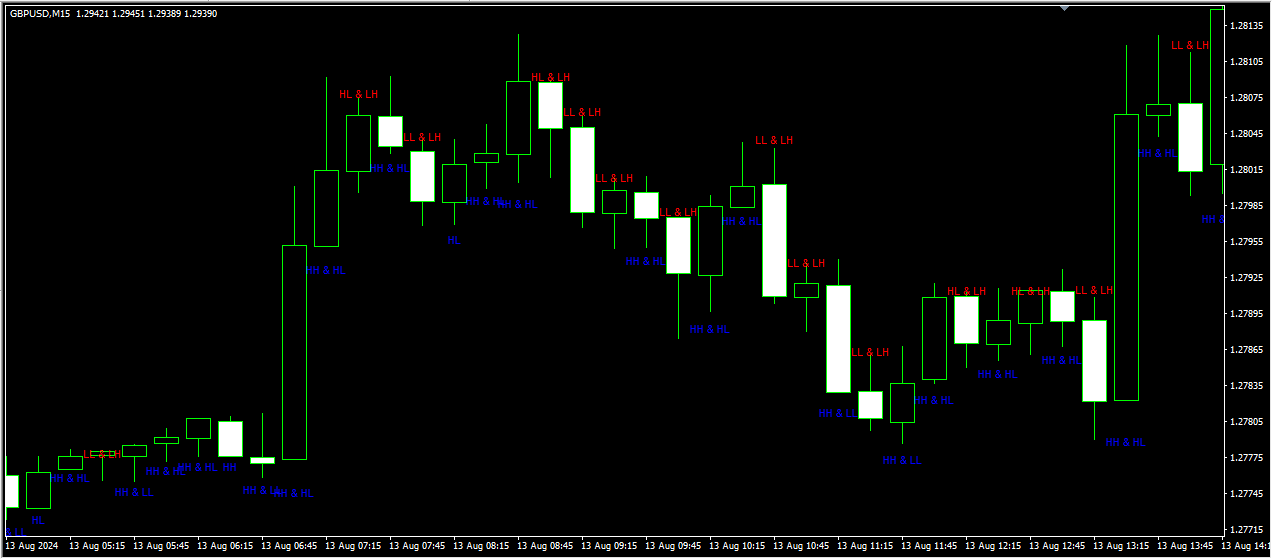
Индикатор "Candle Info" для MetaTrader 4 (MT4) помогает трейдерам анализировать и визуализировать ключевые свечные формации прямо на графике. Определяя формации, такие как Higher High (HH), Lower Low (LL), Higher Low (HL) и Lower High (LH), индикатор дает понимание трендов рынка и возможных ценовых движений.
Основные функции:
- Свечные формации: Определяет и помечает HH, LL, HL, LH, а также их комбинации, такие как HH & HL (бычий тренд) и LL & LH (медвежий тренд).
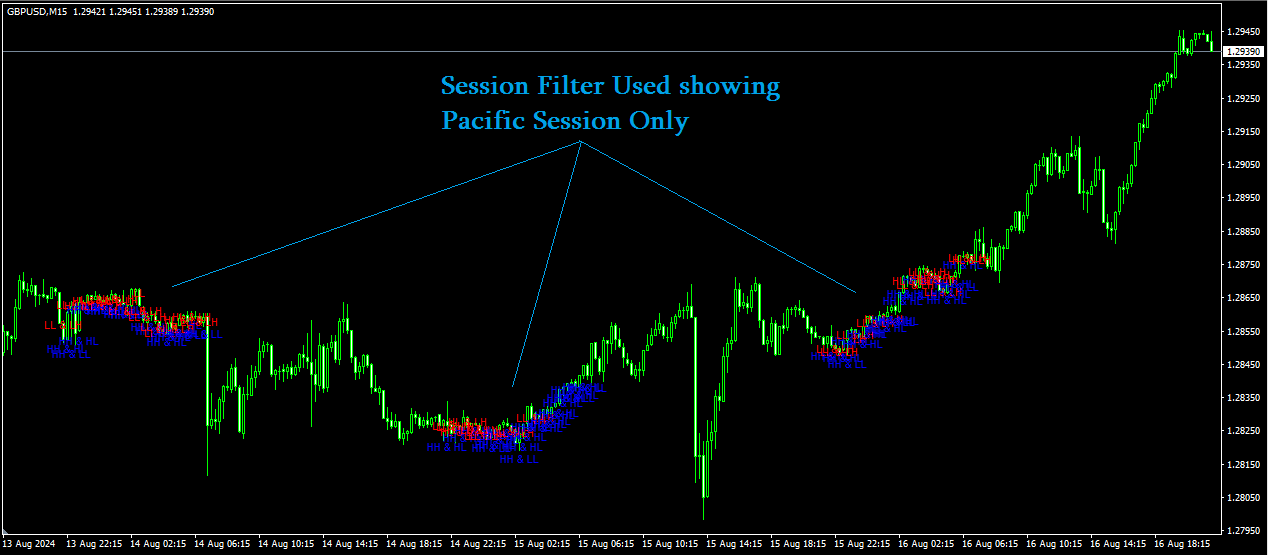
- Фильтры по сессиям: Позволяет фильтровать формации по основным торговым сессиям (Токио, Лондон, Нью-Йорк, Сидней) для лучшей концентрации на важных рыночных часах.
- Оповещения: Настраиваемые уведомления на экране, пуш-уведомления, email и звуковые оповещения о новых формациях.
- Настройки: Возможность изменять цвета, размеры текста и выбирать, какие сессии или формации отображать.
Идеально подходит для трендовых и сессионных стратегий, индикатор "Candle Info" упрощает анализ рынка, помогая трейдерам быстрее принимать взвешенные решения.
Great Indicator from Mr. Beridze Only for those who know how to appreciate good, professional and effective work...
it's an essential aid to understand what's happening on your chart and the direction of the price
5 stars for this
The author just added a great improvement... using this indicator is a pleasure