• Обзор
  • Отзывы
  • Обсуждение

Abiroid PinBar Arrow

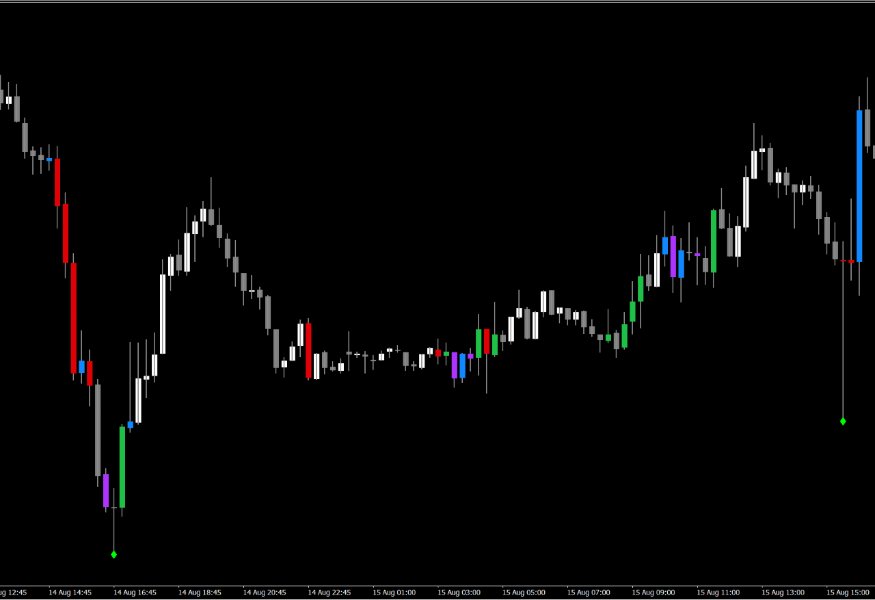
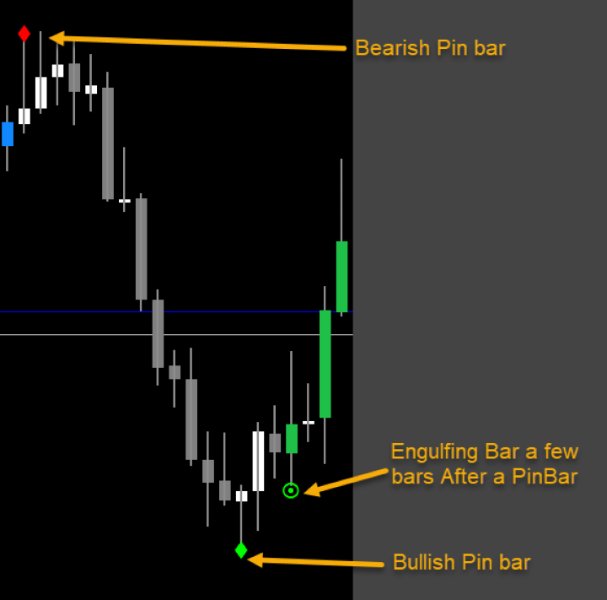
This is a Pinbar Arrows which will check for reversal pin bars. 

Pin bars are not good for trend continuation. They are best when an ongoing trend ends and they signal a reversal. But it is better to validate the reversal.

Once you purchase, please send me a comment.

Since mql5 only allows a single ex4 per product, I'll send the scanner separately.

Scanner ex4 needs to be placed in same folder as the Arrows. In Market folder. 


Features:

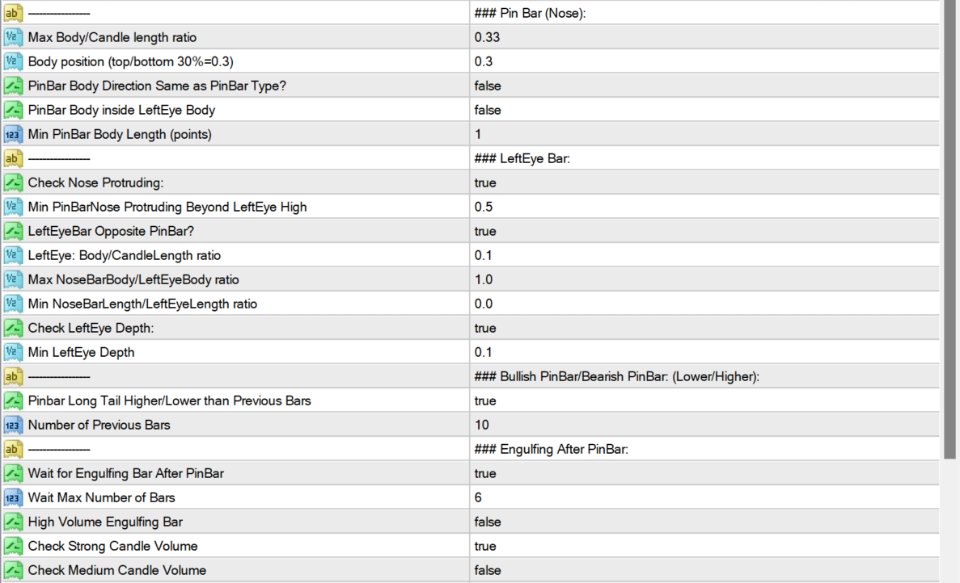
  • Choose Pin bar checks: PinBar Body Options, PinBar Nose and Tail Options, Left Eye Options
  • Engulfing Bar After Pin Bar
  • Overbought/Oversold with CCI or Stochastic or RSI
  • Distance of Pin bar body from nearest Quarter Point (Option to use Majors, halfpoints, quarters)
  • Volatility Check


Detailed Post with Extra Downloads:

https://www.mql5.com/en/blogs/post/758569


How to Use:

Note that Quarters Lines indicator is a separate indicator available in extras section above. The arrows indicator uses it internally and won’t display major lines on chart.

Very strong stop hunt pin bars, if you keep a very low candle body/length ratio: 0.015

Pin bars only if price is Overbought/Oversold, using CCI or Stochastic or RSI. Set your own custom period and OB/OS levels and other parameters.


What Symbols Mean:

By default, Diamond is for a pinbar. And a circle is for engulfing candle after a pinbar. Bracket numbers show how many bars back the pin bar have happened.

Scanner and pin bar Arrows have similar settings. So a set file can be used interchangeably. Scanner does not have settings from arrows for debug messages and arrow spacing. Everything else is the same. So, same set file will work for both.

Settings:

shiftBars: This setting allows you to specify the number of bars to shift the indicator. A value of 0 means the indicator is applied to the current (most recent) bar.
MaxPastBars: This setting determines the maximum number of past bars the indicator will consider. A value of 0 means all past bars will be included.

    Settings are related to the Pin Bar Nose:

    MaxNoseBodySize: It determines the maximum ratio of the Pin Bar body size to the total candle length.
    NoseBodyPosition: This setting specifies the position of the Pin Bar body within the candlestick. A value of 0.4 indicates the body should be located near the middle (40%) of the candlestick.
    NoseSameDirection: When set to true, it means the Pin Bar body’s direction must be the same as the Pin Bar type (bullish or bearish).
    MinimumNoseLength: It determines the minimum length (in points) for the Pin Bar body.


      Settings pertain to the Left Eye Bar and additional checks:

      NoseProtruding: It sets the minimum amount the Pin Bar nose should protrude beyond the high of the Left Eye Bar.
      LeftEyeOppositeDirection: When true, the Left Eye Bar should have an opposite direction to the Pin Bar.
      LeftEyeMinBodySize: This defines the minimum ratio of the Left Eye Bar’s body size to the total candle length.
      LeftEyeDepth: It sets the minimum depth of the Left Eye Bar.


        Check if Pin bar nose is highest/lowest compared to all previous bars:

        checkPinHL: When true, it checks if the Pin Bar has a long tail that’s higher or lower than the previous bars.


          Check if any engulfing bars, few bars after the pin bar:

          checkEngulf: This setting determines whether the indicator should wait for an Engulfing Bar after the Pin Bar.
          HighVolumeEngulf: When set to true, it checks for a high-volume Engulfing Bar.

            An engulfing bar will fully engulf (cover) it’s previous bar. If it’s a Bullish pin bar, the engulfing bar will be bullish. And for bearish pin bar, it needs to also be bearish engulfing bar.

            It is marked by a circular symbol by default, but you can change the symbols.


            If you need the very next bar after pin bar to be engulfing, then keep: “Wait Max Number of Bars” to 1.

            By default it is 5, meaning after a pinbar, engulfing bar needs to happen within 5 bars, or else it won’t be detected and will not be marked by that symbol.


            Overbought/Oversold Checks using Stochastic or RSI or CCI

            UseOBOS: This setting enables the use of overbought/oversold checks.

            Stochastic Params: KPeriod,DPeriod,Slowing,MA_Method,PriceField,Stoch_Mode

            RSI or CCI Params: Period, OB/OS


            Volatility:

            UseVolatility: When true, it incorporates high volatility checks.

            It uses the Chaikin Volatility (CHV). Low volatility produces a lot of pin bars. So not a good time to trade:


            Major Points (like 1.00000 or half points: 1.50000 or quarter points like 1.25000 and 1.75000)

            checkFullPoints, checkHalfPoints, checkQuarterPoints: If enabled, this checks for price proximity to major points.


            Set your own Major Points. Because lower timeframes like M5 need major points like 1.00100, 1.00200 etc as majors. And higher timeframes like H1 need 1.00000, 1.10000, 1.20000 etc as majors.

            Also, set minimum distance of pin bar from a major line, based on different timeframes. Use cross hairs tool to find in between distances.


            Chart Symbols, Debug and Alerts:

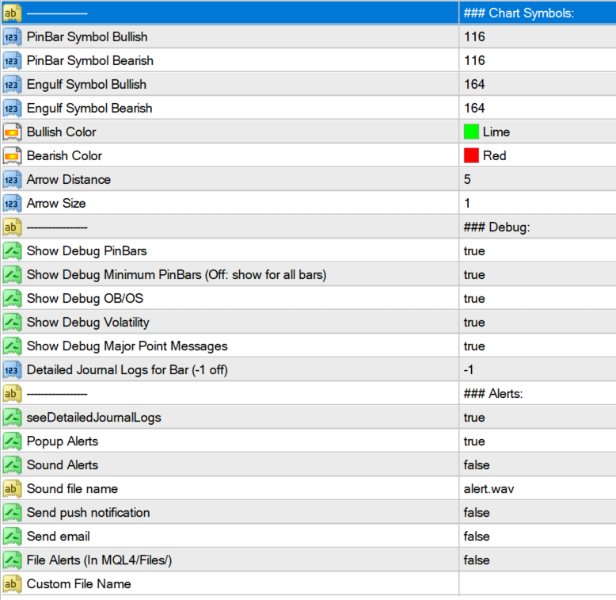
            ArrowDistance: It specifies the distance of arrows on the chart.
            ArrowSize: This sets the size of the arrows.
            BullishColor: It defines the color of bullish signals.
            BearishColor: Color of bearish signals.
            PinBar Symbol: Code for pinbar symbols.
            Engulfing Symbol: Code for engulfing bar symbols.

              Debug:

              ShowDebugText: When set to true, this enables the display of debug messages on bars.
              ShowDebugMin: Enabling this setting will display minimum debug messages. And not show PinBar detailed messages. Only set to false if you need to see why a pin bar was not detected.
              DebugOnBar: This setting allows you to specify which bar to generate detailed journal logs for. A value of -1 means it’s turned off.

              This is a better way to debug why a pin bar was skipped. It shows all checks run for a particular bar. Suppose bar number is: 4172


              Then the experts tab logs will show details:

              It finds the bar as a pin bar. But rejects it as a Bearish bar because it’s nose is not protruding. And rejects it as Bullish bar because it is not a green bull bar.

              This is useful because the debug messages on chart show only the last check and reason for skipping.


              You can control individual debug messages by turning on/off:

              "Show Debug PinBars" or "Show Debug Volatility" or "Show Debug Major Points" or "Show Debug OBOS": When set to true, it displays debug messages showing why a signal was skipped.


              Debug Message Meanings:

              PinBar Related Debugs 

              Common:

              NO-BODY-RATIO: PinBar: Nose body to candle length ratio MORE than (Max Body/Candle length ratio)

              NO-LEFT-BODYLEN: Left eye: body to candle length ratio less than (LeftEye: Body/CandleLength ratio)

              NO-NOSE-INSIDE-LEFT-BAR: Nose body NOT inside Left Eye bar’s High and Low

              NO-LEFT-BODY: Nose body to Left Eye body ratio is MORE than (Max NoseBarBody/LeftEyeBody ratio)

              NO-LEFT-LEN: Nose length to Left Eye length ratio is LESS than (Min NoseBarLength/LeftEyeLength ratio)

              NO-NOSE-INSIDE-LEFT-BODY: Nose body is NOT inside Left Eye body


              Bearish:

              NO-BOTTOM: SELL: Nose body position is NOT in bottom part of the bar: 0.3

              NO-LEFT-BULL: SELL: Left Eye is NOT bullish

              NO-BEAR: SELL: Nose is NOT bearish

              NO-LEFT-LOW: SELL: Left Eye low is NOT low enough

              NO-HIGH: SELL: PinBar Nose NOT Highest compared to past bars

              NO-PROT-BEAR: SELL: Nose NOT protruding HIGHER than ratio (Min PinBarNose Protruding Beyond LeftEye High)


              Bullish:

              NO-TOP: BUY: Nose body position is NOT in top part of the bar: 0.3

              NO-LEFT-BEAR: BUY: Left Eye is NOT bearish

              NO-BULL: BUY: Nose is NOT bullish

              NO-LEFT-HIGH: BUY: Left Eye high is NOT high enough

              NO-LOW: BUY: PinBar Nose NOT Lowest compared to past bars

              NO-PROT-BULL: BUY: Nose NOT protruding LOWER than ratio (Min PinBarNose Protruding Beyond LeftEye Low)


              Other Debugs:

              NO-MAJOR: NOT Near any Major Points

              NO-VOLA: NO High Volatility

              NO-OB: No Overbought in case of a Bearish pinbar signal

              NO-OS: No Oversold in case of a Bullish pinbar signal


              Conclusion:

              Pinbars are useful reversal signals. Best used during a good volatility market. To find when a trend might end. Not good to be used as a standalone.

              Needs validation from other indicators like:

              • Major levels or Pivots
              • Overbought/Oversold levels
              • Other candle patterns like engulfing bars
              • High volume bar in opposite direction

              Don’t use all validating indicator simultaneously as signals will be very limited.

              Рекомендуем также
              Fractals AM
              Andriy Matviyevs'kyy
              Классический индикатор. Индикатор Fractals выполняет анализ ценовых фигур, которые образуются на свечном графике и отображают точки разворота рыночной тенденции. Индикатор состоит из свечей, средняя из которых является либо самой высокой (фрактал вверх), либо самой низкой (фрактал вниз).  Максимумы и минимумы, обозначенные индикатором на графике, рекомендуется воспринимать в качестве точек, которые образуют линии поддержки и сопротивления. В отличии от оригинального индикатора где фракталы форми
              FREE
              Схождение возникает, когда более высокие максимумы и более высокие минимумы восходящего тренда дополнительно подтверждаются появлением более низких минимумов на нашем индикаторе, что помогает подтвердить увеличение импульса и более вероятное продолжение тренда. И наоборот для нисходящего тренда. Расхождение возникает, когда появляются более высокие максимумы восходящего тренда, которые не подтверждаются появлением более низких максимумов на нашем индикаторе, следовательно, сигналы основного импу
              Индикатор Trend Map создан для обнаружения тенденций движения цены и позволяет быстро определить не только направление тренда, но и понять уровни взаимодействия покупателей и продавцов. Он не имеет настроек и поэтому может быть воспринят так, как он сигнализирует. Он содержит всего три линии, каждая из которых предназначена для однозначного восприятия текущего момента. Линия 2 характеризует глобальную направленность движения цены. Если мы видим, что две другие линии выше этой линии, то можно го
              Индикатор торговой платформы MetaTrader 4, RSI TrendLine Divergency Message - три в одном, в отличие от стандартного имеет систему оповещений об изменении рыночной ситуации, состоящую из сигналов: Пересечение Главной линией уровней крайних зон и уровня 50%; Пересечение Главной линией Трендовой линии в окне индикатора; Дивергенция на последнем баре. Параметры экстремальных, среднего уровней и зон дивергенции - настраиваемые. Параметры Language – выбрать русский/английский язык; Options – настро
              Description Very precise patterns to detect: entry signals as well as breakout, support and resistance reversal patterns. It points out zones in which, with a high probability, institutional orders with the potential to change the price’s direction and keep moving towards it, have been placed.  KEY LINKS:   Indicator Manual  –  How to Install   –  Frequent Questions  -  All Products  How is this indicator useful? It will allow you to trade on the order’s direction, once its direction has been id
              Индикатор Before предсказывает наиболее вероятное краткосрочное движение цен на основе сложных математических расчетов. Большинство стандартных индикаторов, обычно использующихся в торговых стратегиях, основаны на довольно простых расчетах. Это не значит, что в период их создания в мире не было выдающихся математиков. Просто в те времена еще не существовало компьютеров или их мощности не хватало для последовательного проведения сложных математических операций. В наши дни любой смартфон намног
              About  Holy Renko is a trend identifier capable of identify small and long market movements. This indicator should be use in Renko Charts. VIDEO (information and tips) [HERE] How to install Renko Charts [HERE] Features Developed for Renko Charts Easy to analyze Fast signals Not repaint (when candle close)  Statistics panel Filters false signals Alerts, emails and push notifications  Advantages of Renko Chart Easy to install Easy to analyze Filter out the noise of wicks  Easy ident
              Vortex MT4
              KEENBASE SOFTWARE SOLUTIONS
              The Vortex Indicator was first presented by Douglas Siepman and Etienne Botes in January 2010 edition of Technical Analysis of Stocks & Commodities. Despite its based on a complex implosion phenomenon, the vortex is quite simple to interpret. A bullish signal is generated when +VI line cross above the -VI line and vice versa. The indicator is mostly used as a confirmation for trend trading strategies. The Vortex was inspired by the work of Viktor Schauberger, who studied the flow of water in tur
              Этот индикатор основан на Bollinger Bands, применяемом на одном или нескольких таймфреймах и на любой кросс-паре. При обнаружении сигнала на покупку или на продажу индикатор отображает всплывающее оповещение. Он также рисует вертикальную полосу на ценовом графике: зеленый для покупки, красный для продажи, белый для флета. Всплывающие сообщения и вертикальные полосы отображаются для сигналов BUY или SELL, когда значения Bollinger Bands согласованы на всех выбранных таймфреймах , в противном случа
              VR Cub
              Vladimir Pastushak
              VR Cub это индикатор что бы получать качественные точки входа. Индикатор разрабатывался с целью облегчить математические расчеты и упростить поиск точек входа в позицию. Торговая стратегия, для которой писался индикатор, уже много лет доказывает свою эффективность. Простота торговой стратегии является ее большим преимуществом, что позволяет успешно торговать по ней даже начинающим трейдерам. VR Cub рассчитывает точки открытия позиций и целевые уровни Take Profit и Stop Loss, что значительно повы
              Power Renko is an indicator which plots Renko bricks underneath the chart using a histogram. You can select the brick size and the timeframe of the Renko bricks as well as whether or not to use the close price or the high/low price of the candles. Renko bricks are based on price alone, not time, therefor the Renko bricks will not be aligned with the chart's time. They are extremely useful for trend trading and many different strategies can be formed from them. Buffers are provided allowing you t
              Check My Product Contact me to discover all my services  Supply and demand zones are one of the most basic things a beginner forex trader learns. These zones are so important, price reacts off of them even after years since they first developed. And with the supply and demand zones indicator, a forex trader might not need to worry about drawing all these historical zones one after the other. The supply and demand zone indicator accurately draws the supply and demand zones of a currency pair
              Индикатор показывает потенциальный направление тренда по циклично-волновой зависимости. Таким образом, все лучи пересечения будут оптимальными лучами, в направлении которых ожидается движение цены с учетом периода индикатора. Лучи можно использовать как направление потенциального движения рынка. Но не надо забывать, что подход должен быть комплексным, сигналы индикатора требуют дополнительной информации для входа в рынок.
              В основе графиков Ренко лежит отслеживание ценового движения. Если цена выходит за пределы определенного диапазона, на графике отображается бар ("кирпичик") выше или ниже предыдущего. В результате мы четко видим движение цены и важные уровни поддержки/сопротивления. Так как классический график Ренко не зависит от времени, его довольно трудно использовать вместе с другими техническими индикаторами. Это особенно касается тестирования вашей стратегии на истории. Именно для преодоления этого неудобс
              Download the free version   here. Divergence Divergence refers to when the price of a currency pair moves in one direction while the trend indicator is moving in the opposite direction. With divergence, there can be positive and negative signals. Divergences in Forex trading are quite common signals of technical analysis. These are basic early Forex signals indicating the trend reversal and filter false signals. Application of this indicator It is usually not easy to detect divergences by the t
              What are Fibonacci Numbers and Lines? Fibonacci numbers are used to create technical indicators using a mathematical sequence developed by the Italian mathematician, commonly referred to as "Fibonacci," in the 13th century. The sequence of numbers, starting with zero and one, is created by adding the previous two numbers. For example, the early part of the sequence is 0, 1, 1, 2, 3, 5, 8, 13, 21, 34, 55, 89,144, 233, 377, and so on. The Fibonacci sequence is significant because of the so-call
              Owl smart levels
              Sergey Ermolov
              4.58 (55)
              Версия MT5  | Как установить?  | FAQ Индикатор Owl Smart Levels   – это полноценная торговая система внутри одного индикатора, которая включает в себя такие популярные инструменты анализа рынка как усовершенствованные   фракталы Билла Вильямса , Valable ZigZag, который строит   правильную волновую структуру   рынка, а также  уровни Фибоначчи,   которые   отмечают точные уровни входа в рынок и места взятия прибыли. Подробное описание стратегии Инструкция по работе с индикатором Советник-помошник
              Это трендовый индикатор без перерисовки Разработан вместо стратегии бля бинарках опционов (по цвету свечи мартингейл) Так же хорошо работает в торговле на рынке форекс Когда открывать сделки ( бинарные опционы ) Сигнал появится в месте с свечой сигналит на текущую свечу  Открывать сделку стоит на одну свечу текущего таймфрейма рекомендуется м1 и М5 При появлении синей точки открываем сделку вверх При появлении красной точки открываем сделку в низ. Как открывать сделки на Форекс. При полу
              Данный индикатор является бесспорным лидером среди индикаторов. И для этого утверждения есть веская причина. Индикатор строит очень качественный канал в котором формирует сигналы на вход! Что является идеальной стратегией для трейдера, поскольку трейдер всегда колеблется при выборе стратегии для работы. То есть данный индикатор позволит вам решить дилемму выбора работы по тренду или в канал, поскольку совмещает эти две основные концепции. Работа с индикатором очень проста - вы просто реагируете
              Концепция Концепция возврата к среднему значению (mean reversion) в торговле основана на том, что цены в конечном итоге возвращаются к своему среднему значению после периода дивергенции, или отклонения от исторического среднего значения. Трейдеры, следующие данной концепции, обычно ждут, когда цена актива значительно отклонится от своего среднего значения, а затем открывают сделки, ожидая возвращения цены. Такая тактика также известна как повторное соединение (re-coupling) или схождение (converg
              The trend is your friend! This is what this indicator is all about. Follow this famous saying and be safe. Characteristics: Buy/Sell signals fixed on the close of a bar. Works on all symbols and all timeframes. Clear visual market trend laser line, Buy/Sell signal arrows, market strength meter, TP1 & TP2 boxes. Visual signals when to enter, when to exit the market. No repainting. Compatible with Flexible EA for trading automation. (Ask for a free set file optimized to perform 2010-2018) Para
              Индикатор отображает на графике ренко-бары, строит по ним быструю и медленную скользящие средние, Stochstic и выдает сигналы на покупку/продажу: сигнал на покупку формируется при расположении быстрой скользящей выше медленной и пересечении сигнальной линией stochastic нижнего уровня снизу вверх; сигнал на продажу формируется при расположении быстрой скользящей ниже медленной и пересечении сигнальной линией stochastic верхнего уровня сверху вниз. Ренко - специализированное отображение движения це
              Индикатор определяет и отображает на графике гармоничный паттерн Акула согласно схеме, приведенной на скриншоте. Выделение паттерна производится по вершинам индикатора ZigZag (включен в ресурсы, не требует дополнительной установки). В момент распознавания паттерна выводится сообщение во всплывающем окне, отправляются оповещения на мобильное устройство и электронный почтовый ящик. Индикатор выделяет не только завершенную фигуру, но и момент ее формирования. На этапе формирования фигура отображает
              Forex Indicator "MACD with Trend ZigZag" for MT4 MACD   indicator itself is one of the most popular tool for trend trading "MACD with Trend ZigZag" is excellent for using   with Price Action entries or in combination with other indicators Use this indicator to select most accurate entry signals: - If MACD is above 0 (green color) and ZigZag line is upward - search only for Buy Price Action patterns -  If MACD is below 0 (pink color) and ZigZag line is downward - search only for Sell Price Action
              Trend Trading - это индикатор, предназначенный для получения максимальной прибыли от трендов, происходящих на рынке, путем определения времени отката и прорыва. Он находит торговые возможности, анализируя, что делает цена во время установленных тенденций. [ Руководство по установке | Руководство по обновлению | Устранение неполадок | FAQ | Все продукты ] Торгуйте на финансовых рынках с уверенностью и эффективностью Прибыль от устоявшихся тенденций без проволочек Признать прибыльные откаты,
              Mastodon - отображает потенциальные точки входа в рынок. Согласно теории волн Mastodon отображает ход крупной волны, в то время как осциллятором можно уточнить точку входа, тоесть поймать ценовое движение внутри её, т.е. мелкие “подволны”. Правильно понимая волновую природу ценовых движений и используя индикатор Mastodon в связке с осциллятором, можно создать собственную торговую систему, например, вход в рынок после образования крупной волны с последующим выходом, когда эта волна сменилась д
              This index can be traced back to historical transactions, and can clearly see the trading location, trading type, profit and loss situation, as well as statistical information. Showlabel is used to display statistics. Summy_from is the start time of order statistics. This parameter is based on the opening time of the order. Backtracking can help us to correct the wrong trading habits, which is very important for beginners to learn manual transactions. This index is suitable for each time
              Noize Absorption Index - is the manual trading system that measures the difference of pressure between bears forces and bulls forces. Green line - is a noize free index that showing curent situation. Zero value of index shows totally choppy/flat market.Values above zero level shows how powerfull bullish wave is and values below zero measures bearish forces.Up arrow appears on bearish market when it's ready to reverse, dn arrow appears on weak bullish market, as a result of reverse expectation. S
              PABT Pattern Indicator - это классическая реализация одного из сигнальных паттернов.  Логика индикатора заключается в том, что он определяет ситуации в которых максимум и минимум сигнального бара находится в пределах максимума и минимума предыдущего бара, тем самым показывает разворот тренда. Для сигнала на покупку сигнальный бар закрывается выше цены открытия, для сигнала на продажу сигнальный бар закрывается ниже цены открытия, предыдущий бар соответственно противоположного сигнальному типа. В
              LordChannel is an indicator for META TRADER 4 for all forex pairs and financial market metals. The indicator is used to make detections of high/low channels, implementing a technical analysis on possible breakouts and making correct order entries. LordChannel sends signals such as buy and sell in the graphical analysis, it is important to emphasize that the importance of these signals are safe in TIME FRAMES M30, H1, H4. The indicator was created for using bullish/downtrend channels to co
              С этим продуктом покупают
              Gann Made Easy - это профессиональная, но при этом очень простая в применении Форекс система, основанная на лучших принципах торговли по методам господина У.Д. Ганна. Индикатор дает точные BUY/SELL сигналы, включающие в себя уровни Stop Loss и Take Profit. Пожалуйста, напишите мне после покупки! Я поделюсь своими рекомендациями по использованию индикатора. Также вас ждет отличный бонусный индикатор в подарок! Вероятно вы уже не раз слышали о торговли по методам Ганна. Как правило теория Ганна от
              Trend Pulse
              Mohamed Hassan
              5 (3)
              Please contact me after purchase to immediately get your PDF strategy + documentation for Trend Pulse !  Official release price of $99  ( 17 / 50 copies left). Next price is $199 . Introducing Trend Pulse , a unique and robust indicator capable of detecting bullish, bearish, and even ranging trends! Trend Pulse uses a special algorithm to filter out market noise with real precision. If the current symbol is moving sideways, Trend Pulse will send you a ranging signal, letting you know that
              ПОЖАЛУЙСТА, ПРОЧТИТЕ ИНФОРМАЦИЮ НИЖЕ ПЕРЕД ПОКУПКОЙ! Apollo Pips PLUS SP – уникальный продукт! ЭТО ДЛЯ ТЕХ, КТО ХОЧЕТ ПОЛУЧИТЬ МОЙ НОВЫЙ ИНДИКАТОР «APOLLO PIPS» + БОНУС «SUPER PACK» С ДОСТУПОМ КО ВСЕМ МОИМ ТОРГОВЫМ ИНДИКАТОРАМ! Покупая продукт Apollo Pips PLUS SP, вы фактически приобретаете абсолютно новую версию моего индикатора Apollo Pips. Эта версия индикатора имеет улучшенный алгоритм и простой в использовании параметр, который дает вам возможность использовать индикатор на любом рынке и в
              Trend Punch
              Mohamed Hassan
              4.95 (21)
              This indicator is unstoppable when combined with our other indicator called  Support & Resistance . After purchase, send us a message and you will get it   for  FREE as a BONUS! Introducing Trend Punch , the revolutionary forex trend indicator that will transform the way you trade! Trend Punch is uniquely designed to provide precise buy and sell arrows during strong market trends, making your trading decisions clearer and more confident. Whether you're trading major currency pairs or exotic sym
              Инновационный индикатор, использующий эксклюзивный алгоритм для быстрого и точного определения тренда. Индикатор автоматически рассчитывает время открытия и закрытия позиций, а также подробную статистику работы индикатора на заданном отрезке истории, что позволяет выбрать наилучший торговый инструмент для торговли. Вы также можете подключить свои пользовательские стрелочные индикаторы к Scalper Inside Pro для проверки и расчета их статистики и прибыльности. Scalper Inside PRO инструкция и настро
              Currency Strength Wizard — очень мощный индикатор, предоставляющий вам комплексное решение для успешной торговли. Индикатор рассчитывает силу той или иной форекс-пары, используя данные всех валют на нескольких тайм фреймах. Эти данные представлены в виде простых в использовании индексов валют и линий силы валют, которые вы можете использовать, чтобы увидеть силу той или иной валюты. Все, что вам нужно, это прикрепить индикатор к графику, на котором вы хотите торговать, и индикатор покажет вам ре
              Прежде всего стоит подчеркнуть, что этот торговый индикатор не перерисовывается, не перерисовывает и не отставает, что делает его идеальным как для ручной, так и для роботизированной торговли. Руководство пользователя: настройки, вводы и стратегия. Атомный аналитик - это индикатор ценового действия PA, который использует силу и импульс цены, чтобы найти лучший край на рынке. Оборудованный расширенными фильтрами, которые помогают убирать шумы и ложные сигналы, и повышают торговый потенциал. Испо
              Прежде всего стоит подчеркнуть, что этот Торговый Инструмент является Неперерисовывающимся Нерепейнтинговым Индикатором, что делает его идеальным для профессиональной торговли. Онлайн-курс, руководство пользователя и демонстрация. Индикатор Концепций Умного Действия Цены - очень мощный инструмент как для новичков, так и для опытных трейдеров. Он объединяет более 20 полезных индикаторов в одном, комбинируя передовые торговые идеи, такие как анализ Inner Circle Trader и стратегии торговли конц
              Получайте ежедневную информацию о рынке с подробностями и скриншотами через наш утренний брифинг здесь, на mql5 , и в Telegram ! FX Power MT4 NG - это новое поколение нашего популярного измерителя силы валют FX Power. Что же предлагает этот измеритель силы нового поколения? Все, что вы любили в оригинальном FX Power ПЛЮС Анализ силы GOLD/XAU Еще более точные результаты расчетов Индивидуально настраиваемые периоды анализа Настраиваемый предел расчета для еще более высокой производительности Спец
              M1 Arrow
              Oleg Rodin
              4.73 (15)
              Внутридневная стратегия, основанная на двух фундаментальных принципах рынка. В основе алгоритма лежит анализ объемов и ценовых волн с применением дополнительных фильтров. Интеллектуальный алгоритм индикатора дает сигнал только тогда, когда два рыночных фактора объединяются в одно целое. Индикатор рассчитывает волны определенного диапазона, а уже для подтверждения волны индикатор использует анализ по объемам. Данный индикатор - это готовая торговая система. Все что нужно от трейдера - следовать с
              Reversal First Impulse levels (RFI)        INSTRUCTIONS     RUS    -      ENG           Рекомендуем использовать с  индикатором -  TPSpro  TREND PRO -  Version MT5 Важным ключевым элементом в трейдинге являются зоны или уровни, от которых принимаются решения о покупке или продаже торгового инструмента. Несмотря на попытки крупных игроков скрыть свое присутствие на рынке, они неизбежно оставляют следы. Наша задача заключалась в том, чтобы научиться находить эти следы и правильно их интерпретирова
              В НАСТОЯЩЕЕ ВРЕМЯ СКИДКА 26% Лучшее решение для новичка или трейдера-эксперта! Этот индикатор является уникальным, высококачественным и доступным торговым инструментом, поскольку мы включили в него ряд собственных функций и новую формулу. С помощью всего лишь ОДНОГО графика вы можете определить силу валюты для 28 пар Форекс! Представьте, как улучшится ваша торговля, потому что вы сможете точно определить точку запуска нового тренда или возможность скальпирования? Руководство пользователя:
              В настоящее время скидка 20%! Лучшее решение для новичка или трейдера-эксперта! Эта приборная панель работает на 28 валютных парах. Он основан на 2 наших основных индикаторах (Advanced Currency Strength 28 и Advanced Currency Impulse). Он дает отличный обзор всего рынка Forex. Он показывает значения Advanced Currency Strength, скорость движения валюты и сигналы для 28 пар Forex на всех (9) таймфреймах. Представьте, как улучшится ваша торговля, когда вы сможете наблюдать за всем рынком с пом
              Ultimate Sniper Dashboard
              Hispraise Chinedum Abraham
              4.85 (27)
              Скидка $299! Цены могут вырасти в будущем! Читайте описание ниже! Лучшая система ввода для Ultimate Sniper Dashboard: ПРЕДЕЛЬНЫЕ ДИНАМИЧЕСКИЕ УРОВНИ. (Пожалуйста, проверьте мои продукты) Ultimate Sniper Dashboard работает ТОЛЬКО на реальных рынках из-за ограничений мультивалютного тестирования MT4. Представляем вам Ultimate-Sniper Dashboard! Наша самая лучшая панель, которая содержит HA-Sniper, MA-Sniper и множество специальных режимов. Ultimate Sniper Dashboard - это абсолютный зверь!
              Cycle Sniper
              Elmira Memish
              4.44 (39)
              NEW YEAR SALE PRICE FOR LIMITED TIME!!! Please contact us after your purchase and we will send you the complimentary indicators to complete the system Cycle Sniper is not a holy grail but when you use it in a system which is explained in the videos, you will feel the difference. If you are not willing to focus on the charts designed with Cycle Sniper and other free tools we provide, we recommend not buying this indicator. We recommend watching the videos about the indiactor and system before pu
              TPSproTREND PrO
              Roman Podpora
              4.78 (18)
              TPSpro TRENDPRO   —  трендовый индикатор, который автоматически анализирует рынок и предоставляет информацию о тренде и каждой его смене а также дающий сигналы для входа в сделки без перерисовки! Индикатор использует каждую свечу, анализируя их отдельно. относя к разным импульсам – импульс вверх или вниз. Точные точки входа в сделки  для  валют, крипты, металлов, акций, индексов! -  Version MT5             ПОЛНОЕ ОПИСАНИЕ ИНДИКАТОРА           Рекомендуем использовать с  индикатором -  RFI LEVE
              Представляем       Индикатор Quantum Trend Sniper   , инновационный индикатор MQL5, который меняет способ определения разворотов тренда и торговли ими! Разработан командой опытных трейдеров со стажем торговли более 13 лет,       Снайперский индикатор Quantum Trend       разработан, чтобы вывести ваше торговое путешествие на новые высоты благодаря инновационному способу определения разворотов тренда с чрезвычайно высокой точностью. ***Купите индикатор Quantum Trend Sniper и получите индикатор
              TakePropips Donchian Trend Pro
              Eric John Pajarillaga Aldana
              4.61 (18)
              TakePropips Donchian Trend Pro   (MT4) — это мощный и эффективный инструмент, который автоматически определяет направление тренда с помощью канала Дончиана и предоставляет вам торговые сигналы для входа и выхода! Этот многофункциональный индикатор включает в себя сканер тренда, торговые сигналы, статистическую панель, скринер, торговые сессии и панель истории предупреждений. Он разработан, чтобы предоставить вам торговые сигналы и сэкономить время на анализе графиков! Вы можете скачать руководст
              BullsEye Signal NoRepaint
              Martin Alejandro Bamonte
              3 (2)
              BullseyeSignal – NoRepaint это сигнал, который, как следует из названия, никогда не перерисовывается ни при каких обстоятельствах. Сигнал подается на той же свече, которую можно увидеть на изображении. Он идеален для высоковолатильных рынков, таких как форекс, криптовалюты, акции, индексы и фьючерсы. Вы увидите только зеленую стрелку для покупки и красную стрелку для продажи, но за ними стоят многие индикаторы, работающие вместе, чтобы обеспечить более упрощенный торговый опыт. Он специально раз
              Сейчас 147 долл. США (увеличиваясь до 499 долл. США после нескольких обновлений) - неограниченные учетные записи (ПК или Mac Руководство пользователя + Обучающие видео + Доступ к приватному Discord-каналу + VIP-статус и мобильная версия + Лицензия на 5 ПК с неограниченным количеством аккаунтов и терминалов MT4. Сколько раз вы покупали индикатор торговли с замечательными обратными тестами, доказательствами производительности на живых счетах и зашикарными цифрами и статистикой, но после испол
              Step into the realm of Forex trading with confidence and precision using XQ, a cutting-edge Forex indicator designed to elevate your trading game to unprecedented heights. Whether you're a seasoned trader or just stepping into the world of currency exchange,   XQ Forex Indicator   empowers you with the insights and signals needed to make informed trading decisions. The signal conditions are a combination of three indicators, and XQ Forex Indicator only display  medium and long-term trends . The
              Откройте для себя секрет успешной торговли форекс с нашим пользовательским индикатором MT4! Задумывались ли вы, как добиться успеха на рынке Forex, постоянно зарабатывая прибыль при минимизации риска? Вот ответ, который вы искали! Позвольте нам представить наш собственный индикатор MT4, который будет революционизировать ваш подход к торговле. Уникальная универсальность Наш индикатор специально разработан для пользователей, которые предпочитают формирования свечей Renko и Rangebar. Мы пони
              Scalper Vault — это профессиональная торговая система, которая дает вам все необходимое для успешного скальпинга. Этот индикатор представляет собой полную торговую систему, которую могут использовать трейдеры форекс и бинарных опционов. Рекомендуемый тайм фрейм М5. Система дает точные стрелочные сигналы в направлении тренда. Она также предоставляет вам сигналы выхода и рассчитывает рыночные уровни Ганна. Индикатор дает все типы оповещений, включая PUSH-уведомления. Пожалуйста, напишите мне после
              СЕЙЧАС СКИДКА 31% !!! Лучшее решение для новичка или трейдера-эксперта! Этот индикатор является уникальным, высококачественным и доступным торговым инструментом, поскольку мы включили в него ряд собственных функций и секретную формулу. Всего на ОДНОМ графике он выдает алерты по всем 28 валютным парам. Представьте, как улучшится ваша торговля, ведь вы сможете точно определить точку запуска нового тренда или возможность скальпирования! Построенный на новых базовых алгоритмах, он позволяет е
              " All in One Chart Patterns"  Текущая цена будет действовать только первые 3 дня, окончательная цена составит 150$. Графические паттерны вызывают споры среди трейдеров; некоторые считают их надежными сигналами, а другие - нет. Наш индикатор "Chart Patterns All-in-One" отображает различные графические паттерны, позволяя вам самостоятельно тестировать эти теории. Прибыльность этих паттернов не отражает эффективность индикатора, а является оценкой самих паттернов. Индикатор "Chart Patterns All-in-O
              The AT Forex Indicator MT4 is a sophisticated trading tool designed to provide traders with a comprehensive analysis of multiple currency pairs. This   powerful indicator   simplifies the complex nature of the forex market, making it accessible for both novice and experienced traders. AT Forex Indicator uses   advanced algorithms   to detect trends, patterns and is an essential tool for traders aiming to enhance their forex trading performance. With its robust features, ease of use, and reliabl
              Dear Traders this is my another tool called " Swing Master Indicator ". As the name above the indicator is designed to help you in swing trading by capturing the low and highs of the price. You may us this tool with any trading strategy and style from scalping to position trading. It is made for level of traders including newbies and advanced traders even prop-firms, hedge funds and banks to help them make sold market analysis. I create tools for serious traders who want to make a difference in
              Black dragon indicator
              Ramil Minniakhmetov
              4.87 (134)
              Индикатор определения тренда, дополнит любую стратегию, а также может использоваться как самостоятельный инструмент.  ВАЖНО! Свяжитесь со мной сразу после покупки, чтобы получить инструкции и бонус! Рекомендации по работе с индикатором, Вы можете скачать в комментарии #5 Преимущества Прост в использовании, не перегружает график не нужной информацией; Возможность использования  как фильтр для любой стратегии; Имеет встроенные уровни динамических поддержек и сопротивлений, что может использоваться
              Advanced Supply Demand
              Bernhard Schweigert
              4.9 (314)
              Этот индикатор является уникальным, качественным и доступным инструментом для торговли, включающим в себя наши собственные разработки и новую формулу. В обновленной версии появилась возможность отображать зоны двух таймфреймов. Это означает, что вам будут доступны зоны не только на старшем ТФ, а сразу с двух таймфреймов - таймфрейма графика и старшего: отображение вложенных зон. Обновление обязательно понравится всем трейдерам, торгующим по зонам спроса и предложения. Важная информация Для мак
              FX Volume
              Daniel Stein
              4.61 (36)
              Получайте ежедневную информацию о рынке с подробностями и скриншотами в нашем утреннем брифинге здесь, на mql5 , и в Telegram ! FX Volume - это ПЕРВЫЙ и ЕДИНСТВЕННЫЙ индикатор объема, который дает РЕАЛЬНОЕ представление о настроении рынка с точки зрения брокера. Он дает потрясающее представление о том, как институциональные участники рынка, такие как брокеры, позиционируют себя на рынке Forex, гораздо быстрее, чем отчеты COT. Видеть эту информацию прямо на своем графике - это настоящий геймчей
              Другие продукты этого автора
              Read detailed description and Get Free Demo and extra indicators: https://www.mql5.com/en/blogs/post/758610 Features: Halftrend Arrow Scan: Scan Max Past Bars for Halftrend arrows. Show how many bars back the arrow occurred in a bracket Past Bars Back Alerts: Num of bars back for which scanner will send alerts Halftrend HTF Align: Scan Higher timeframes for Trend Direction of Halftrend Indicator and if trends align show a slanting Green/Red Arrow for Up/Down trend Semafor 3 Check: Few bars
              Dashboard uses Ichimoku Strategy to find best trades. Get extra Indicators/Template: And read more about detailed Product Description and usage here: https://www.mql5.com/en/blogs/post/747457 Please note: I won’t be able to add new settings. It already has 72 settings  :) Some people are using it with their EAs. And iCustom function can only take Max 64 settings. So, I cannot let it grow any further. I’ll definitely be maintaining the code and solving issues. Don’t worry. Please check all
              How To Use Check out this post for detailed description on  All Indicator extras and template: https://www.mql5.com/en/blogs/post/758259 The Best Heiken Ashi System is a simple trading system for trading based only two indicators for generate signals: Heiken ashi smoothed and Vqzz indicator multi-timeframe. The system was created for scalping and day trading but can also be configured for higher time frames. As mentioned, the trading system is simple, you get into position when the two ind
              FREE
              This is a Sharkfin Arrows Indicator. Get TDI extra indicators here: https://www.mql5.com/en/blogs/post/758252 This indicator will show only Arrows. It does not have TDI symbols on chart. Please get the extras from links above for TDI indicators. TDI Scanner Dash (paid): https://www.mql5.com/en/market/product/41826 About: This Indicator finds the Shark Fin Pattern. It will show an arrow in the current bar if RSI sharkfin is finished forming in previous bar. What is Shark Fin TDI Patt
              FREE
              About: A Fibonacci indicator is best used with other indicators like Pivots, Support/Resistance etc. Price tends to use Fibo levels as Support or Resistance lines. So, this indicator is very useful to know when price might reverse or if a level is crossed, price might continue the trend. Also, to find the best Take Profit and StopLoss lines. Don't use Fibo Indicator alone for trading as it might not always be accurate. Use it to make your strategies better as a supporting indicator. Settings:
              FREE
              This indicator is based on Guppy's GMMA Strategy. And shows arrows when GMMA lines cross up or down. To have this indicator and get alerts for Multiple Timeframes and multiple Pairs you can check out the demo of this GMMA Trend Scanner indicator: https://www.mql5.com/en/market/product/38747 About GMMA In Brief: GMMA attempts to identify trends by combining two groups of moving averages with differing time periods: The long-term EMAs (30, 35, 40, 45, 50, and 60) the behaviors of investors that
              FREE
              Features: Get OB/OS Levels from Golden MA Levels Wait for Buy/Sell Start Level Cross Optional: Should price cross Mid Level in earlier bars Optional: Crossing bar High/Medium Volume Optional: MA Stacked to check up/down trend for current TF Optional: NRTR higher timeframes aligned Check Detailed blog post explained: https://www.mql5.com/en/blogs/post/758457 Levels with Buffers available here: Golden MA Levels Indicator: https://www.mql5.com/en/market/product/119515 Note: Arrows/Scanner do
              FREE
              Scanner Dashboard for Best Heiken Ashi VQZZ Arrows Indicator here: https://www.mql5.com/en/market/product/45900 Check out this post for detailed description on How To Use All Indicator extras and template: https://www.mql5.com/en/blogs/post/758259 Please note that if you are using too many pairs/timeframes, then VQZZ calculations might slow down the dashboard. So be careful not to use too many VQZZ Higher timeframes if you are using too many pairs. Also, VQZZ is based on higher timeframes. e
              How the Indicator Works: This is a Multi-timeframe MA multimeter indicator which studies if price is above or below a particular EMA range and shows Red/Green/Yellow signals. Red: Price Below EMA range Green: Price above range Yellow: Price within range Indicator Properties: EMA Settings: - Default Period is 200. You can change all MA Settings like Period, MA Method (SMA, EMA, etc) or MA Applied Price (Close, Open, etc). - EMA Range list is a comma separated value list for different timefr
              FREE
              3 Level ZZ Semafor Scanner: This is a Dashboard indicator which uses 3LZZ Indicator in the background to find semafors. It will give priority to the semafors3 because they specify a strong signal. So, even if there is a sem1 or 2 on current bar, and if Sem3 was within "Check Previous Bars for Sem 3". Then it will show Sem3 instead. Read about this in detailed post: https://www.mql5.com/en/blogs/post/758250 And get all extra Indicators/Template from above link. Please note: Number of setti
              TDI Multi Timeframe Scanner: This Dashboard indicator uses the TDI (Trader's Dynamic Index) Indicator to find best trades. Read detailed How to Use Guide: https://www.mql5.com/en/blogs/post/758252 Extra indicators also available in above post. Checks for: - SharkFin Pattern Free indicator for SharkFin: https://www.mql5.com/en/market/product/42405/ - TDI Trend: Strong/Weak Trend Up/Down - TDI Signal: Strong/Medium/Weak Signal for Buy/Sell - Consolidation - Overbought/Oversold - Volatilit
              This strategy is best used for Trend based trading. While market is trending, price still makes smaller ranges. Darvas boxes show breakouts from these small ranges, while still following the original market trend. Detailed Description: https://www.mql5.com/en/blogs/post/747919 Features: Darvas - Check Darvas Box Breakout -   Check Price Above/Below MA or Darvas Box has crossed MA -   Min, Max Box Height -   Max Distance Between Entry Price and Darvas Box Other Indicators: - NRTR Tren
              Abiroid Multi Slope indicator allows you to calculate a Slope Histogram for any line of any indicator . Histogram is for 1 slope line only, but slope values can be calculated for 3 lines total. To have multiple histograms, add as many Slope indicators for custom indicators as you like on chart. You just need to provide the Indicator name, buffer value, slope's period and max number of bars back. By default it has slope calculation for TDI_v4.ex4 indicator. There is no way to specify parameters f
              FREE
              Features: - Moving Average Slope for Max Past Bars - Slope Period - Slope Thresholds - Multiple Slope Type options - See slope visually as a histogram - Info Panel Show/Hide Slope Calculations and Types: The slope value is calculated using the Slope Period. Suppose Period is 5, it will check the MA value for bar (x) and bar (x+5). And find the slope angle between them. Read detailed description about Slope Types and Settings here: https://www.mql5.com/en/blogs/post/747651
              FREE
              Moving Average Rainbow Stack: Free: Single Currency & Single Timeframe MA Stack Very useful for finding current and higher timeframe trends. Best suited for long term trend based trading. Use fewer MAs for quick scalping. And not suitable during low volatility. Only use during high volatility and steady trending markets. Use this to enhance your existing Trend based strategies to find best trends. Read detailed description https://abiroid.com/product/abiroid-ma-stack Available MTF and Scanner
              FREE
              Description This scanner uses 3LZZ TRO ex4 and scans for Semafors at given “Shift” bar. Scanner Detailed Settings: https://www.mql5.com/en/blogs/post/747456 Other Settings: Set Periods for Semafor 1,2,3 Set alerts on/off for Semafor 1,2,3 Shift bar (Bar on which semafor is scanned) Refresh After Ticks (Number of ticks when dash is refreshed) This scanner is pretty simplistic version. And a more detailed version with a different strategy is available here: https://www.mql5.com/en/market/produ
              FREE
              Features: - Current TF GMMA Cross and Trend (Mandatory Check.. G-Up/G-Down) - HTF GMMA Trend Check (Optional.. slanting arrow) - TDI or NRTR Trend Check (Optional.. diamond) Read post for detailed description and downloading extra indicators: https://www.mql5.com/en/blogs/post/758264 Scanner: This is a Dashboard Scanner for finding good trades using the GMMA method as base and TDI method for trend verification. All buttons for all Pairs and Timeframes are clickable and will change the ch
              Extreme TMA System with Arrows Indicator And Buy/Sell Boxes with Take Profit & Stop Loss This is a Non-Repainting Arrows Indicator based on the Extreme TMA System. It shows TMA cross signals and the best BUY/SELL signals. Along with the most predicted TakeProfit. And StopLoss based on TakeProfit ratio. Please note: This is an Arrows only Indicator. Dashboard is sold separately here: https://www.mql5.com/en/market/product/44825 About Indicator: This indicator shows BUY/SELL Signal Arrows a
              This Scanner Dashboard uses the Extreme TMA System Arrows Indicator to show good BUY/SELL signals. This Product contains dashboard only. It does not contain the Abiroid_Arrow_Extreme_TMA.ex4 indicator. Arrows indicator is not necessary for dashboard to work.  To see arrows, you can buy the arrows indicator separately if you like: https://www.mql5.com/en/market/product/44822 Dash shows Slopes for current and Higher Timeframes. - 1st diamond is current TF. Next diamonds are higher TFs (Please N
              Abiroid Profit Percent Series 1: Arrows Indicator Stochastic Ichimoku with ATR Get the Scanner for free. For getting Profit Percentages for Multiple Timeframes and Multiple Pairs. And read detailed description about this indicator and all the settings here. And get extra Indicators, Templates and settings for download: https://abiroid.com/product/profit-percent-stoch-ichimoku-with-atr Watch the tutorial video here: https://youtu.be/C45-9kWPE2Q About The Strategy: This strategy has 3 main
              Profit Percent Series 2 The scanner dashboard available here (for  Free) : https://abiroid.com/product/profitpercent-arrows-ma-confluence Read detailed information about MA Confluence here: https://www.mql5.com/en/blogs/post/747474 Here's a post about Common Settings for all Profit Percent Series Indicators: https://www.mql5.com/en/blogs/post/747456 Strategy: Main Signal Indicators (Any One): MA Cross (In-built) or Hull, OBV Cross, Heiken Ashi Cross Validation Indicators (Preferably l
              This Indicator uses Center of Gravity (COG) Indicator to find you the best trades. It is a reversal based Swing Indicator which contains an  Arrows Indicator. That you can buy here from Metatrader Market. Check out this blog post for detailed How to Use Guide and links to free scanner: https://www.mql5.com/en/blogs/post/758262 Scanner needs this arrows indicator in same directory to run Copy scanner ex4 in same folder as your Arrows Indicator: MQL4/Indicators/Market/ All extra indicators
              Free scanner available here: https://abiroid.com/product/abiroid-ema-scalper Basic Strategy: 1: MA Crossover Up/Down Arrow (Mandatory Check) Optional Checks: 2: If NRTR Check On (Optional): For BUY: Check if NRTR blue and For SELL: NRTR Red If NRTR Shadow Distance On (Optional): Check price for 'x' bars back: at Shadow distance (ATR Multiplier distance) from NRTR line. 3: If High Volume bar On: Check if High Volume or if Medium (if on) Volume bar 'x' bars back 4: If HTF Trend Align On (Option
              This is a Multi-currency multi-timeframe Support/Resistance Scanner Dashboard for Metatrader 4 (MT4) platform. Get all extras and download free demo here: https://abiroid.com/product/abiroid-support-resistance-scanner Read detailed description in post above. Features: Scan Support/Resistance zones (also called Supply/Demand zones) Show alert when price is inside these zones and highlights the pair/timeframe Show or hide SR zones price nearest to current price (Price_Close) Show or hide cur
              This strategy is useful for small timeframe scalping and binary options. Best timeframes: M5,M15,M30 M1 timeframe is too unpredictable. So be careful with that. Read Detailed Description and Get All: - Free Demo - Free Scanner - Extra Indicators ex4 files from https://abiroid.com/product/abiroid-donchian-scanner-and-arrows Arrows Demo only works in strategy tester. So, Arrows Demo won't work with the free scanner. Scanner needs "Abiroid Donchian Arrow.ex4" to work. So make sure both arrows a
              Read detailed description and extra indicators: https://www.mql5.com/en/blogs/post/758622 This Supertrend dashboard is a multi-currency and multi-timeframe dash which gives signals whenever supertrend changes it's trend direction. Please note, that this is not a full trading system. It will help you get initial Supertrend signals and higher timeframe trend alignments. And it’s to be used with your own Supertrend Strategies. Features: Select one of In-Built Supertrend Indicators: xSupertrend
              Get Free Scanner and example Strategies And understand detailed description here: https://abiroid.com/product/abiroid-customizer-arrows-and-scanner And get example wrapper here: https://abiroid.com/indicators/customizer-sample-wrappers You can make your own wrappers if your indicators have complex conditions or for In-Built MT4 indicators. Features: - Specify your own Custom Indicator - Specify Buffer values and create Variables - Use those Variables to create your own Buy/Sell Conditions
              This is a multi-timeframe multi-currency Fibo (Fibonacci levels) and Pivots scanner which also shows Missed Pivot count and Fibo Golden Ratio Zones. Select separate Pivot Timeframes for each Dashboard Timeframe Check when price is near a Pivot point Check for Price Crossing Pivot Point Use Mid Pivots (Optional) Show Missed Pivots (Optional) Show High Volume Bar Use Fibo (Optional) Use Fibo Golden Ratio (Optional) Set your preferred Timeframe for Fibo or Pivots Check out   Common Scanner Settin
              This strategy is best used for Scalping and Binary Options. Strategy: There are 3 EMAs: Faster, Medium and Slower. When Price is Trending, wait for Price to bounce an EMA and scalp at each bounce. Features: - Check if 3 MAs are Stacked - Check Price Bounce Off MAs (Faster, Medium, Slower) - Min Distance Between Faster and Medium MA Filter - Max Distance Between Entry Price and Faster MA Filter - High Volume Check - Heiken Trend Check - Volatility Check - Higher/Lower Timeframes MA Stacked check
              Bollinger Bands Breakout Strategy has an Arrows and Scanner Dashboard indicator set. It is for MT4 (Metatrader 4) platform. When price breaks out of a Bollinger Outer Band in a powerful way, it becomes a great position for scalping. Because the next few bars will most likely keep going in the same direction. Especially if Middle band is also sloping towards that breakout. It's also great for Binary options when using 2-3 next few bars. Strategy: BUY  Bollinger Bands: - Price breaks out of
              Фильтр:
              Нет отзывов
              Ответ на отзыв