• Обзор
  • Отзывы
  • Обсуждение

Bollinger Bands Dashboard

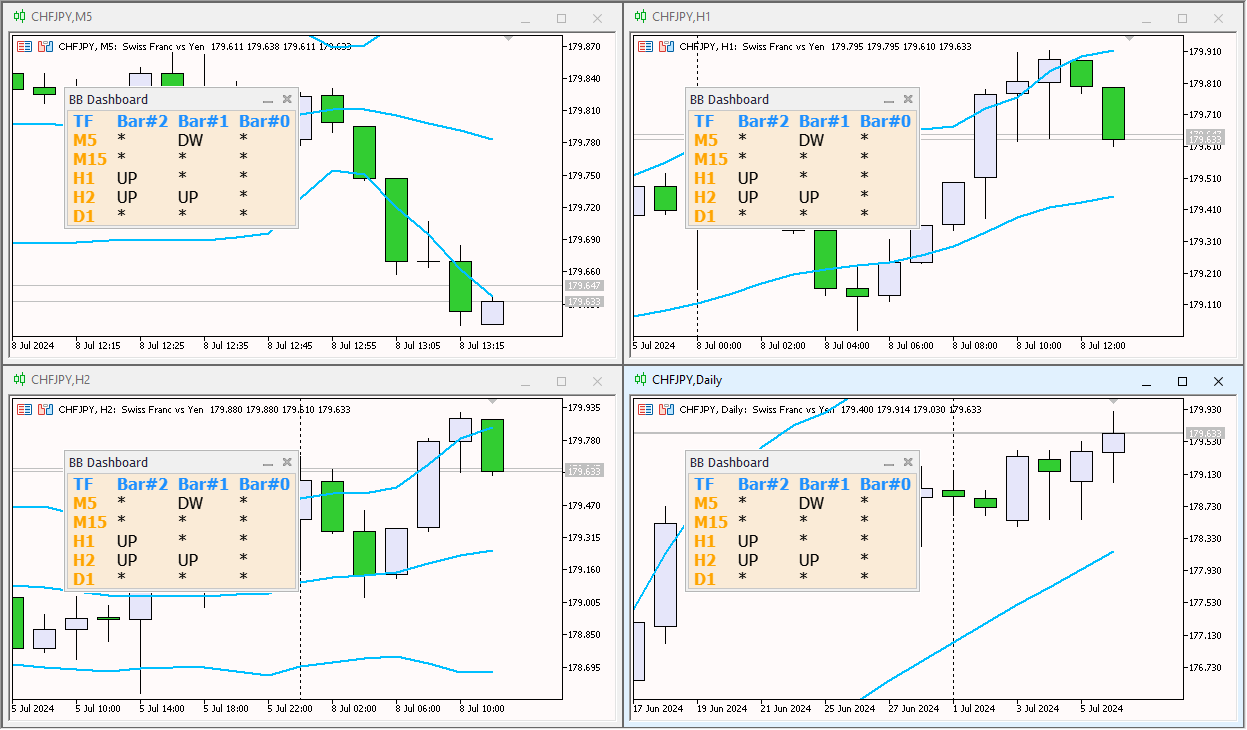
The Bollinger Bands Dashboard indicator offers a convenient and informative way to track Bollinger Bands indicator signals on different timeframes using one panel (Dashboard). This tool allows traders to quickly and easily obtain the information they need, enabling efficient decision-making in the market.

Main characteristics:

1. **Signals Panel**: The Dashboard displays Bollinger Bands signals for selected timeframes, providing users with clear and structured information.

2. **Flexibility in timeframe settings**: Ability to enable or disable any timeframe according to the user's needs. This allows you to focus on the most important time intervals of a specific trading strategy. If all time frames are turned off, the indicator will display three hard-coded time frames, which is done to ensure continuous signal transmission.

3. **Color Settings**: The tool offers advanced color settings for different panel elements:
- Dashboard background
- table header background

- background of the first column in which timeframes are placed

4. **Signal generation**:

- The "UP" signal is formed when the candle crosses the "Upper" line of the Bollinger Bands indicator from bottom to top.
- The DW signal is formed when the candle crosses the Lower line of the Bollinger Bands indicator from top to bottom.

This indicator will become an indispensable assistant for traders who want to receive instant and accurate Bollinger Bands signals from different timeframes, ensuring comfortable work thanks to flexible settings and a clear interface.


Рекомендуем также
Crash 1000 Scalping Indicator for the Crash 1000 Deriv Synthetic Index. Introduction The Crash 1000 Scalping Indicator is a specialized tool designed for the Crash 1000 index on the Deriv Synthetic market. This indicator is particularly useful for scalping on the M1 timeframe, helping traders to identify precise entry and exit points for buy positions. It is designed to be non-repainting, providing clear signals with audible alerts and push notifications, and is compatible with mobile devices th
Профиль Рынка (Market Profile) определяет ряд типов дней, которые помогают трейдеру распознать поведение рынка. Ключевая особенность - это область значений (Value Area), представляющая диапазон ценового действия, в котором произошло 70% торговли. Понимание области значений может помочь трейдерам вникнуть в направление рынка и установить торговлю с более высокими шансами на успех. Это отличное дополнение к любой системе, которую вы возможно используете. Blahtech Limited представляет сообществу Me
Noize Absorption Index - is the manual trading system that measures the difference of pressure between bears forces and bulls forces. Green line - is a noize free index that showing curent situation. Zero value of index shows totally choppy/flat market.Values above zero level shows how powerfull bullish wave is and values below zero measures bearish forces.Up arrow appears on bearish market when it's ready to reverse, dn arrow appears on weak bullish market, as a result of reverse expectation.
To get access to MT4 version please click here . - This is the exact conversion from TradingView: "Stochastic Momentum Index" By "UCSgears". - This is a popular version of stochastic oscillator on tradingview. - This is a light-load processing and non-repaint indicator. - Buffers are available for the lines on chart. - You can message in private chat for further changes you need. Thanks for downloading
Прежде всего стоит подчеркнуть, что этот Торговый Инструмент является Неперерисовывающимся Нерепейнтинговым Индикатором, что делает его идеальным для профессиональной торговли. Онлайн-курс, руководство пользователя и демонстрация. Индикатор Концепций Умного Действия Цены - очень мощный инструмент как для новичков, так и для опытных трейдеров. Он объединяет более 20 полезных индикаторов в одном, комбинируя передовые торговые идеи, такие как анализ Inner Circle Trader и стратегии торговли конц
Premium level - это уникальный индикатор с точностью правильных прогнозов  более 80%!  Данный индикатор тестировался более двух месяцев лучшими Специалистами в области Трейдинга!  Индикатор авторский такого вы больше не где не найдете!  По скриншотах можете сами увидеть точностью данного инструмента!  1 отлично подходит для торговли бинарными опционами со временем экспирации на 1 свечу. 2 работает на всех валютных парах, акциях, сырье, криптовалютах Инструкция: Как только появляется красная стре
To download MT4 version please click here . This is the exact conversion from TradingView: "B-Xtrender" By "QuantTherapy". - It is an oscillator based on RSI and multiple layers of moving averages. -   It is a two in one indicator to calculate overbought and oversold zones for different RSI settings. -  This indicator lets you read the buffers for all data on the window. - This is a non-repaint and light processing load indicator. - You can message in private chat for further changes you need.
Этот индикатор покажет вам значения TP и SL (в этой валюте), которые вы уже установили для каждого ордера на графиках (закрытые от линии транзакции/ордера), что очень поможет вам оценить вашу прибыль и убыток для каждого ордера. И он также показывает вам значения PIP. Показанный формат - «Валютные значения нашей прибыли или убытка / значений PIP». Значение TP будет отображаться зеленым цветом, а значение SL — красным. По любым вопросам или для получения дополнительной информации, пожалуйста,
Одна из числовых последовательностей носит название - "Последовательность лесного пожара". Она была признана одной из самых красивых новых последовательностей. Её главная особенность заключается в том, что эта последовательность избегает линейных трендов, даже самых кратковременных. Именно это свойство легло в основу этого индикатора. При анализе финансового временного ряда этот индикатор старается отбросить все возможные варианты тренда. И только если это ему не удается, то он признает наличие
Magic Finger can help you identify trends and trading opportunities clearly. The finger points to the open position signal, and the discoloration line is confirmed by the trend. If you are a day trader, you can choose to trade during a period of active trading, referring to the discoloration line as the basis for the next order, finger signal as a filter. If you are a trend trader, you can choose a period above H1, wait for the appearance of the finger signal in the key price area, and enter t
Provided Trend – это сложный индикатор формирования сигналов. В результате работы внутренних алгоритмов вы можете видеть на вашем чарте только три вида сигналов. Первый это сигнал на покупку, второй это сигнал на продажу и третий сигнал на выход с рынка. Параметры: CalcFlatSlow – Первый параметр управляющий главной функцией разбивки ценогого графика на волны. CalcFlatFast – Второй параметр управляющий главной функцией разбивки ценогого графика на волны. CalcFlatAvg - Параметр управляющий гран
The Penta-O is a 6-point retracement harmonacci pattern which usually precedes big market movements. Penta-O patterns can expand and repaint quite a bit. To make things easier this indicator implements a twist: it waits for a donchian breakout in the right direction before signaling the trade. The end result is an otherwise repainting indicator with a very reliable trading signal. The donchian breakout period is entered as an input. [ Installation Guide | Update Guide | Troubleshooting | FAQ | A
Усовершенствованная версия бесплатного индикатора HMA Trend (для MetaTrader 4), с возможностью статистического анализа HMA Trend - трендовый индикатор, базирующийся на скользящей средней Хала (Hull Moving Average - HMA) с двумя периодами. HMA с медленным периодом определяет тренд, HMA с быстрым периодом - краткосрочные движения и сигналы в сторону тренда Главные отличия от бесплатного варианта: Возможность предсказать вероятность разворота тренда с помощью анализа исторических данных Построени
To get access to MT4 version please click here . This is the exact conversion from TradingView: "[SHK] Schaff Trend Cycle (STC)" by "shayankm". This is a light-load processing indicator. This is a non-repaint indicator. Buffers are available for processing in EAs. All input fields are available. You can message in private chat for further changes you need. Thanks for downloading
Повысьте свой опыт торговли с Wamek Trend Consult! Разблокируйте силу точного входа на рынок с нашим передовым торговым инструментом, разработанным для выявления ранних и продолжающихся трендов. Wamek Trend Consult дает трейдерам возможность войти на рынок в идеальный момент, используя мощные фильтры, которые уменьшают ложные сигналы, повышают точность сделок и, в конечном итоге, увеличивают прибыльность. Основные характеристики: 1. Точная идентификация тренда: Индикатор Trend Consult испол
Volality Index scalper indicator  Meant for Volality pairs such as Volality 10, 25, 50, 75 and 100 The indicator works on all timeframes from the 1 minute to the monthly timeframe the indicator is non repaint the indicator has 3 entry settings 1 color change on zero cross 2 color change on slope change 3 color change on signal line cross Orange line is your sell signal Blue line is your buy signal.
Способ применения Pair Trading Station Рекомендуется использовать Pair Trading Station на таймфрейме H1 с любой валютной парой. Чтобы получить сигналы на покупку и продажу, следуйте указанным ниже инструкциям по применению Pair Trading Station в терминале MetaTrader. При загрузке Pair Trading Station на график индикатор оценит доступные исторические данные на вашей платформе MetaTrader для каждой валютной пары. В самой начале на графике отобразятся исторические данные, доступные для каждой валют
PULLBACK HUNTER Какая заветная мечта любого трейдера? Без задержки видеть места, где произойдет разворот. Это, конечно, из разряда волшебства, хотя... на свете нет ничего невозможного. Но пока я подготовил для вас индикатор, который в реальном времени отмечает моменты завершения коррекций к текущему движению или если кратко - ловит откаты. В чем основной смысл? Многие практикуют доборы при движении цены в сторону открытой позиции. И делают их на образовании новых экстремумов. Всё хорошо, но в да
The new update makes this indicator a complete tool for studying, analyzing and operating probabilistic patterns. It includes: On-chart Multi-asset percentage monitor. Configurable martingales. Twenty-one pre-configured patterns, including Mhi patterns and C3. An advanced pattern editor to store up to 5 custom patterns. Backtest mode to test results with loss reports. Trend filter. Hit operational filter. Martingale Cycles option. Various types of strategies and alerts. Confluence between patter
Мультивалютный и мультитаймфреймовый индикатор Stochastic Oscillator. В параметрах вы можете указать любые желаемые валюты и таймфреймы. Индикатор отображает текущие значения и пересечения линий — Сигнальной и Основной. Также индикатор может отправлять уведомления при пересечении уровней перекупленности и перепроданности. По клику на ячейке с периодом будет открыт указанный символ и период. Параметры %K Period — период линии K; %D Period — период линии D; Slowing — замедление; Method — метод ус
Это инновационный индикатор измерения силы валют от INFINITY является незаменимым помощником для скальперов и трейдеров торгующих в долгую. Система анализа Силы/слабости валют давно известна и применяется на рынке ведущими трейдерами мира. Любая арбитражная торговля не обходится без этого анализа. Наш индикатор легко определяет силу базовых валют по отношению друг к другу. Он выводит линейные графики по всем или по текущей паре валют, позволяя проводить мгновенный анализ и поиск наиболее силь
ПРОгрессивный индикатор нового поколения от INFINITY. Predictor PRO использует собственную стратегию расчета входа и выхода. Индикатор без перерисовки сигналов! Это очень важно для реальной торговли. Индикатор можно использовать для любых валютных пар, металлов, криптовалют или индексов. Лучшее время графика Н1. В отличии от других индикаторов    Predictor PRO показывает точку входа Buy/Sell и точку выхода Close. Расчет профита всех сигналов в пунктах на панели  помогает подобрать оптимальные на
Индикатор тренда Riko Trend - революционное решение для торговли по трендам и фильтрации со всеми важными функциями инструмента тренда, встроенными в один инструмент! Индикатор Riko Trend хорош для любого трейдера, подойдет любому трейдеру как для форекс так и для бинарных опционов. Ничего настраивать не нужно все отточено времинем и опытом, отлично работает на во время флета та и в тренде. Индикатор тренда Riko Trend это инструмент технического анализа финансовых рынков, отражающий текущие о
Your Trend Friend
Luigi Nunes Labigalini
5 (1)
The trend is your friend! Look at the color of the indicator and trade on that direction. It does not  repaint. After each candle is closed, that's the color of the trend. You can focus on shorter faster trends or major trends, just test what's most suitable for the symbol and timeframe you trade. Simply change the "Length" parameter and the indicator will automatically adapt. You can also change the color, thickness and style of the lines. Download and give it a try! There are big movements
Stratos Pali Indicator is a revolutionary tool designed to enhance your trading strategy by accurately identifying market trends. This sophisticated indicator uses a unique algorithm to generate a complete histogram, which records when the trend is Long or Short. When a trend reversal occurs, an arrow appears, indicating the new direction of the trend. Important Information Revealed Leave a review and contact me via mql5 message to receive My Top 5 set files for Stratos Pali at no cost ! Do
Indicator and Expert Adviser  EA Available in the comments section of this product. Download with Indicator must have indicator installed for EA to work. Mt5 indicator alerts for bollinger band and envelope extremes occurring at the same time. Buy signal alerts occur when A bullish candle has formed below both the lower bollinger band and the lower envelope  Bar must open and close below both these indicators. Sell signal occur when A bear bar is formed above the upper bollinger band and upp
To download MT4 version please click here . This is the exact conversion from TradingView: "WaveTrend [LazyBear]" By "zeusuk3". One of the coolest indicators out there to detect overbought and oversold zones. It can be used as a part of more complicated strategy and for confirming a potential trade setup. There are buffers to use in EAs also. The indicator is loaded light and non-repaint. - You can message in private chat for further changes you need. Thanks for downloading 
Этот продукт позволит Вам выгодно приобреcти и использовать два самых популярных продукта для анализа объемов заявок и сделок на биржевых рынках: Actual Depth of Market Chart Actual Tick Footprint Volume Chart Данный продукт вобрал в себя всю мощь каждого отдельного индикатора и оформлен в виде одного файла. Функционал продукта Actual COMBO Depth of Market AND Tick Volume Chart полностью идентичен оригинальным индикаторам. Вы оцените удобство объединения этих двух продуктов в один супер-индикато
ATrend
Zaha Feiz
4.83 (6)
ATREND: Как это работает и как его использовать Как это работает Индикатор "ATREND" для платформы MT5 разработан для предоставления трейдерам надежных сигналов на покупку и продажу с использованием комбинации методов технического анализа. Этот индикатор в первую очередь использует среднюю истинную амплитуду (ATR) для измерения волатильности, наряду с алгоритмами обнаружения тренда для выявления потенциальных движений рынка. Оставьте сообщение после покупки и получите специальный бонусный подаро
Delta Aggression Volume PRO is an indicator developed to monitor the strength and continuity of the aggression volume of sell and buy negotiations. Note: This indicator DOES NOT WORK for Brokers and/or Markets WITHOUT the type of aggression (BUY or SELL). Cryptocurrencies and Forex do not provide this type of data, that is, it does not work with them. O Delta Agrression Volume PRO has features that allow you to view beyond the delta volume of the day. Operation Multi symbols  (those who pro
С этим продуктом покупают
Важным ключевым элементом в трейдинге являются зоны или уровни, от которых принимаются решения о покупке или продаже торгового инструмента. Несмотря на попытки крупных игроков скрыть свое присутствие на рынке, они неизбежно оставляют следы. Наша задача заключалась в том, чтобы научиться находить эти следы и правильно их интерпретировать. INSTRUCTIONS     RUS   -    ENG                    Рекомендуем использовать с индикатором -   TPSpro  TREND PRO -  Version MT4 Основные функции: Отображения а
TPSpro TREND PRO   —  трендовый индикатор, который автоматически анализирует рынок и предоставляет информацию о тренде и каждой его смене а также дающий сигналы для входа в сделки без перерисовки! Индикатор использует каждую свечу, анализируя их отдельно. относя к разным импульсам – импульс вверх или вниз. Точные точки входа в сделки  для  валют, крипты, металлов, акций, индексов! Version MT4                ПОЛНОЕ ОПИСАНИЕ ИНДИКАТОРА          Рекомендуем использовать с  индикатором -  RFI LEVE
Atbot
Zaha Feiz
4.92 (36)
AtBot: Как это работает и как его использовать ### Как это работает Индикатор "AtBot" для платформы MT5 генерирует сигналы на покупку и продажу, используя комбинацию инструментов технического анализа. Он интегрирует простую скользящую среднюю (SMA), экспоненциальную скользящую среднюю (EMA) и индекс средней истинной амплитуды (ATR) для выявления торговых возможностей. Кроме того, он может использовать свечи Heikin Ashi для повышения точности сигналов. Оставьте отзыв после покупки и получите спе
Раскройте силу торговли трендами с помощью индикатора Trend Screener: вашего идеального решения для торговли трендами, основанного на нечеткой логике и мультивалютной системе! Повысьте уровень своей торговли по тренду с помощью Trend Screener, революционного индикатора тренда, основанного на нечеткой логике. Это мощный индикатор отслеживания тренда, который сочетает в себе более 13 инструментов и функций премиум-класса и 3 торговые стратегии, что делает его универсальным выбором для превращения
Прежде всего стоит подчеркнуть, что эта торговая система является индикатором без перерисовки, без повторной отрисовки и без задержки, что делает ее идеальной как для ручной, так и для роботизированной торговли. Онлайн курс, руководство и загрузка пресетов. «Smart Trend Trading System MT5» - это комплексное торговое решение, созданное для новичков и опытных трейдеров. Он объединяет более 10 премиальных индикаторов и предлагает более 7 надежных торговых стратегий, что делает его универсальным
Прежде всего стоит подчеркнуть, что этот торговый индикатор не перерисовывается, не перерисовывает и не отставает, что делает его идеальным как для ручной, так и для роботизированной торговли. Руководство пользователя: настройки, вводы и стратегия. Атомный аналитик - это индикатор ценового действия PA, который использует силу и импульс цены, чтобы найти лучший край на рынке. Оборудованный расширенными фильтрами, которые помогают убирать шумы и ложные сигналы, и повышают торговый потенциал. Испо
Представляем   Quantum TrendPulse   , совершенный торговый инструмент, который объединяет мощь   SuperTrend   ,   RSI   и   Stochastic   в один комплексный индикатор, чтобы максимизировать ваш торговый потенциал. Разработанный для трейдеров, которые ищут точность и эффективность, этот индикатор помогает вам уверенно определять рыночные тренды, сдвиги импульса и оптимальные точки входа и выхода. Основные характеристики: Интеграция SuperTrend:   легко следуйте преобладающим рыночным тенденциям и п
FX Volume MT5
Daniel Stein
4.93 (14)
Получайте ежедневную информацию о рынке с подробностями и скриншотами в нашем утреннем брифинге здесь, на mql5 , и в Telegram ! FX Volume - это ПЕРВЫЙ и ЕДИНСТВЕННЫЙ индикатор объема, который дает РЕАЛЬНОЕ представление о настроении рынка с точки зрения брокера. Он дает потрясающее представление о том, как институциональные участники рынка, такие как брокеры, позиционируют себя на рынке Forex, гораздо быстрее, чем отчеты COT. Видеть эту информацию прямо на своем графике - это настоящий геймчей
Получайте ежедневную информацию о рынке с подробностями и скриншотами через наш утренний брифинг здесь, на mql5 , и в Telegram ! FX Power MT5 NG - это новое поколение нашего популярного измерителя силы валют FX Power. Что же предлагает этот измеритель силы нового поколения? Все, что вы любили в оригинальном FX Power ПЛЮС Анализ силы GOLD/XAU Еще более точные результаты расчетов Индивидуально настраиваемые периоды анализа Настраиваемый предел расчета для еще более высокой производительности Спец
Gold Stuff mt5
Vasiliy Strukov
4.92 (169)
Gold Stuff mt5 - трендовый индикатор, разработанный специально для золота, также может использоваться на любых финансовых инструментах. Индикатор не перерисовывается и не запаздывает. Рекомендуемый тайм-фрейм H1.  Свяжитесь со мной сразу после покупки для получения   персонального бонуса!   Вы можете получить бесплатную копию нашего индикатора Strong Support and Trend Scanner, пожалуйста, в личку. мне! Настройки и мануал  здесь ПАРАМЕТРЫ Draw Arrow -   вкл.выкл. отрисовку стрелок на графике. A
Эта панель показывает последние доступные   гармонические паттерны   для выбранных символов, так что вы сэкономите время и будете более эффективны /   MT4 версия . Бесплатный индикатор:   Basic Harmonic Pattern Колонки индикатора Symbol:   отображаются выбранные символы Trend   :   бычий или медвежий Pattern   :   тип паттерна (Гартли, бабочка, летучая мышь, краб, акула, шифр или ABCD) Entry   :   цена входа SL:   цена стоп-лосса TP1:   цена первого тейк-профита TP2:   цена второго тейк-про
Представляем       Quantum Breakout PRO   , новаторский индикатор MQL5, который меняет ваш способ торговли в зонах прорыва! Разработан командой опытных трейдеров со стажем торговли более 13 лет,       Квантовый прорыв PRO       разработан, чтобы поднять ваше торговое путешествие к новым высотам с его инновационной и динамичной стратегией зоны прорыва. Quantum Breakout Indicator покажет вам сигнальные стрелки на зонах прорыва с 5 целевыми зонами прибыли и предложением стоп-лосса на основе по
Топовый индикатор МТ5, дающий сигналы для входа в сделки без перерисовки! Идеальные точки входа в сделки для  валют, крипты, металлов, акций, индексов !  Смотрите  видео  (6:22) с примером отработки всего одного сигнала, окупившего индикатор. Версия индикатора для MT4 Преимущества индикатора Сигналы на вход без перерисовки Если сигнал появился, он никуда НЕ исчезает! В отличие от индикаторов с перерисовкой, которые ведут к потере депозита, потому что могут показать сигнал, а потом убрать его.
Индикатор Supply Demand использует предыдущее ценовое действие для выявления потенциального дисбаланса между покупателями и продавцами. Ключевым является определение зон с лучшими возможностями, а не просто вероятностей. Индикатор Blahtech Supply Demand обеспечивает функционал, не доступный ни в одной платформе. Этот индикатор 4 в 1 не только выделяет зоны с более высокой вероятностью на основе механизма оценки силы по множественным критериям, но также комбинирует его с мульти-таймфреймовым ана
Индикатор Gann Squares представляет собой мощный инструмент для анализа рынка, основанный на математических концепциях, представленных W.D. Gann в его статье "Математическая формула для прогнозирования рынка." Этот индикатор включает в себя техники Ганна, связанные с квадратными числами, такими как 144, 90 и 52, а также Квадрат 9. Кроме того, он включает метод по использованию Квадрата 9 в сочетании с каналами и паттерном звезды. Руководство пользователя и использование: Перед использованием это
TPA True Price Action indicator reveals the true price action of the market makers through 100% non-repainting signals strictly at the close of a candle! TPA shows entries and re-entries, every time the bulls are definitely stronger than the bears and vice versa. Not to confuse with red/green candles. The shift of power gets confirmed at the earliest stage and is ONE exit strategy of several. There are available now two free parts of the TPA User Guide for our customers. The first "The Basics"
Matrix Arrow Indicator MT5
Juvenille Emperor Limited
5 (13)
Индикатор Matrix Arrow MT5   — это уникальный индикатор тренда 10 в 1, следующий за   100% неперерисовывающимся   индикатором с несколькими таймфреймами, который можно использовать на всех символах/инструментах:   форекс ,  товары ,   криптовалюты ,   индексы ,  акции . Индикатор Matrix Arrow MT5  будет определять текущую тенденцию на ранних этапах, собирая информацию и данные от до 10 стандартных индикаторов, а именно: Индекс среднего направленного движения (ADX) Индекс товарного канала (CCI)
Quantum Trend Sniper
Bogdan Ion Puscasu
4.8 (49)
Представляем       Индикатор Quantum Trend Sniper   , инновационный индикатор MQL5, который меняет способ определения разворотов тренда и торговли ими! Разработан командой опытных трейдеров со стажем торговли более 13 лет,       Снайперский индикатор Quantum Trend       разработан, чтобы вывести ваше торговое путешествие на новые высоты благодаря инновационному способу определения разворотов тренда с чрезвычайно высокой точностью. ***Купите индикатор Quantum Trend Sniper и получите индикатор
Auto Order Block with break of structure based on ICT and Smart Money Concepts (SMC) Futures Break of Structure ( BoS )             Order block ( OB )            Higher time frame Order block / Point of Interest ( POI )    shown on current chart           Fair value Gap ( FVG ) / Imbalance   -  MTF      ( Multi Time Frame )    HH/LL/HL/LH  -  MTF      ( Multi Time Frame )  Choch  MTF      ( Multi Time Frame )  Volume Imbalance     ,  MTF          vIMB Gap’s Power of 3 Equal High
Сейчас 147 долл. США (увеличиваясь до 499 долл. США после нескольких обновлений) - неограниченные учетные записи (ПК или Mac) Руководство пользователя + Обучающие видео + Доступ к приватному Discord-каналу + VIP-статус и мобильная версия + Лицензия на 5 ПК с неограниченным количеством аккаунтов и терминалов MT4. Сколько раз вы покупали индикатор торговли с замечательными обратными тестами, доказательствами производительности на живых счетах и зашикарными цифрами и статистикой, но после испо
PTS - Divergence Buy Finder от Precision Trading Systems Precision Divergence Finder был разработан для точного определения дна рынка и часто успешно справляется с этой задачей. В техническом анализе искусство выбора дна обычно намного проще, чем выбор вершины, и этот инструмент разработан именно для этой задачи. После обнаружения быстрой дивергенции мудро подождать, пока тренд не изменится вверх, прежде чем покупать. Для входа можно использовать высокий уровень за 10 или 20 баров или скользящее
GannRS Trend Scalper   GannRS is an advanced trading tool based on Gann Law and Supports and Resistances. designed to have an   active trading at any time not lagging Indications are given at the beginning of a new candle Please watch the full tutorial video. How to use GannRS Very easy to set up... Put it on your chart Adjust inputs Inputs Show Resistance and support : [bool]  true = Shows R/S on chart false = does not show Show Levels :[bool]  true = Shows levels on the chart false = doe
Этот индикатор является уникальным, качественным и доступным инструментом для торговли, включающим в себя наши собственные разработки и новую формулу. В обновленной версии появилась возможность отображать зоны двух таймфреймов. Это означает, что вам будут доступны зоны не только на старшем ТФ, а сразу с двух таймфреймов - таймфрейма графика и старшего: отображение вложенных зон. Обновление обязательно понравится всем трейдерам, торгующим по зонам спроса и предложения. Важная информация Для мак
Contact me for instruction, any questions! Related Product:  Gold Trade Expert MT5 Introduction The breakout and retest strategy is traded support and resistance levels. it involves price breaking through a previous level.  The break and retest strategy is designed to help traders do two main things, the first is to avoid false breakouts. Many false breakouts start with a candlestick that breaks out of a level but ends with an immediate candlestick that brings the price back into the level. T
Ищете мощный индикатор для торговли на рынке Форекс, который поможет вам с легкостью определить прибыльные торговые возможности? Не ищите ничего, кроме Beast Super Signal. Этот простой в использовании индикатор, основанный на тренде, постоянно отслеживает рыночные условия, ищет новые развивающиеся тренды или отслеживает уже существующие. Beast Super Signal дает сигнал на покупку или продажу, когда все внутренние стратегии совпадают и на 100% совпадают друг с другом, что устраняет необходимость
WHY IS OUR FXACCCURATE LS MT5 THE PROFITABLE ? PROTECT YOUR CAPITAL WITH RISK MANAGEMENT Gives entry, stop and target levels from time to time. It finds Trading opportunities by analyzing what the price is doing during established trends. POWERFUL INDICATOR FOR A RELIABLE STRATEGIES We have made these indicators with a lot of years of hard work. It is made at a very advanced level. Established trends provide dozens of trading opportunities, but most trend indicators completely ignore them!
ICT, SMC, SMART MONEY CONCEPTS, SMART MONEY, Smart Money Concept, Support and Resistance, Trend Analysis, Price Action, Market Structure, Order Blocks, BOS/CHoCH,   Breaker Blocks ,  Momentum Shift,   Supply&Demand Zone/Order Blocks , Strong Imbalance,   HH/LL/HL/LH,    Fair Value Gap, FVG,  Premium  &   Discount   Zones, Fibonacci Retracement, OTE, Buy Side Liquidity, Sell Side Liquidity, BSL/SSL Taken, Equal Highs & Lows, MTF Dashboard, Multiple Time Frame, BigBar, HTF OB, HTF Market Structure
[ MT4 Version ] Only the next 10 units at current price! Final price: $299 Are you tired of spending months on demo or live accounts to test your trading strategies? The Backtesting Simulator is the ultimate tool designed to elevate your backtesting experience to new heights. Utilizing Metatrader historical symbol information, it offers an unparalleled simulation of real market conditions. Take control of your testing speed, test ideas quickly or at a slower pace, and witness remarkable improve
Индикатор Trend Line Map является дополнением к индикатору Trend Screener Indicator. Он работает как сканер всех сигналов, генерируемых скринером тренда (сигналы линии тренда). Это сканер линий тренда на основе индикатора Trend Screener. Если у вас нет индикатора Trend Screener Pro, программа Trend Line Map Pro работать не будет. It's a Trend Line Scanner based on Trend Screener Indicator. If you don't have Trend Screener Pro Indicator,     the Trend Line Map Pro will not work . Зайдя в н
Introducing the POWER TRADE indicator created by a small group of traders with a few years trading trading the financial market profitably . This is a plug and play indicator that provides you with  POWERFUL Entry signals with Profit Taking and rebound zones. The indicator Works with all MT5 trading instruments. The indicator uses previous  chart data as receipt to speculate on future market moves.
Другие продукты этого автора
Description   : The "Market Structure HH HL LH LL" indicator is a powerful and at the same time simple tool for analyzing price dynamics in financial markets. This indicator helps traders and investors identify changes in trends and identify important points in price time series. Displays "BOS" and "CHoCH" lines. Key components of the indicator: HH (Higher High): The top at which the price closes above the previous high top. HH indicates a strengthening uptrend. HL (Higher Low): The minim
Trading system for a variety of trading transactions. Allows you to set the balance to wander around zero - used for specific rebate tasks or similar. Configured to work with hedging   accounts.   There cannot be more than one position in the market   . One general setting, the "   Step, Stop Loss, Take Profit   " parameter is measured in points (example for EURUSD: 1.00055-1.00045 = 10 points). The advisor stops trading (while remaining on the chart) if, when   placing a position, it encounters
The trend trading strategy "Super Trend Flexible Alert EA" is built on the indicator of the same name "Super Trend Flexible Alert". The advisor uses all the information from the indicator, so the advisor has only three parameters, these are: “Working timeframe” – specifies the working timeframe, the timeframe on which the indicator is created, and also from which the “OHLC” data is taken. "Stop Loss" is the constant size of the stop loss, measured in "points" (you can see an example of what "po
The trend indicator "   Super Trend Flexible Alert   " has a minimum of settings. This indicator is designed to be as easy to use as possible. The indicator shows the trend with a main colored line ("SuperTrend" line, which you can see in the "Data Windows" window). Also, in places where the trend changes, the indicator shows colored arrows (   "STBuy" and "   STSell" icons, which you can see in the "Data Windows" window       ). In places where the trend changes, the indicator doesn't give a s
The Candle Length Indicator Alarm generates a sound alert, sends a push notification and an email when the size of the current candlestick changes. The size of the current candlestick can be measured in two ways: The first method: the size of the candlestick is measured from the beginning of the candlestick (from the OPEN price). The second method: the size of the candlestick is measured from current price. The indicator has the following settings: sound — a sound file from the folder: "...\Meta
The Buy Sell Color Background indicator changes the background color depending on position direction. It has three settings: Background color for BUY - background color for a Buy position Background color for SELL - background color for a Sell position Default background color - background color with no open position After you detach the indicator from a chart, its background color changes to Default background color .
Утилита "Калькулятор сигналов" работает прямо из терминала MetaTrader 5, и это большое преимущество, так как терминал осуществляет предварительный отбор и сортировку сигналов. Таким образом, пользователь видит в терминале MetaTrader 5 только сигналы с максимальной совместимостью с его торговым счётом. "Калькулятор сигналов" позволяет дать ответ на один из самых частых вопросов пользователей сервиса Сигналы: "Смогу ли я подписаться на сигнал NNN, и какой объём позиции будет копироваться на мой то
This indicator belongs to the "Stochastic" category. I tried to simplify the control of the indicator as much as possible, so the minimum settings are shown in the input parameters: this is the choice of an icon for the signal arrows. The "Buy" signal is encoded with the ' Buy Arrow code ' parameter, and the "Sell" signal is encoded with the ' Sell Arrow code ' parameter. Signal arrow codes for signals (please use values ​​from 32 to 255) are taken from the Wingdings font. The indicator works on
An Expert Advisor based on the custom indicator. Search for a signal at every tick. Positions are closed by an opposite signal. No trailing. There is no stop loss. There is no take profit. Has a minimum of settings Money management: Lot OR Risk   - type Money management The value for "Money management"   - Money management value Deviation   - admissible slippage Buy Arrow code   (font Wingdings) - character code from 'Wingdings' font for BUY signals Sell Arrow code   (font Wingdings) - characte
The indicator displays three lines and monitors two types of intersections. Three lines of the indicator: "   MA   " - slow indicator "Moving Average", "   DEMA Slow   " - slow indicator "   Double Exponential Moving Average" and "   DEMA Fast   " - fast indicator "Double Exponential Moving Average". Two types of intersections       : "   Alert Price MA   " - the price crosses the   "MA" line and   "   Alert DEMA DEMA   " - the lines cross       "DEMA Slow" and   "DEMA Fast   ". When crossing,
This Expert Advisor belongs to the class of utilities for manual and semi-automatic trading. The "   Pending order at the extremums of the day   " EA places two pending orders at the extremums of the previous day. Parameter "   Pending Orders: ...       " allows you to select the type of pending orders: "   Buy Stop and Sell Stop   " or "   Buy Limit and Sell Limit   "   .       extremum       'Low' offset is made downwards). "   New pending -> delete previous ones   " set to "   true   " will f
The "Panel Partial Closure" utility-panel is intended for quick partial closing of a position that has a profit. It has only two parameters: "   Partial closure #1   " and "   Partial closure #2   ". Works for any symbol and for any 'Magic number' - that is, the utility is primarily intended for manual trading. How it works: For example, you have several positions on "EURUSD", "Jump 100 Index" and "XAUUSD" (gold). The utility finds the position with the largest profit - in the screenshot, this
The 'Supertrend MetaTrader 5' indicator is the basis of the simplest trend trading system. And yet it remains very effective. The indicator works on any timeframe (on the timeframe of the current chart). From the name you can see that this indicator follows the trend, and when the trend changes, the indicator accurately shows the point of the trend change. The basis of 'Supertrend MetaTrader 5' is comparing price and 'Average True Range indicator' values multiplied by a multiplier (there is als
MQL5 "Daily resistance and support" indicator - draws daily support and resistance lines. Drawing is carried out only with the help of graphical objects (trend lines) - indicator buffers are not used in this indicator. The indicator has no settings - the search for levels is carried out on the last 500 bars from the "D1" timeframe and this parameter is hardwired inside the code. Manual trading: When trading manually, this indicator is recommended to be used on timeframes from "M10" to "H1". It
The "   Multi Symbol Trailing   " utility moves Stop Loss for all positions that are currently open (multi-symbol trailing). It is intended primarily to assist in manual trading. There are no restrictions for the utility either by the name of the currency pair or by the individual identifier (Magic number) - the utility processes absolutely all positions that are currently open. The unit of measurement for the "   Trailing Stop   " and "   Trailing Step   " parameters is points (the difference
The trend indicator "Trend Two Moving Average" uses two types of Arrow to display calculation results - these are "Trend UP" and "Trend DN".       Arrows "Trend Up"       are drawn       By       price       'Low'       bar   ,       A       Arrows "Trend DN" -       By       price       'high'. The trend search algorithm is based on the analysis of the price of a bar and the values of two 'Moving Average' indicators. The trend direction is calculated on the current (zero) bar. Therefore, it is
Three TimeFrames indicator-panel. The indicator is made in the form of a panel based on the CAppDialog class. The panel can be minimized or moved around the current chart using the mouse. The indicator shows three timeframes of the current symbol in the panel. In the current version, the indicator has a minimum number of settings - these are the parameters of three timeframes: "Younger timeframe", "   Middle   timeframe   " and "   Older   timeframe   ". When launched, the indicator-panel autom
The "   Market Session Times   " indicator shows the time of four trading sessions: Asia, Europe, America and Pacific. The time of trading sessions is set   in the format       GMT and thus does not depend on the trading server at all. The following data is used: Trading Session City GMT Asia Tokyo Singapore Shanghai 00:00−06:00 01:00−09:00 01:30−07:00 Europe London Frankfurt 07:00−15:30 07:00−15:30 America New York Chicago 13:30−20:00 13:30−20:00 Pacific Wellington Sydney 20:00−0
The indicator shows Fractals from the higher timeframe. It is possible to display two types of Fractals: 'Regular Fractal' and 'BW Fractal'. Consider the formation of the Fractal 'UP'. 'Regular Fractal' is a very strict Fractal in which each subsequent 'high' price (to the left and right of the central bar) is smaller. Whereas in 'BW Fractal' there is only one condition: the central bar (its price 'high') must be the highest. Visually, the difference between these two modes can be seen in diagr
AI Support Resistance This is an indicator that searches for the “Support” and “Resistance” lines. The search is carried out using an algorithm for numerical analysis and data processing. There are three search options available (“mode #1”, “mode #2” and “mode #3”). Each of these options differs in its internal algorithm (at the moment these are completely internal settings, they are not available to the user). We can say that these options differ in the severity of the search. Limitation: At t
The " Open Time Manager " utility opens a position at a specified time and then turns on classic trailing. Time (' Hour ':' Minute ') is always set in the GMT time zone with a GMT Ofset offset. It is possible to select three options for opening a position using the ' Trade mode ' parameter: ' BUY ' ' SELL ' ‘ BUY and SELL (simultaneously) ’ ‘ OFF (no trade, only trailing works) ’ The fourth parameter is used when you only need to enable trailing for your positions and not open new positions. St
Indicator       shows "Support" and "Resistance" lines (these lines are drawn using the DRAW_LINE drawing style - that is, they are not graphic objects). A search for new minimums and maximums is performed to the left and right of the "signal bar" - the "signal bar" is the conventional middle of each new construction. Why is the word Flexible in the name of the indicator? Because we have the possibility to specify different number of bars to the left ('Left Bars') and to the right ('Right Bars'
The indicator shows bullish and bearish divergence. The indicator itself (like regular stochastic) is displayed in a subwindow. Graphical interface   : In the main window, graphical objects “trend line” are created - produced from the “Low” price to the “Low” price (for bullish divergence) and produced from the “High” price to the “High” price (for bearish divergence). The indicator draws in its window exclusively using graphic buffers: “Main”, “Signal”, “Dot”, “Buy” and “Sell”. The "Buy" and "
The dashboard scans the readings of two indicators: 'MACD' and 'Stochastic'. Displays signals in three columns: for MACD, for Stochastic, and the resulting column (if the signal is the same for both indicators).  Scanning can be selected on one or more timeframes. If you disable all timeframes, the dashboard will still load, but with settings specifically for such cases. Signals are always checked for the zero bar (zero bar is the rightmost bar on the chart) of the indicator. Description of para
ATR Bands Alert is a channel indicator where the channel width is calculated as a constant multiplier ("Multiplier") and the value of the "Average True Range" indicator. Unlike Bollinger Bands, the bandwidth is not changed so often – in the ATR Bands Alert indicator, the bands often have long straight lines. The interpretation of the ATR Bands Alert is based on the fact that the price is inside the bands for most of the time, and if the price reaches one of the boundaries, it may indicate a t
Фильтр:
Нет отзывов
Ответ на отзыв