• Обзор
  • Отзывы
  • Обсуждение
  • Что нового

TMA channel with showing trend

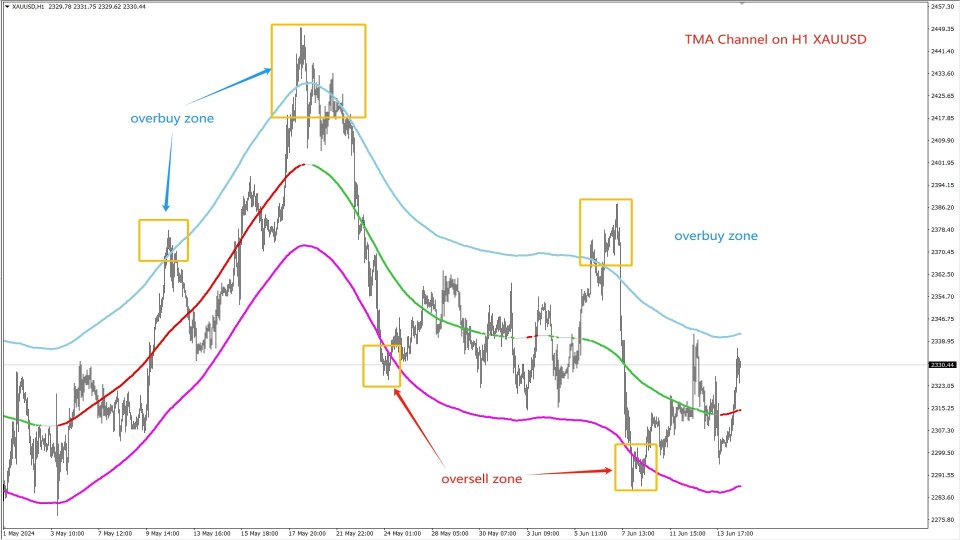
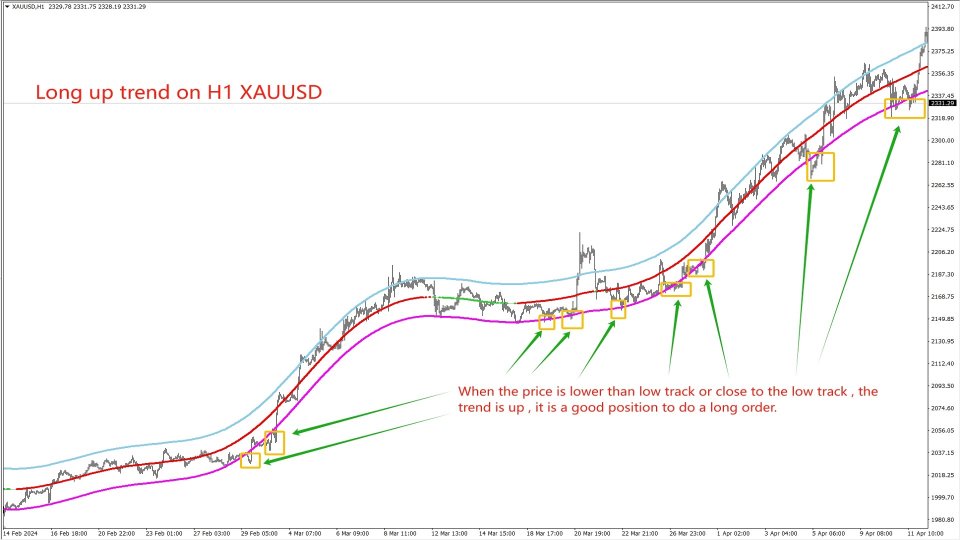
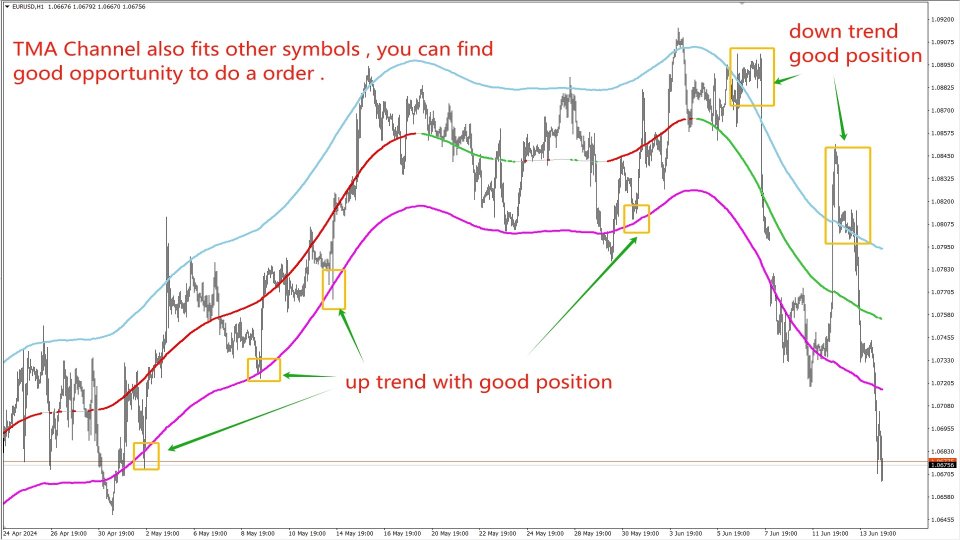
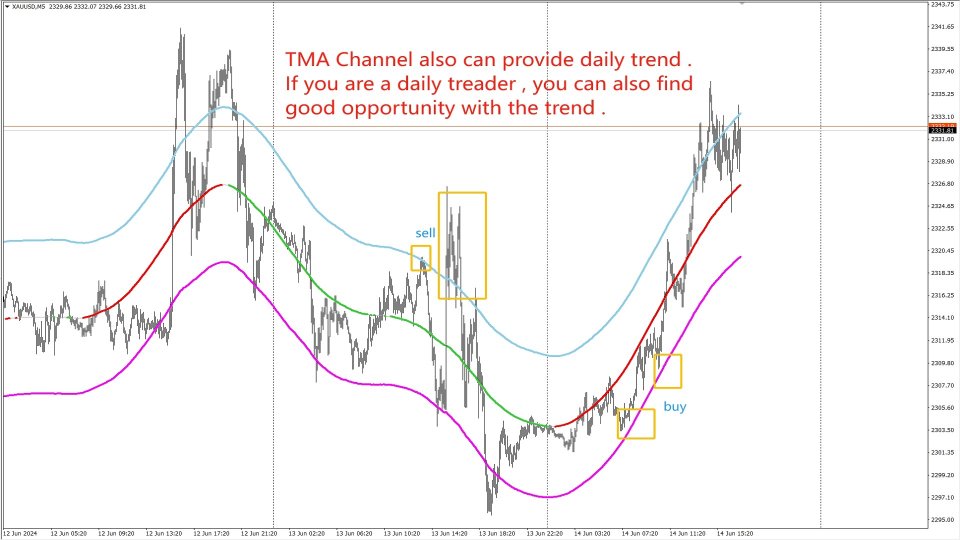
TMA Channel is a price channel obtained through a special calculation method based on traditional TMA . The channel has upper, middle, and lower tracks . When the price approaches or exceeds the upper track, it is already in an overbought state, and attention should be paid to the situation of reversal and decline; When the price approaches or falls below the lower track, it is already in an oversold state, and attention should be paid to the situation of reversal and rise . The indicator will display an upward or downward trend based on the slope of the middle track . When there is no clear trend displayed, it indicates that the market is in a wide range of fluctuations .


Advantages:

Good tracking of trends and clear display of overbought and oversold areas


parameters: 

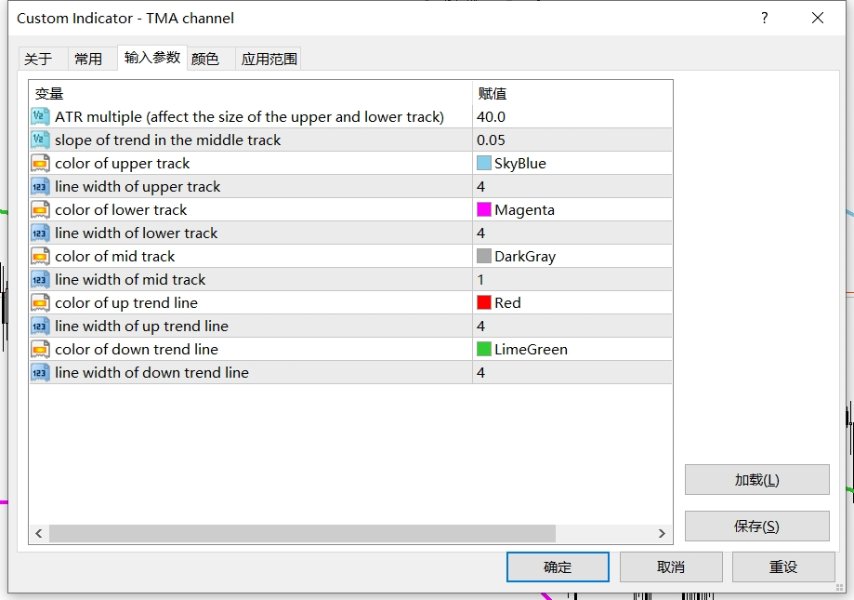
ATR multiple   : The multiplier for ATR is default at 40. Changing this value will affect the positions of the upper and lower bands; a higher value increases the distance between the upper and lower bands relative to the midline

slope of trend in the middle track   :  default 0.05

color of upper track  

line width of upper track   

color of lower track  

line width of lower track  

color of mid track    

line width of mid track  

color of up trend line    

line width of up trend line   

color of down trend line   

line width of down trend line  

Рекомендуем также
About  Holy Renko is a trend identifier capable of identify small and long market movements. This indicator should be use in Renko Charts. VIDEO (information and tips) [HERE] How to install Renko Charts [HERE] Features Developed for Renko Charts Easy to analyze Fast signals Not repaint (when candle close)  Statistics panel Filters false signals Alerts, emails and push notifications  Advantages of Renko Chart Easy to install Easy to analyze Filter out the noise of wicks  Easy ident
Индикатор Before предсказывает наиболее вероятное краткосрочное движение цен на основе сложных математических расчетов. Большинство стандартных индикаторов, обычно использующихся в торговых стратегиях, основаны на довольно простых расчетах. Это не значит, что в период их создания в мире не было выдающихся математиков. Просто в те времена еще не существовало компьютеров или их мощности не хватало для последовательного проведения сложных математических операций. В наши дни любой смартфон намног
Candle GAP
Thushara Dissanayake
3 (1)
Индикатор   Candle GAP   является важным инструментом для трейдеров, использующих   стратегии Gap Trading   , поскольку он автоматически определяет свечные разрывы для каждого дня недели. Гэп относится к разнице ценовых уровней между закрытием и открытием двух последовательных дней. Этот индикатор распознает четыре типа гэп-паттернов: обычный, прорыв, продолжение и истощение. Включив этот индикатор в любой график, трейдеры могут проверять свои сигналы и улучшать свои торговые решения. Одной из
FREE
MASi Three Screens основан на торговой стратегии Доктора Александра Элдера. Данный индикатор является сборником алгоритмов. Алгоритмы основаны на анализе графиков нескольких таймфреймов. Вы можете применить любой из предоставленных. Список версий алгоритмов ThreeScreens v1.0 - Простая реализация, с анализом MACD линии; ThreeScreens v1.1 - Простая реализация, с анализом MACD гистограммы; ThreeScreens v1.2 - Совмещение двух первых алгоритмов в одной версии; ThreeScreens v1.2.1 - В алгоритм внедр
FREE
CyberZingFx Volume
Afsal Meerankutty
4.74 (35)
CyberZingFx Volume Indicator is designed to help traders find market reversals with ease. This powerful tool uses a unique strategy that combines both volume and historical price to provide accurate signals for potential market reversals. The indicator displays volume BUY and SELL power values on the right side of the chart for both BUY and SELL. With customizable settings, you can set alerts at different levels to suit your trading style. The most recent alert value is displayed as Alert High,
FREE
Free automatic fibonacci - это индикатор, который автоматически строит коррекции Фибоначчи, основываясь на количестве баров, выбранных в параметре BarsToScan. Линии Фибоначчи автоматически обновляются в реальном времени при появлении новых максимальных и минимальных значений среди выбранных баров. В настройках индикатора можно выбрать уровни, значения которых будут отображены. Также можно выбрать цвет уровней, что позволяет трейдеру прикреплять индикатор несколько раз с разными настройками и цве
FREE
Данный индикатор создан для поиска предполагаемых разворотных точек цены символа. В его работе используется небольшой разворотный свечной паттерн в совокупности с фильтром экстремумов. Индикатор не перерисовывается! В случае отключения фильтра экстремумов, индикатор показывает все точки, в которых есть паттерн. В случае включения фильтра экстремумов, работает условие – если в истории на Previous bars 1 свечей назад, были более высокие свечки и они дальше чем свеча Previous bars 2 – то тогда тако
FREE
Индикатор показывает гэпы на текущем графике при помощи объектов "прямоугольник", а их заполнение обозначается завершением фигуры. Гэпы учитываются по теням. При нахождении гэпа индикатор может отправлять сообщения по электронной почте или push-уведомления. Параметры SizeGAP - размер гэпов для поиска; HGcolor1 - цвет гэпа при восходящем движении; HGcolor2 - цвет гэпа при нисходящем движении; HGstyle - стиль объектов "прямоугольник"; StartCalculationFromBar - количество свечей для расчетов инди
TrendPlus
Sivakumar Subbaiya
4.08 (12)
Trend Plus   Trendplus  Indicator   Time Frame: Suitable for any time frame.  Purpose: Trend Prediction. Blue and red candle indicate the buy and sell call respectively. Buy: When the blue candle is formed buy call is initiated. close the buy trades when the next red candle will formed.   Sell: When the Red candle is formed Sell call is initiated. close the Sell trades when the next blue candle will formed.   Happy trade!!
FREE
Chaser
Thebo Junior Mahlangu
Introduction  This Indicator Is Based On Average Price/Maximum Price Moves, And Using Moving Bollinger Bands And Moving Averages. The Advantage Of Using It With YOUR own Analysis Will Confirm Potential Supports And Resistances While it Compliments With Your Analysis  The Indicator Is Non-Repainting AND Along With Our Special Trend METRE that Changes With The Conditions OF A Bullish Or Bearish Trend....  Recommend Time-Frames: H1  H4 M15 Usage: The Indicator Is Very Profitable I
FREE
Ловец трендов: Стратегия Ловец трендов с индикатором оповещения - это универсальный инструмент технического анализа, который помогает трейдерам определять рыночные тренды и потенциальные точки входа и выхода. Он представляет собой динамичную стратегию Ловец трендов, адаптирующуюся к рыночным условиям для четкого визуального представления направления тренда. Трейдеры могут настраивать параметры в соответствии со своими предпочтениями и уровнем риска. Индикатор помогает в идентификации тренда,
FREE
This indicator is based on the Weis wave principle of wave volume. Below are few features of the indicator It draws the wave on the chart while the accumulated volume per wave in a different window at the bottom of the chart You can configure the turning point move It displays the accumulated volume (in thousands, eg for 15000 volume it will show 15) at the end of each wave You can also configure to show number of candles in the wave along with the wave volume The indicator calculates the distin
This index can be traced back to historical transactions, and can clearly see the trading location, trading type, profit and loss situation, as well as statistical information. Showlabel is used to display statistics. Summy_from is the start time of order statistics. This parameter is based on the opening time of the order. Backtracking can help us to correct the wrong trading habits, which is very important for beginners to learn manual transactions. This index is suitable for each time
Discover the power of precision and efficiency in your trading with the " Super Auto Fibonacci " MT4 indicator. This cutting-edge tool is meticulously designed to enhance your technical analysis, providing you with invaluable insights to make informed trading decisions. Key Features: Automated Fibonacci Analysis: Say goodbye to the hassle of manual Fibonacci retracement and extension drawing. "Super Auto Fibonacci" instantly identifies and plots Fibonacci levels on your MT4 chart, saving you tim
FREE
The indicator builds a Renko chart in the sub window for the current symbol. The bars are formed from live data and the desired bar size can be set in the inputs tab. Most importantly, because the Renko chart only uses price to construct bars and ignores time, the indicator can be applied to any time frame and same results can be achieved. Recommended usage As Renko charts are famous for eliminating noise so traders can use this tool to see clear picture of the trend to help their analysis, ent
FREE
Are you tired of drawing trendlines every time you're analyzing charts? Or perhaps you would like more consistency in your technical analysis. Then this is for you. This indicator will draw trend lines automatically when dropped on a chart. How it works Works similar to standard deviation channel found on mt4 and mt5. It has 2 parameters: 1. Starting Bar 2. Number of bars for calculation The   starting bar   is the bar which drawing of the trend lines will begin, while the   number of bars for c
FREE
Rira Renko
Vitor Palmeira Abbehusen
RENKO on Time Chart This indicator is an enhanced Renko, so you can watch the Renko bricks on the chart to understand price movement more clearly the other improvement is automated box size according to ATR (Average True Range) period you can set the ATR number as you want and the box size of Renko changes automatically based on price movement Inputs Mode: Box size is the input to specify the size of the Renko box you want to print on the chart. This input lets you choose the fixed b
MTF Heiken Ashi MA - мультитаймфреймовый индикатор Heiken Ashi и скользящей средней. Полностью настраиваемый индикатор для продвинутых и уникальных расчетов Heiken AshiHeiken Ashi и скользящей средней (HA-Bodies). Основные возможности Три значения баров на истории - закрытия, максимума и минимума. Мультитаймфреймовый характер; особенно полезно для свинговых стратегий. Не перерисовывается; хороший инструмент для скальперских стратегий. Входные параметры Timeframe = PERIOD_CURRENT - таймфрейм
FREE
Ночной Призрак - Стрелочный индикатор для Бинарных опционов. Это надежный помощник вам в будущем! -Отсутствует перерисовка на графике -Работает отлично на валютных парах EUR/USD! -Точность индикатора до 90% (Особенно ночью) -Не нужно долго настраивать (Настроено идеально для Бинарных Опционов) -Не опаздывающие сигналы -Появление сигнала на текущей свече -Идеально подходит для периода М1 (Не Больше!) -Удобный для глаз цвет свечей (Красный и Синий) -Установлен Алерт  Работа с ним: -Синяя стрелка
"Adjustable Fractals" - is an advanced version of fractal indicator, very useful trading tool! As we know   Standard fractals mt4 indicator does not have settings at all   - this is very inconvenient for traders Adjustable Fractals has resolved that issue - it has all necessary settings: Adjustable period   of indicator (recommended values - above 7) Adjustable distance   from Highs/Lows of price Adjustable design   af fractal arrows // More great Expert Advisors and Indicators are available he
Angry
Maryna Shulzhenko
Angry - трендовый индикатор, он хорошо указывает точки начала тренда и его завершения или разворота. Данный инструмент сканирует рынок в поиске корректного входа. На фоне не значительных колебаний позволяют выявить тренд и указать его направление.  Для расчета точек входа использует только данные цены и аналитику. Не использует вспомогательных индикаторов.  Angry фиксирует моменты устойчивого направления движения цены. Имеется всего три типа тренда: Бычий - когда цена движется вверх, медвежий
Introduction This indicator detects volume spread patterns for buy and sell opportunity. The patterns include demand and supply patterns. You might use each pattern for trading. However, these patterns are best used to detect the demand zone (=accumulation area) and supply zone (=distribution area). Demand pattern indicates generally potential buying opportunity. Supply pattern indicates generally potential selling opportunity. These are the underlying patterns rather than direct price action. T
FREE
5/35 Oscillator to be used with our Elliott Wave Indicator as part of the overall strategy on trading the 5th wave. The Elliott Wave Indicator Suite is designed around a simple but effective Swing Trading Strategy. The Indicator Suite is great for Stocks, Futures and Forex trading on multiple timeframes You can find the main Elliott Wave Indicator here  https://www.mql5.com/en/market/product/44034
FREE
Данный индикатор предназначен для работы на любом ТФ. Программа на основе авторских алгоритмов и математике W.D.Ganna позволяет рассчитать целевые уровни движения цены по трем точкам с высочайшей степенью достоверности. Является прекрасным инструментом для биржевой торговли. Индикатор оснащен тремя кнопками NEW - вызвать треугольник для расчета. DEL - удалить выбранный треугольник. DELS - полностью удалить все построения. Вероятность достижения целей более 80%. Так же индикатор оснащен сигналом
Wicks UpDown Target GJ Wicks UpDown Target GJ is specialized in GJ forex pairs. Choppy movement up and down on the opening range every day.  Trading breakouts on London session and New York session is recommended. Guideline Entry Strategy Idea: Step 1 - Breakout Forming (Warning! Trade on London Session and New York Session) Step 2 - Breakout Starting (Take Action on your trading plan) Step 3 - Partial Close your order & set breakeven (no-risk) Step 4 - Target complete Step 5 - Don't tr
FREE
Head and Shoulders Pattern Indicator - Your Key to Recognizing Trend Reversals Unlock the power of pattern recognition with the "Head and Shoulders Pattern Indicator." This cutting-edge tool, designed for MetaTrader, is your trusted ally in identifying one of the most powerful chart patterns in technical analysis. Whether you're a novice or an experienced trader, this indicator simplifies the process of spotting the Head and Shoulders pattern, allowing you to make informed trading decisions. Key
FREE
Индикатор торговой платформы MetaTrader 4, RSI TrendLine Divergency Message - три в одном, в отличие от стандартного имеет систему оповещений об изменении рыночной ситуации, состоящую из сигналов: Пересечение Главной линией уровней крайних зон и уровня 50%; Пересечение Главной линией Трендовой линии в окне индикатора; Дивергенция на последнем баре. Параметры экстремальных, среднего уровней и зон дивергенции - настраиваемые. Параметры Language – выбрать русский/английский язык; Options – настро
Triple RSI
Pablo Leonardo Spata
1 (1)
LOOK AT THE FOLLOWING STRATEGY   WITH THIS INDICATOR.   Triple RSI   is a tool that uses the classic Relative Strength Indicator, but in several timeframes to find market reversals.    1.  ️ Idea behind the indicator and its strategy: In Trading, be it Forex or any other asset, the ideal is   to keep it simple, the simpler the better . The   triple RSI   strategy is one of the simple strategies that seek market returns. In our experience, where there is more money to always be won, i
FREE
Индикатор показывает последние нетронутые уровни поддержки и сопротивления в виде горизонтальных линий. Индикатор может показывать уровни поддержки/сопротивления с более высоких таймфреймов. С помощью данного индикатора вы легко можете увидеть уровни поддержки/сопротивления с таймфреймов H4, D1 и W1 на графике H1, что может быть большим преимуществом при поиске возможностей входа на H1. Это бесплатная версия индикатора: Support Resistance Multi Time Frame Бесплатная версия работает только на EUR
FREE
The   True Magic Oscillator   indicator is designed for signal trading. This indicator generates trend signals. It uses many algorithms and indicators to generate this signal. It tries to generate signals from the points with the highest trend potential. This indicator is a complete trading product. This indicator does not need any additional indicators. The indicator is never repainted. The point at which the signal is given does not change.         Features and Recommendations Wor
С этим продуктом покупают
ПОЖАЛУЙСТА, ПРОЧТИТЕ ИНФОРМАЦИЮ НИЖЕ ПЕРЕД ПОКУПКОЙ! Apollo Pips PLUS SP – уникальный продукт! ЭТО ДЛЯ ТЕХ, КТО ХОЧЕТ ПОЛУЧИТЬ МОЙ НОВЫЙ ИНДИКАТОР «APOLLO PIPS» + БОНУС «SUPER PACK» С ДОСТУПОМ КО ВСЕМ МОИМ ТОРГОВЫМ ИНДИКАТОРАМ! Покупая продукт Apollo Pips PLUS SP, вы фактически приобретаете абсолютно новую версию моего индикатора Apollo Pips. Эта версия индикатора имеет улучшенный алгоритм и простой в использовании параметр, который дает вам возможность использовать индикатор на любом рынке и в
Enigmera
Ivan Stefanov
5 (3)
ЭНИГМЕРА: ядро рынка https://www.enigmera.com Введение Этот индикатор и торговая система представляют собой удивительный подход к финансовым рынкам. ENIGMERA использует фрактальные циклы для точного расчета уровней поддержки и сопротивления. Он показывает подлинную фазу накопления и дает направление и цели.  Система, которая работает независимо от того, находимся ли мы в тренде или в коррекции.  Как она работает? ENIGMERA состоит из трех линий: линии поддержки/сопротивления, линии цели и ли
TrendMaestro
Stefano Frisetti
5 (3)
note: this indicator is for METATRADER4, if you want the version for METATRADER5 this is the link:  https://www.mql5.com/it/market/product/108106 TRENDMAESTRO ver 2.4 TRENDMAESTRO recognizes a new TREND in the bud, he never makes mistakes. The certainty of identifying a new TREND is priceless. DESCRIPTION TRENDMAESTRO identifies a new TREND in the bud, this indicator examines the volatility, volumes and momentum to identify the moment in which there is an explosion of one or more of these data a
Данный индикатор основан на индикаторе Gann Signal  и выполняет роль сканера рынка. Все что вам нужно это заполнить в настройках выбранные валютные пары и все. Далее индикатор сам будет просматривать все эти валютные пары и тайм фреймы от М5 до D1  одновременно. При появлении нового сигнала индикатор выдаст вам Алерт а так же нарисует букву N там где будет этот новый сигнал. 
Bomb Bank Signal
Igor Pereira Calil
5 (1)
Сигнал банка-бомбы: индикатор вашей уверенности в MetaTrader 4 Bomb Bank Signal — мощный индикатор для MetaTrader 4, предназначенный для выявления наиболее актуальных тенденций финансового рынка. Если вы ищете инструмент, который точно предугадывает движения, Bomb Bank — ваш союзник. Как это работает: Этот индикатор сочетает в себе три различных метода — анализ объема, закрытие свечей и симметричный тренд — для обнаружения и сигнализации о возможностях покупки и продажи. Банк-бомба похож
Precautions for subscribing to indicator This indicator only supports the computer version of MT4 Does not support MT5, mobile phones, tablets The indicator only shows the day's entry arrow The previous history arrow will not be displayed (Live broadcast is for demonstration) The indicator is a trading aid Is not a EA automatic trading No copy trading function The indicator only indicates the entry position No exit (target profit)  The entry stop loss point is set at 30-50 PIPS Or the front
This indicator ( dashboard) provides trend for multi currency on multi timeframe Charts. It gives entries and Stoploss on the chart itself  if the currency pair is uptrend then the cell color is displayed as Green and if its downtrend the cell displays the color as Red Alerts are generated whenever the trend changes on that particular timeframe. can customize the time frames as desired
Septermber OFFER 85% OFF next price for unlimited version will be 2500$. This is the only time you can get this institutional and professional indicator at this price for unlimited version. Don't dare to miss this. The tool I am about to introduce to you you can't compare it with other tools due to its strategy and accuracy level in predicting the next price directional movement. This tool is designed for serious traders who have decided to make a difference through trading. Be the next person t
Dear Traders this is my another tool called " Swing Master Indicator ". As the name above the indicator is designed to help you in swing trading by capturing the low and highs of the price. You may us this tool with any trading strategy and style from scalping to position trading. It is made for level of traders including newbies and advanced traders even prop-firms, hedge funds and banks to help them make sold market analysis. I create tools for serious traders who want to make a difference in
Max Payne - это индикатор сигналов разворота/тренда, который подает сигналы в виде стрелки. Этот индикатор подает сигнал при закрытии одного и того же бара. Этот индикатор можно опускать на график несколько раз с разными периодами, чтобы получить двойное или тройное подтверждение сигналов. Индикатор легко настраивается, чтобы соответствовать любому стилю торговли, при этом он никогда не перерисовывается и не перерисовывается. После покупки вы получите полную систему, показанную на скриншотах, в
Gann Signal - очень простой на первый взгляд индикатор, но внутри скрыт многолетний опыт изучения методов W.D.Ganna. Индикатор дает точные BUY/SELL сигналы, без перерисовки. Индикатор очень прост в применении. Вам нужно лишь прикрепить его на график и следовать его рекомендациям. Индикатор постоянно ведет анализ рынка на предмет возможностей для входа. Когда такая возможность появляется, индикатор дает сигнал в виде стрелки. Повторяюсь, все сигналы НЕ ПЕРЕРИСОВЫВАЮТСЯ! Индикатор предназначен для
Connect Indicator
Sukunthakan Ngernbamrung
Connect Indicator is a tool used for connecting indicators between the MQL market and MT4. The connected indicators are made by our group and can be used for other applications, such as sending messages to the Line application or Telegram application. If you have any questions, please don't hesitate to ask us to receive support. Function and indicator buffer Buffer one is the high price of the previous candle. Buffer two is the high price of the previous candle. Usage To connect indicators to fu
Al in one level
Kundan Kumar Srivastava
5 (1)
This indicator is collection of important dynamic support and resistance giving a trader crystal clear idea , where to sell and where to buy. it completely complements trend lines, support, resistance, and sideways market and allow a trader to make sustainable profits. The thickness of lines suggests its strengths, the thicker the dynamic line, the stronger is rejection or pullback allowing a trader to make multi-fold profit, as they can clearly see them. Introducing Your Ultimate Trading Edge
Индикатор Full STO (включает в себя все версии трех индикаторов STO: Premium, Gold, Silver) - STABLE TRADE OPTION предназначен для автоматической торговли бинарными опционами.  ЧИТАЕМ ВНИМАТЕЛЬНО!!!!! ВАЖНО В одном терминале создаем два шаблона с разными экспирациями, шаблон на 18:01, 18:02 с экспирацией от 1 до 15 минут и шаблон 22:00 c экспирацией от 10 до 20 минут. Winrate: 71% over the past 5 years Money management: 0.3% from the deposit Данная версия индикатора настроена только на
Contact us to receive a comprehensive user guide after purchasing. William Delbert Gann, commonly known as W.D. Gann, was an exceptional market analyst renowned for his unique trading style in the early 20th century.  His trading techniques were based on a blend of mathematics, geometry, astrology, and ancient mathematics. Gann believed that stock market movements followed specific patterns and cycles, rather than being random. His methodologies, celebrated for their accuracy and relevance, con
Limitless MT4    - это универсальный индикатор который подойдет каждому как начинающему так и опытному трейдеру работает на всех валютных парах криптовалютах сыре акциях Limitless MT4 - уже настроен и не требует дополнительной настройки   А теперь главное Почему    Limitless MT4 ? 1 полное отсутствие перерисовки  2 два года тестирования лучшими специалистами в трейдинге 3 точность правильных сигналов превышает 80% 4 хорошо показал себя в торговле во время выхода новостей Правила торговли  1 сигн
Это индикатор за самые большие деньги. Он обладает исключительными характеристиками. Какой бы интерес ни был на рынке, вы увидите его.  Почти во всех случаях он дает вам только долгосрочный взгляд на рынок, но не обманывайтесь, думая, что он привязан к событиям. Ничего подобного. Он находит, где на рынке находится наибольший интерес, и показывает его вам. Не забывайте, что самые большие деньги (проценты) не отображаются на рынке каждый день. Это то, с чем вы еще не сталкивались. Цена разумная
MT My Way
Issara Seeboonrueang
Best strategy,  Easy trade ,  Support of version update in the future MT My Way:  For new traders with no experience It is a very simple trade. Open the order when there is signal and close the order when there is exit or found the next opposite signal. You can set Stop Loss at the arrow and set the distance at Arrow Gap. For experienced traders, It will be very easy to trade. indicator for trade by yourself TRADE: Forex  TIME FRAME:  All Time Frame (Not M1) SYMBOL PAIR: All Sy
Moving pivot Average Fibonacci The  indicator compares the selected period with its counterpart from the previous period. The indicator determines the moving Fibonacci levels for the day or any time interval to assess the price movement range from the time average. The indicator helps predict the expected high or low for the day based on historical time data. The pivot line can be considered an average trend line and use it in a variety of trading strategies. If you have any question about t
NOTE: PRICE WILL RISE VERY SOON. DON'T SKIP THIS OFFER! Dear traders I am glad to introduce the " Market Swing Scanner Board" indicator to you. This indicator was made mainly to be used in combination with the Market Swing Index Indicator. You use the  "Market Swing Scanner Board"  indicator to scan for trading opportunities on the  Market Swing Index Indicator . This tool is designed for serious traders who have decided to make a difference through trading. Be the next person to witness this st
Robot Choppiness
Diego Mauricio Padilla Mendez
3 (2)
Робот Choppines загружается как индикатор в папку индикаторов MT4. Рекомендуется использовать тайминг свечи 5 минут, рекомендуемое время экспирации робота – 5 минут. Робот можно настроить на отправку сигналов на платформы MT2, MX2, PRICEPRO. Для отправки сигналов необходимо использовать программу-коннектор той платформы, с которой мы хотим работать. Для установки на коннектор выполните следующую процедуру (прилагается изображение с описанием конфигурации с коннектором платформы МТ2):  1
Currently Price 20% OFF ( for unlimited use )   BONUS  AUX VIP Club 2024 : Include  EA Airbag  and  Load Data History  to enhance the performance of this tool to its maximum potential  Click Here to Download Files   ( for users only )   Hello World! Introducing.. SMCpro VIP tool and Indicator for MetaTrader 4, designed to revolutionize your trading experience with the ICT Smart Money Concept. This system is meticulously crafted to empower traders with advanced insights and precision in
Dear Onis, This Indicator is used for   GBPUSD, US30 and GOLD on 1-Min Chart . For US30 , Depending on your broker, Minimum Lot Size will differ from 0.01 to 1.0 lots. My Current Account is trading at 1.0 lots at $1 per point . Please check with your Broker what's the Margin Required for your Minimum lot sizes before you trade on your Real account. I have Forward Tested the indicator for around 6 months before releasing it to the public. ( No Demo is available for the Indicator, Strategy
Автоматические линии тренда, с push, email и звуковыми оповещениями. Вид линий (цвет, толщина, тип) отражает историю их взаимодействия с ценой: отскок, пробой, отскок после пробоя, количество отскоков, двойной пробой. Оповещения информируют пользователя об этих событиях. Пользователь может редактировать линии (корректировать, перетаскивать, удалять) и настраивать систему линий, не выгружая индикатор. Для полноценного использования индикатора рекомендуется ознакомиться с руководством в 5-минутном
Скачайте индикатор уровней поддержки и сопротивления( Support and resistance ). Индикатор рисует горизонтальные и трендовые уровни поддержки и сопротивления. Настройки индикатора: Trends - Установка режима отображения трендовых или горизонтальных уровней поддержки сопротивления Yes - отображает только трендовые уровни No - отображает только горизонтальные уровни UseResource - Установка режима использования встроенных в индикатор ресурсов. Yes - использовать индикатор ZigZag из ресурсов продукта.
The indicator of a Professional Trader - это стрелочный индикатор для прогнозирования направления движения цены. Над этим индикатором я работаю с 2014 года.  Вы можете использовать этот индикатор в качестве основного, использовать его сигналы для входа и использовать его в качестве единственного индикатора для поиска точек входа. О продукте: Рекомендуемый TF [H4-D1-W1] . Индикатор предсказывает направление движения следующей свечи.  Подходят множество инструментов; Гибкость в настройках под
Торговая система для ручной торговли The [GRAFF] III основана на многочисленных индикаторах MetaTrader (MT4). Собранные вместе, эти индикаторы представляют собой эффективный торговый инструмент. Система включает в себя более 20 различных пользовательских индикаторов, которые были тщательно отобраны и протестированы на длительном историческом периоде. Каждый конкретный индикатор основан на той или иной формуле расчета. Таким образом вся система настроена таким образом, чтобы отсеивать ложные сигн
Индикатор отображает силу тренда на всех таймфреймах. Может быть использован на всех символах. Отображается в виде таблицы (слева направо): buy / sell / strong buy / strong sell, сила тренда (в процентах), последняя свеча (в пипсах), тело текущей свечи, оставшееся время, таймфрейм от M1 до MN. Информация в нижней части таблицы (слева направо): суммарное процентное значение тренда, продажа (в процентах), покупка (в процентах).
Другие продукты этого автора
The SuperTrend MTF indicator is an excellent trend tracking indicator . It can not only display SuperTrend trends within the timeframe of the chart, but also set up to display SuperTrend trends for larger time frames simultaneously . This will be beneficial for grasping trends at a larger time scale and predicting future trends . At the same time, the price of the trend line can also be displayed at a glance, making it easy to observe. Input parameters :  ATR period used at chart timeframe 
The SuperTrend MTF indicator is an excellent trend tracking indicator . It can not only display SuperTrend trends within the timeframe of the chart, but also set up to display SuperTrend trends for larger time frames simultaneously . This will be beneficial for grasping trends at a larger time scale and predicting future trends . At the same time, the price of the trend line can also be displayed at a glance, making it easy to observe. Input parameters :  ATR period used at chart timeframe     
Volatility Range is an indicator that calculates the range of volatility, predicting key levels such as potential resistance above and potential support below. The indicator can display volatility forecast ranges for the latest 50 days, 10 weeks, or 4 months. By observing these ranges, you can better identify reliable levels where combining with price action enhances trade accuracy significantly. You have the option to fill the rectangle area with color for easier observation, or leave it unf
Price Action Scanner is an indicator that identifies price behaviors and provides alerts. This indicator can simultaneously detect signals for up to 6 different symbols across various timeframes. By setting a separator, you can add different symbol names and timeframes. The indicator can detect multiple common signal types such as Pinbar, Engulfing Pattern, Inside Bar, Morning Star, Evening Star, Fakey, and display corresponding information in separate subcharts, indicating the direction of t
Price Action Scanner Pro is an indicator that identifies price behaviors and provides alerts, offering more features and customization compared to Price Action Scanner   (  https://www.mql5.com/zh/market/product/118937?source=Site+Profile+Seller   )   . This indicator can simultaneously detect signals for up to 15 symbols across different timeframes. You can configure it to detect signals during specific trading sessions such as Asian, European, and US sessions, using different timeframes. This
Support and Resistance Levels is an intelligent indicator that displays horizontal support and resistance levels, suitable for traders of different trading frequencies. You can select your preferred trading frequency, and the indicator will automatically calculate the support and resistance levels relevant to that frequency. Among these, the Bull-Bear Line is an interval used to distinguish the strength of bullish and bearish forces, and is an important level. You can combine it with other in
TMA Channel is a price channel obtained through a special calculation method based on traditional TMA . The channel has upper, middle, and lower tracks . When the price approaches or exceeds the upper track, it is already in an overbought state, and attention should be paid to the situation of reversal and decline; When the price approaches or falls below the lower track, it is already in an oversold state, and attention should be paid to the situation of reversal and rise . The indicator will
Price Action Scanner is an indicator that identifies price behaviors and provides alerts. This indicator can simultaneously detect signals for up to 6 different symbols across various timeframes. By setting a separator, you can add different symbol names and timeframes. The indicator can detect multiple common signal types such as Pinbar, Engulfing Pattern, Inside Bar, Morning Star, Evening Star, Fakey, and display corresponding information in separate subcharts, indicating the direction of t
Price Action Scanner Pro is an indicator that identifies price behaviors and provides alerts, offering more features and customization compared to Price Action Scanner. This indicator can simultaneously detect signals for up to 15 symbols across different timeframes. You can configure it to detect signals during specific trading sessions such as Asian, European, and US sessions, using different timeframes. This allows you to use lower timeframes for active trading periods and higher timeframes
Support and Resistance Levels is an intelligent indicator that displays horizontal support and resistance levels, suitable for traders of different trading frequencies. You can select your preferred trading frequency, and the indicator will automatically calculate the support and resistance levels relevant to that frequency. Among these, the Bull-Bear Line is an interval used to distinguish the strength of bullish and bearish forces, and is an important level. You can combine it with other in
Фильтр:
Нет отзывов
Ответ на отзыв
Версия 1.1 2024.07.18
Enhanced the display performance of the TMA channel on the chart.