• Обзор
  • Отзывы
  • Обсуждение

PillowIndicator

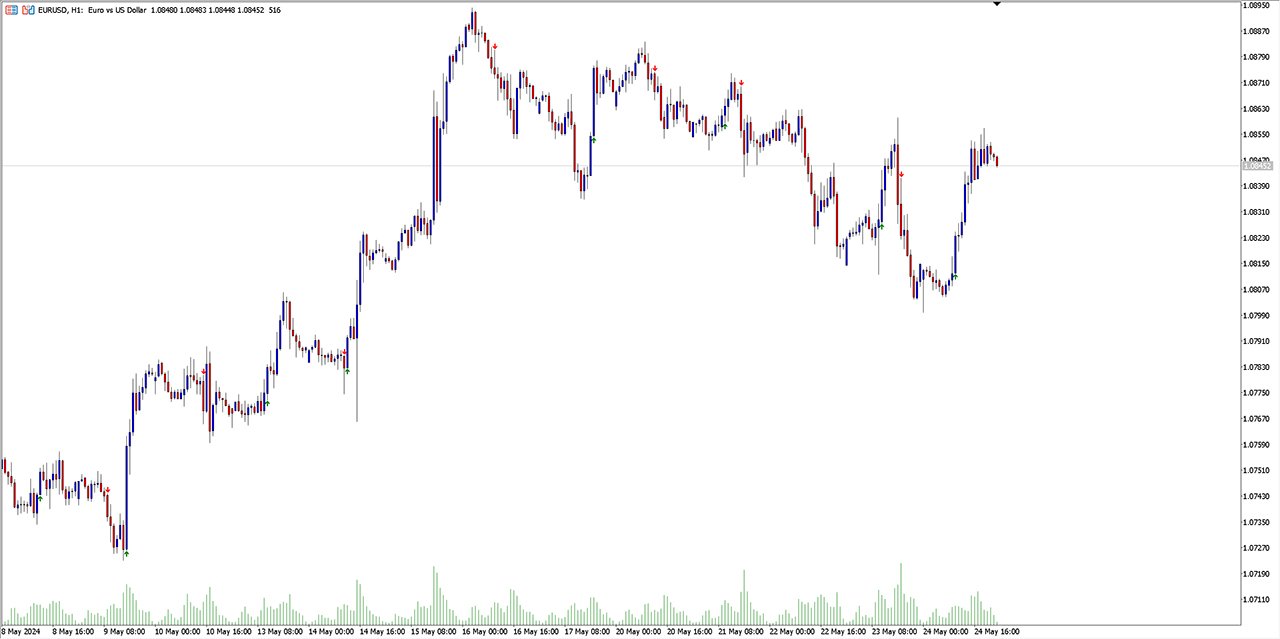
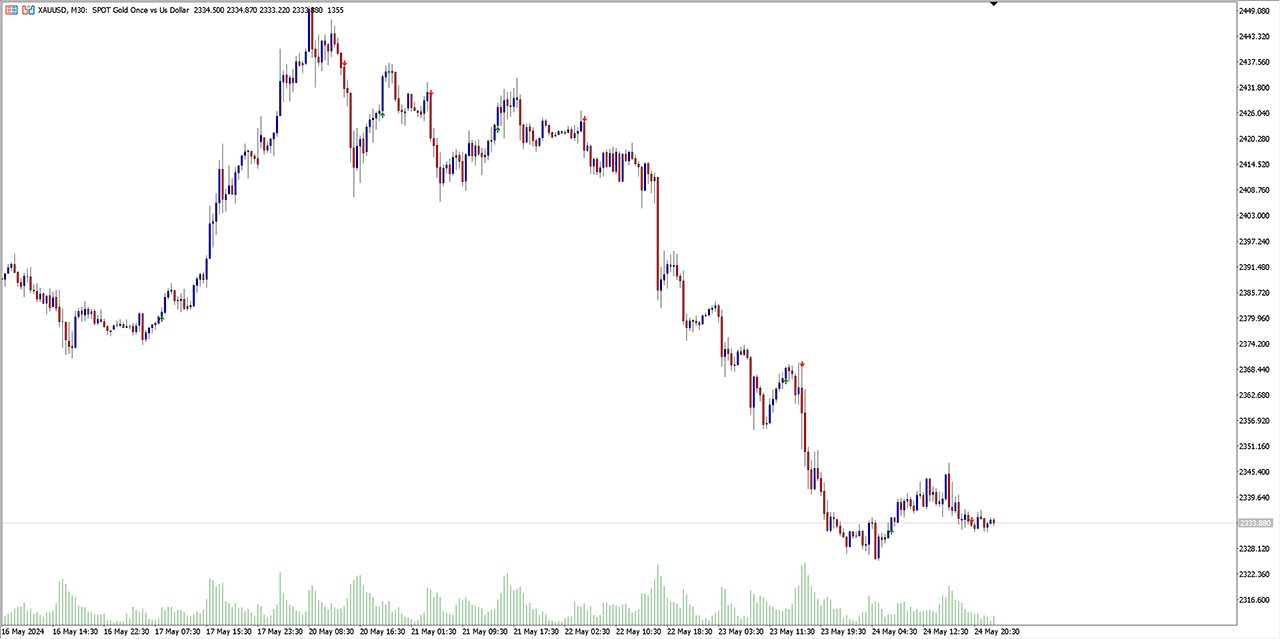
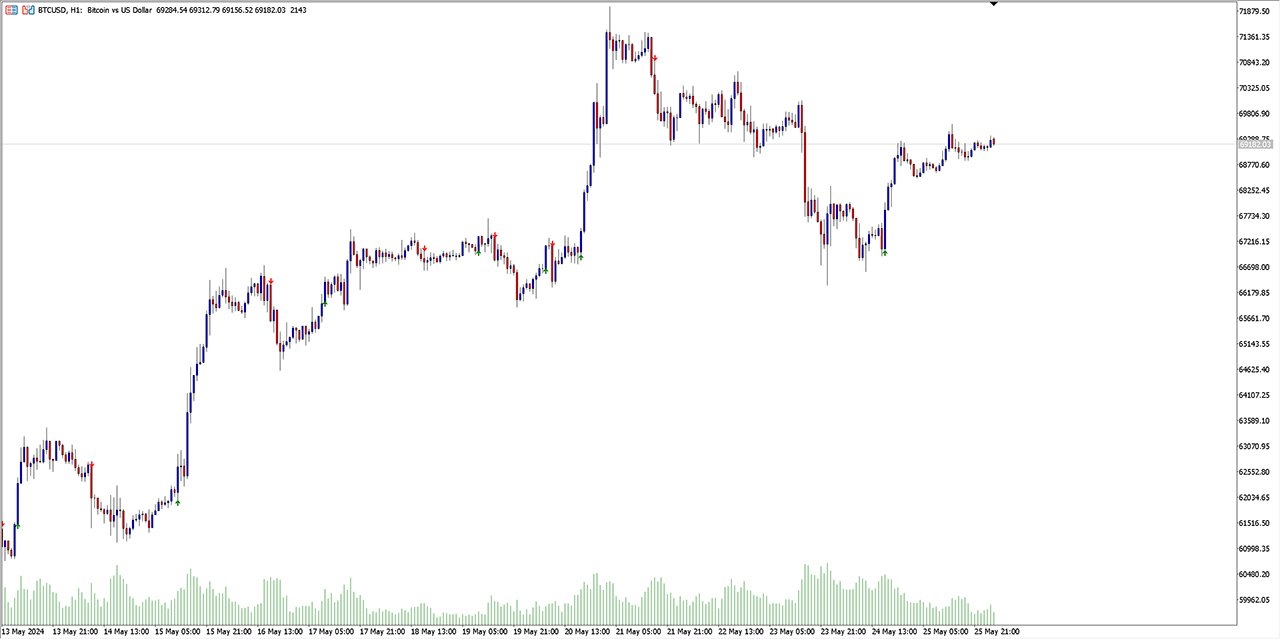
Если вам нужен индикатор, который показывает точки входа в рынок, то это ваш индикатор. 

Индикатор не перерисовывается. Показывает точки покупки и продажи для любого ТФ (таймфрейма) и любой валютной пары. Настройки регулируются для всех инструментов. Каждый параметр вы можете настроить для любого брокера, для любого счёта.

Это ПОДУШКА, на которой удобно:)) Просто проверьте это.....

Рекомендуем также
The third indicator from the set for market analysis. The first one is here:  https://www.mql5.com/ru/market/product/65258 The second one is here: https://www.mql5.com/ru/market/product/65347 The indicator builds a channel of maximum price fluctuations for a specified period. Additionally, the middle of the channel is drawn. All color settings, line types are customizable. The indicator allows you to see the picture of price movement from a slightly different angle. You can use several indic
AI Channel
Thalles Nascimento De Carvalho
4.2 (5)
Welcome to the presentation of the AI Channel indicator, a powerful tool that uses artificial intelligence for price channel analysis in the financial market. In this session, we will explore how this revolutionary indicator can assist investors and traders in making more informed and strategic decisions. Let's get started! I. What is the AI Channel indicator? AI Channel is an indicator developed based on advanced artificial intelligence algorithms. It utilizes historical price data of financial
FREE
!! FLASH SALE !!   Over 80% off !!     For ONE week only. Now only $47 - normally $297! >>>      Ends on 30 June 2023 - Don't miss it! Buy and Sell Arrows On The Chart According To Price Action Sends Alerts On MT5 To Your Phone To You Email Does NOT repaint. Works on any pair, any timeframe.     10 Activations allowed so you are free from limitations. MT4 Version here . For spreads from a tiny 0.1 pips RAW/ECN Accounts,  click here . Check out my Waka Esque EA signal here: >>   High Risk Se
Introducing The Day Trader System: Your Shortcut to Day Trading Success! Are you a day trader seeking simplicity without compromising profitability? Look no further! We present The Day Trader System – your go-to solution for identifying lucrative opportunities in the fast-paced world of Forex. Simple Yet Powerful: The Day Trader System is a straightforward yet highly effective indicator designed exclusively for day traders. Say goodbye to complexity and hello to a system that simplifies
FREE
Большую часть времени рынок находится в состоянии небольших колебаний. Индикатор Trade Area помогает пользователям распознать это время. Индикатор состоит из 5 линий: Area_high, Area_middle, Area_Low, SL_high и SL_low. Рекомендации: Когда цена находится между линиями Area_high и Area_Low, время начинать торговлю. На уровне Area_Low - покупка, на уровне Area_high - продажа. Линии SL_high и SL_low являются уровнем стоп лосса. Измените параметр Deviations для регулирования SL_high и SL_low.
**   All Symbols   x   All Timeframes   scan just by pressing scanner button ** *** Contact me  to send you instruction and add you in "Channel Scanner group" for sharing or seeing experiences with other users. Introduction: The Channel pattern is described as the area located between two trend lines. This area is used for a measure of a trading range. In this case, the upper trend line connects price highs while the lower trend line connects price lows. Also when it comes to breakout points, it
FRB Sell Agression - Indicator shows the Sell Agression Balance of the TIMEFRAMES chosen by the user through a histogram in a new window. - This indicator can only be used if the broker provides data on Volumes. Forex market brokers do not report this data. - B3 (Bovespa - Brazil) informs the data and with that it is possible to use it in Brazilian brokerages. Settings Color - Define the color that will be shown in the histogram. Use Historical Data - Defines whether the indicator will calcul
Horizontal volume bars, Cluster analysis, Volume profile Volume in Range gets information about the accumulated volume in a specified vertical range and period in bars. The received data is then plotted on the chart as rectangular boxes with the volume quantity inside. Usage:- The tool acts as a support resistance levels but most importantly it should be used to check in which direction the price breaks out of the significant levels formed by this indicator and then actions to be taken on correc
RSImaxmin
Carlos Andrés Moya Erazo
4.5 (10)
The indicator shows when there are overprice and divergences on the RSI. In addition, it has configurable alerts, dynamic overprice levels and a special “RSI cleaner” function. The indicator that automatically calculates the premium rates! RSImaxmin is an indicator based on the Relative Strength Index (RSI) oscillator that effectively identifies changes in price trends as it reflects the relative strength of bullish movements compared to bearish movements. It is widely used by traders to measur
Indicator introduction:  A channel and trend line indicator, which is a good tool for manual trading, and also can be used for creating new EAs, without drifting or repainting.  It applies to any timeframes and any symbols.   The work of the indicator is shown in the screenshots. For any novice and programming trading friend, you can write the signal into the EA to play freely, buffer 0 corresponds to the bold trend line, buffer 4 and 5 respectively corresponds to the channel's upper and lower f
Breakeven Line v2 Indicator   is a MetaTrader indicator that calculates breakeven level based on all open positions and displays it on your chart as a horizontal line. Additionally, it will calculate the total number trades, the total number of lots, and the distance to the breakeven line in points and profit/loss. The indicator is available for both MT5. Why use Breakeven Line Indicator? When you have multiple trades opened on a single symbol, it can be difficult to tell where your average ent
IVolX 2 DPOC volume   iVolX 2 DPOC - индикатор динамического горизонтального объема для любых временных периодов Основные настройки индикатора: VolumeSource  - выбор данных для объемов (тиковые или реальные) DPOCOn  - включение/отключение индикатора DPOCFrom  - дата начала расчетов DPOCTo  - дата окончания расчетов Индикатор позволяет в ручном режиме на графике выделять области для анализа изменения максимального объема во времени. Это можно сделать с помощью вертикальных линий, перемещая их по
!! FLASH SALE !!   Over 80% off !!     For ONE week only. Now only $47 - normally $297! >>>      Ends on 30 June 2023 - Don't miss it! Buy And Sell Signal Arrows On The Chart When The Price Is About To Reverse. Also Sends Alerts –On MT5 To Your Phone To Your Email. Does not repaint. Works on any pair, any timeframe.   (Just ajust the settings for your pair and timeframe.) 10 Activations allowed so you are free from limitations MT4 version here .   Spreads from 0.1pip RAW/ECN Accounts,   c
The Fat and Slim indicator tracks strong and weak money in the market. It is derived from RSI, MFI and many similar indicators. Input values are closing prices and volumes. The RSI (yellow curve) is in the range -100 ... 100. It is additionally multiplied by a coefficient so that the curve is not compressed to the middle values at higher periods (a problem with the classic RSI with different periods). Strong/Fat red curve is RSI weighted by higher volumes. Weak/Slim blue curve is calculated so t
Индикатор подкрашивает свечи относительно дельты их объёмов. Вычисление дельты свечей производится на основе тиковой истории либо ленты сделок (см. далее описание входной переменной "Volumes"). Подкраска производится по двум параметрам : по знаку дельты, как цвет свечи, по значению дельты, как контрастность цвета свечи на фоне цвета окна графика. Помимо подкраски свечей индикатор также отображает профиль дельты на промежутке, который задаётся пользователем между двумя вертикальными линиями. По
The Ultimate Dashboard Indicators are useful for traders, but when you put them into a dashboard that can scan 28 symbols at once they become even better, and when you can also combine different indicators and timeframes to give you synchronized alerts, then they become awesome. This easy to use dashboard provides you with 31 leading indicators, use them individually or together, to create powerful combination alerts. So when you want to know that RSI is above 25 and the price is above the movin
1. Why did I develop this series of indicators I found that most traders need to use multiple time frame indicators. They usually switch time frame to see indicators. However, once the timeframe is switched, you cannot see the  corresponding relationship  between  the price in the smaller timeframe  and  the indicator in the larger timeframe . For example: if your price chart is in H1 timeframe, you can see H4, D1 and W1 indicators in H1 timeframe Chart. This is more helpful for you to find th
The EaGo Market Structure Indicator is a powerful tool designed to display market structure on the current chart, with buffers available for seamless integration into your trading system - Expert Advisor (EA)   Key Features: Identifies key market structure points including: Higher High Lower High Higher Low Lower Low Break of Structure (BoS) Bullish Break of Structure (BoS) Bearish Change of Character (ChoCH) Bullish Change of Character (ChoCH) Bearish   All of these data points are accessible
1. Why did I develop this series of indicators I found that most traders need to use multiple time frame indicators. They usually switch time frame to see indicators. However, once the timeframe is switched, you cannot see the  corresponding relationship  between  the price in the smaller timeframe  and  the indicator in the larger timeframe . For example: if your price chart is in H1 timeframe, you can see H4, D1 and W1 indicators in H1 timeframe Chart. This is more helpful for you to find th
The Previous High Low Levels indicator displays the high and low of the previous candle from a selected higher timeframe. This helps traders identify key support and resistance zones while trading on lower timeframes. Features: Plots the previous high and low from a higher timeframe Works on all timeframes and instruments Helps identify strong support and resistance levels Lightweight and does not repaint How to Use: Select a higher timeframe (e.g., H1, H4, D1) in the settings. T
FREE
Профессиональный индикатор НОВОСТЕЙ и Торговых Сессий теперь доступен в MetaTrader 5. Теперь на одном циферблате собрана вся важнейшая рыночная информация! Новости, расположенные на временной шкале. Планировать своё рабочее время ещё никогда не было так просто и удобно... Шкалу новостей можно переключить на день, два, неделю, месяц вперёд или назад (смотрите подробности в коротком видео). Все новости обновляются в реальном времени. Благодаря встроенным фильтрам, можно настроить отображение но
Multi TimeFrame Moving Average MT5
Ahmed Alaaeldin Abdulrahman Ahmed Elherzawi
Unlock the power of the market with the Investment Castle Multi Time Frame Moving Average Indicator. Simplify your trading journey by easily identifying trends and pullbacks across multiple time frames on one convenient chart. This indicator is a must-have tool for any serious trader. Available for MT4 and MT5, and exclusively on the MQL5 market, customize your experience by adding as many indicators as you need on the chart, each with their own unique time frame or period.   Enhance your strat
The "Trend Fishing Indicator" is a powerful custom indicator designed to help traders identify potential trend reversal points and capitalize on market momentum. This indicator uses multiple moving averages of varying periods to evaluate short-term and long-term market trends. By comparing the short-term moving averages against the long-term ones, it generates clear buy and sell signals that can guide traders in making informed trading decisions. Key Features: Multiple Moving Averages : Incorpor
FREE
Представляем RSIScalperPro - революционный индикатор на основе RSI для MetaTrader 5, специально разработанный для скальпинга на графике одной минуты. С RSIScalperPro у вас будет мощный инструментарий для точных сигналов входа и выхода, чтобы повысить вашу торговую эффективность. RSIScalperPro использует два различных индикатора RSI, которые предоставляют четкие сигналы для уровней перекупленности и перепроданности. Вы можете настроить временные периоды и ограничительные значения двух RSI в соот
Индикатор  Mono Waves  предназначен для отображения на графике волнового поведения рынка. Его внешний вид представлен на слайде 1. Этот индикатор использует в своей работе индикатор  PPPC  ( Point - Percent Price Channel ), который можно бесплатно скачать в  Маркете .             Когда рынок движется вверх верхняя граница ценового канала строится по ценам  High  свечей (более подробно см. описание индикатора PPPC по ссылке данной выше). Чем выше поднимаются цены  High , тем выше под
FREE
Индикатор RSI MT5 - это индикатор Metatrader 5, и суть этого технического индикатора заключается в преобразовании накопленных исторических данных на основе индикатора RSI. Сигналы показаны разными цветами свечей. Смотрите настройки, тестируёте. Это очень полезный индикатор и он точно должен быть у вас . The RSI in candlelight MT5 indicator is a Metatrader 5 indicator, and the essence of this technical indicator is to transform the accumulated historical data based on the RSI indicator. Signals a
CLICK HERE FOR A FREE DOWNLOAD AND LONG-LASTING PERFORMANCE This trading indicator Automatically identifies and plots contract blocks, which are essential zones marked by significant levels of support and resistance. This powerful tool provides traders with a clear and intuitive visualization of critical market points where prices are likely to bounce or reverse. The contract blocks, represented by distinct colored rectangles, highlight support zones (at the bottom) and resistance zones (at the
FREE
This Indicator adding power to traditional zigzag indicator. With High-Low numbers in vision it will be easier to estimate change of trend by knowing the depth of each wave. Information including points, pips, percentage%, and #bars can be displayed based on configuration. All information is real-time update. This indicator is especially useful in sideway market to buy low sell high.
The 4 headed dragon is an indicator that has two functions. 1) Set the background trend. 2) Mark the predominant trend. By combining these two indicator signals, we will be able to trade for or against the trend, adapting the signals to your reading of the market. You can download the demo and test it yourself. 1) Set the background trend.    Define four possibilities of trend that are the four heads of the dragon, marked by colors on the indicator, marking a) Powerful buying trend. b) Weak
Introduction This indicator detects volume spread patterns for buy and sell opportunity. The patterns include demand and supply patterns. You might use each pattern for trading. However, these patterns are best used to detect the demand zone (=accumulation area) and supply zone (=distribution area). Demand pattern indicates generally potential buying opportunity. Supply pattern indicates generally potential selling opportunity. These are the underlying patterns rather than direct price action. T
С этим продуктом покупают
Важным ключевым элементом в трейдинге являются зоны или уровни, от которых принимаются решения о покупке или продаже торгового инструмента. Несмотря на попытки крупных игроков скрыть свое присутствие на рынке, они неизбежно оставляют следы. Наша задача заключалась в том, чтобы научиться находить эти следы и правильно их интерпретировать. ИНСТРУКЦИЯ RUS         INSTRUCTIONS  ENG           Рекомендуем использовать с индикатором -   TPSpro  TREND PRO -  Version MT4 Основные функции: Отображения ак
MetaForecast M5
Vahidreza Heidar Gholami
5 (2)
MetaForecast предсказывает и визуализирует будущее любого рынка на основе гармонии в данных о ценах. Хотя рынок не всегда предсказуем, если существует узнаваемый паттерн в ценах, то MetaForecast способен предсказать будущее с наибольшей точностью. По сравнению с другими аналогичными продуктами, MetaForecast способен генерировать более точные результаты, анализируя тренды на рынке. Входные параметры Past size (Размер прошлых данных) Указывает количество баров, которые MetaForecast использует для
Сейчас 147 долл. США (увеличиваясь до 499 долл. США после нескольких обновлений) - неограниченные учетные записи (ПК или Mac) Руководство пользователя + Обучающие видео + Доступ к приватному Discord-каналу + VIP-статус и мобильная версия + Лицензия на 5 ПК с неограниченным количеством аккаунтов и терминалов MT4. Сколько раз вы покупали индикатор торговли с замечательными обратными тестами, доказательствами производительности на живых счетах и зашикарными цифрами и статистикой, но после исполь
Fxaccurate Trend Trading is a method that focuses on identifying and capitalizing on market trends in the foreign exchange (Forex) market. This strategy is grounded in the principle that once a trend is established, it tends to persist, allowing traders to enter positions that align with the market's prevailing direction. Fxaccurate Trend Trading relies on various tools, indicators, and methodologies to spot, confirm, and trade in the direction of a trend, whether it’s upward (bullish) or downwa
note: this indicator is for METATRADER4, if you want the version for METATRADER5 this is the link:  https://www.mql5.com/it/market/product/108106 TRENDMAESTRO ver 2.4 TRENDMAESTRO recognizes a new TREND in the bud, he never makes mistakes. The certainty of identifying a new TREND is priceless. DESCRIPTION TRENDMAESTRO identifies a new TREND in the bud, this indicator examines the volatility, volumes and momentum to identify the moment in which there is an explosion of one or more of these data a
TPA True Price Action indicator reveals the true price action of the market makers through 100% non-repainting signals strictly at the close of a candle! TPA shows entries and re-entries, every time the bulls are definitely stronger than the bears and vice versa. Not to confuse with red/green candles. The shift of power gets confirmed at the earliest stage and is ONE exit strategy of several. There are available now two free parts of the TPA User Guide for our customers. The first "The Basics"
Это, пожалуй, самый полный индикатор автоматического распознавания гармонического ценообразования, который вы можете найти для платформы MetaTrader. Он обнаруживает 19 различных паттернов, воспринимает проекции Фибоначчи так же серьезно, как и вы, отображает зону потенциального разворота (PRZ) и находит подходящие уровни стоп-лосс и тейк-профит. [ Руководство по установке | Руководство по обновлению | Устранение неполадок | FAQ | Все продукты ] Он обнаруживает 19 различных гармонических ценов
Micro  ******************* Секундные графики MT5 ********************** Более точного инструмента для входа в сделку вы не найдёте. Входные параметры: Timeframe, sek - период построения графика, секунды Displayed bars - отображаемые бары Step of price levels, pp, 0-off - шаг отрисовки ценовых уровней, пункты Scale points per bar, 0-off - масштаб в пунктах на бар Show lines - отображение текущих уровней Show comment - отображение комментария Standard color scheme - стандартная цветовая сх
WHY IS OUR FXACCCURATE LS MT5 THE PROFITABLE ? PROTECT YOUR CAPITAL WITH RISK MANAGEMENT Gives entry, stop and target levels from time to time. It finds Trading opportunities by analyzing what the price is doing during established trends. POWERFUL INDICATOR FOR A RELIABLE STRATEGIES We have made these indicators with a lot of years of hard work. It is made at a very advanced level. Established trends provide dozens of trading opportunities, but most trend indicators completely ignore them! The
ОПИСАНИЕ ICSM (Impulse-Correction SCOB Mapper) - это индикатор, который анализирует движение цены и определяет действительные импульсы, коррекции и SCOB (ордер блок на одну свечу). Это мощный инструмент, который можно использовать с любым типом технического анализа, так как он гибкий, информативный, прост в использовании и существенно улучшает понимание трейдером наиболее ликвидных зон интереса. НАСТРОЙКИ Общие | Визуальные Цветовая тема - определяет цветовую тему ICSM. SCOB | Визуальные
Представляем индикатор астрономии для   MT4 / MT5 : Ваш незаменимый небесный товарищ в торговле Готовы ли вы поднять свой опыт торговли до небесных высот? Не ищите дальше, чем наш революционный индикатор астрономии для MT4. Этот инновационный инструмент выходит за рамки традиционных торговых индикаторов, используя сложные алгоритмы для предоставления вам беспрецедентных астрономических понимания и точных расчетов. Вселенская информация под рукой:   Взгляните на обширную панель, раскрывающую сокр
Weis Wave with Alert MT5
Trade The Volume Waves Single Member P.C.
4.94 (16)
Rental/Lifetime Package Options and Privileges  Rent Monthly Six Months   Yearly/Lifetime Weis Wave with Speed with Alert+Speed Index x x x Manual  x x x Quick Set up Video x x x Blog x x x Lifetime Updates x x x Setup and Training Material x x Discord Access Channel "The SI traders"          x Rectangle Break Alert Tool      x How to trade with it:    http://www.tradethevolumewaves.com   ** If you purchase please contact me to setup your  : Two hour  webinar and  training Room and  complet
Индикатор Gann Squares представляет собой мощный инструмент для анализа рынка, основанный на математических концепциях, представленных W.D. Gann в его статье "Математическая формула для прогнозирования рынка." Этот индикатор включает в себя техники Ганна, связанные с квадратными числами, такими как 144, 90 и 52, а также Квадрат 9. Кроме того, он включает метод по использованию Квадрата 9 в сочетании с каналами и паттерном звезды. Руководство пользователя и использование: Перед использованием это
Introduction to Fractal Pattern Scanner Fractal Indicator refers to the technical indicator that makes use of the fractal geometry found in the financial market. Fractal Pattern Scanner is the advanced Fractal Indicator that brings the latest trading technology after the extensive research and development work in the fractal geometry in the financial market. The most important feature in Fractal Pattern Scanner is the ability to measure the turning point probability as well as the trend probabil
The   Gann Scalping Gold Indicator   is a robust technical analysis tool designed for precision trading in gold markets. It leverages Gann-based methodologies to identify key price levels, enabling traders to anticipate potential market reversals, breakouts, and areas of consolidation. Daily Reset Logic: Automatically resets touch statuses at the start of a new trading day, ensuring that the indicator aligns with fresh daily trends. How It Works: The indicator draws horizontal lines at predefine
Elliot Waves Analyzer Pro calculates Elliot Waves to Help Identify Trend direction and Entry Levels. Mainly for Swing Trading Strategies. Usually one would open a Position in trend direction for Wave 3 or a Correction for Wave C . This Indicator draws Target Levels for the current and next wave. Most important Rules for Elliot Wave Analysis are verified by the Indicator.  The Pro version analyzes Multiple Timeframes and shows the Subwaves and Target-Levels.   For an Overview  " Elliot Waves Anal
Bill Williams Advanced предназначен для автоматического анализа графика по системе " Profitunity " Билла Уильямса. Индикатор анализирует сразу четыре таймфрейма. Инструкция/Мануал ( Обязательно читайте перед приобретением ) Преимущества 1. Автоматически анализирует график по системе "Profitunity" Билла Уильямса. Найденные сигналы помещает в таблицу в углу экрана. 2. Оснащён трендовым фильтром по индикатору Аллигатор. Большинство сигналов системы рекомендуется использовать только по тренду. 3. На
Big Player Range
Thalles Nascimento De Carvalho
5 (3)
Откройте Силу "BigPlayerRange": Ваш Союзник в Техническом Анализе Рынка Мы представляем BigPlayerRange , продвинутый инструмент технического анализа, созданный для выявления зон интереса институциональных инвесторов на рынке . С его помощью вы сможете точно определить, где активно действуют крупные игроки, и как это может повлиять на ваши торговые стратегии. Ключевые Особенности: Картирование Зон Институционального Интереса : BigPlayerRange выделяет зоны высокой активности финансовых учре
The AT Forex Indicator MT5 is a sophisticated trading tool designed to provide traders with a comprehensive analysis of multiple currency pairs. This powerful indicator simplifies the complex nature of the forex market, making it accessible for both novice and experienced traders. AT Forex Indicator uses advanced algorithms to detect trends, patterns and is an essential tool for traders aiming to enhance their forex trading performance. With its robust features, ease of use, and reliable signal
CBT Quantum Maverick Высокоэффективная система торговли бинарными опционами CBT Quantum Maverick – это точно настроенная, высокопроизводительная система торговли бинарными опционами, созданная для трейдеров, стремящихся к точности, простоте и дисциплинированному подходу. Настройка не требуется – система оптимизирована для эффективных результатов прямо "из коробки". Просто следуйте сигналам, которые можно освоить с небольшой практикой. Основные характеристики: Точность сигналов: Сигналы для тор
All in One package includes the  Oscillator Predictor ,  MACD Predictor ,  Thrust Scanner  and  Advanced Fibonacci  indicators which are mandatory for applying  Dinapoli  trade plans.  Please visit below links for detailed explanations of indicators. Advanced Fibonacci Indicator =>  https://www.mql5.com/en/market/product/107933 Thrust Scanner Indicator =>  https://www.mql5.com/en/market/product/52829 Overbought /Oversold Predictor indicator => https://www.mql5.com/en/market/product/52628 Macd
IVISTscalp5
Vadym Zhukovskyi
5 (6)
Что нового в индикаторе прогнозов iVISTscalp5 (Версия 10)? iVISTscalp5 – это авторская система прогнозов для любого финансового инструмента на неделю вперед (для быстрого скальпинга по уровням времени). iVISTscalp5 – инструмент для простого изучения и понимания финансового рынка. 1)     Индикатор прогнозов iVISTscalp5 полностью переписан на другой язык программирования ( C ++), что ускорило загрузку и обработку данных. Разное графическое отображение прогнозов на графике будет еще проще для п
EXCLUSIVE! JUST  10 COPIES  AVAILABLE!   BONUS AUX VIP Club 2024 : Include EA CAP, CEP, LDH, PSC307 & AO4C to enhance the performance of this tool to its maximum potential  Click Here to Download Files   ( for users only ) FREE Trading Education Available Daily via Zoom --- For More Info or Instant Message Click link ---  https://t.me/abcdwave Transform your trading with the "Five Magic Bullets" Indicator, tailored for traders who embrace the power of Elliott Wave Chaos Theory.
VIP Buy Sell Signals
Hapu Arachchilage Tharindu Lakmal
Contact me through this email aaddress to download the FREE strategy PDF for this indicator tharindu999lakmal@gmail.com Introduction   The   "Buy Sell Signals"   is designed to provide BUY and SELL trade signals based on the current market conditions.   A   Trading Strategy   (Chee sheet)  has been  provided for this trading indicator.   (Read the description). This indicator has time tuned e ntry signals . so,   you will enter the market at the very best price level   with this indicator .  
Индикатор Elliott Wave Trend был разработан для научного подсчета волн на основе шаблонов и паттернов, впервые разработанных Чжон Хо Сео. Индикатор нацелен на максимальное устранение нечеткости классического подсчета волн Эллиотта с использованием шаблонов и паттернов. Таким образом индикатор Elliott Wave Trend в первую очередь предоставляет шаблон для подсчета волн. Во-вторых, он предлагает структурный подсчет волн Wave Structural Score, которые помогает определить точное формирование волны. Он
Indicator USER MANUAL, trade setups, solving issues, etc :  Direct Download Here     ( for users only ) Hello World! Introducing.. SMCpro tool and Indicator for  MetaTrader 5 , a cutting-edge feature designed to revolutionize your trading experience. With innovative ICT Smart Money Concept, you gain unparalleled insight into market dynamics, empowering you to make informed trading decisions like never before. SMC Indicator built on the foundation of advanced algorithms and real-time dat
PTS - Divergence Buy Finder от Precision Trading Systems Precision Divergence Finder был разработан для точного определения дна рынка и часто успешно справляется с этой задачей. В техническом анализе искусство выбора дна обычно намного проще, чем выбор вершины, и этот инструмент разработан именно для этой задачи. После обнаружения быстрой дивергенции мудро подождать, пока тренд не изменится вверх, прежде чем покупать. Для входа можно использовать высокий уровень за 10 или 20 баров или скользящее
Introduction to X3 Chart Pattern Scanner X3 Cherart Pattern Scanner is the non-repainting and non-lagging indicator detecting X3 chart patterns including Harmonic pattern, Elliott Wave pattern, X3 patterns, and Japanese Candlestick patterns. Historical patterns match with signal patterns. Hence, you can readily develop the solid trading strategy in your chart. More importantly, this superb pattern scanner can detect the optimal pattern of its kind. In addition, you can switch on and off individu
PTS - Divergence Buy Finder от Precision Trading Systems Precision Divergence Finder был разработан для точного определения дна рынка и часто успешно справляется с этой задачей. В техническом анализе искусство выбора дна обычно намного проще, чем выбор вершины, и этот инструмент разработан именно для этой задачи. После обнаружения быстрой дивергенции мудро подождать, пока тренд не изменится вверх, прежде чем покупать. Для входа можно использовать высокий уровень за 10 или 20 баров или скользящее
Happy entries
Godwill Fortune Otieno Juma
The  product gives optimized entries for 3min ,1 hr and day timeframes  Does well with indices  ASIAN- HK50 AND CHINA A50 USA-US30,US100,US500 GER40 ,UK100 For stocks trade with the day timeframes Happy Entry employs advanced algorithms and real-time data analysis to identify optimal entry points with unprecedented accuracy. Its adaptive nature allows it to seamlessly adjust to changing market conditions, ensuring you never miss out on profitable opportunities. Whether you're a beginner or seas
Другие продукты этого автора
Индикатор показывает возможное направление движение цены вверх или вниз, в зависимости от появлении стрелки на графике. Не перерисовывается и не исчезает при изменении направления движения. Работает абсолютно на всех таймфреймах и валютных парах. Работа индикатора основана на свечном анализе за определённый период времени. Стрелка, указывающая на возможное направление движения, появляется как только возник сигнал. Чем больше размер стрелки на графике, тем сильнее сигнал движения цены вверх или
YaY
Sergey Shevchenko
Революционный Советник для Торговли на Рынке Форекс Представляем вашему вниманию новейшего советника для торговли на рынке Форекс, который перевернет ваши представления о возможностях автоматической торговли! Этот уникальный инструмент разработан с использованием самых передовых технологий и многолетнего опыта профессиональных трейдеров. Ключевые особенности нашего советника: Высокая прибыльность : Наш советник способен генерировать значительную прибыль даже в самых сложных рыночных условиях. Бл
Фильтр:
Нет отзывов
Ответ на отзыв