• Обзор
  • Отзывы
  • Обсуждение

Chart Clarity Dashboard MT4

Chart Clarity Dashboard

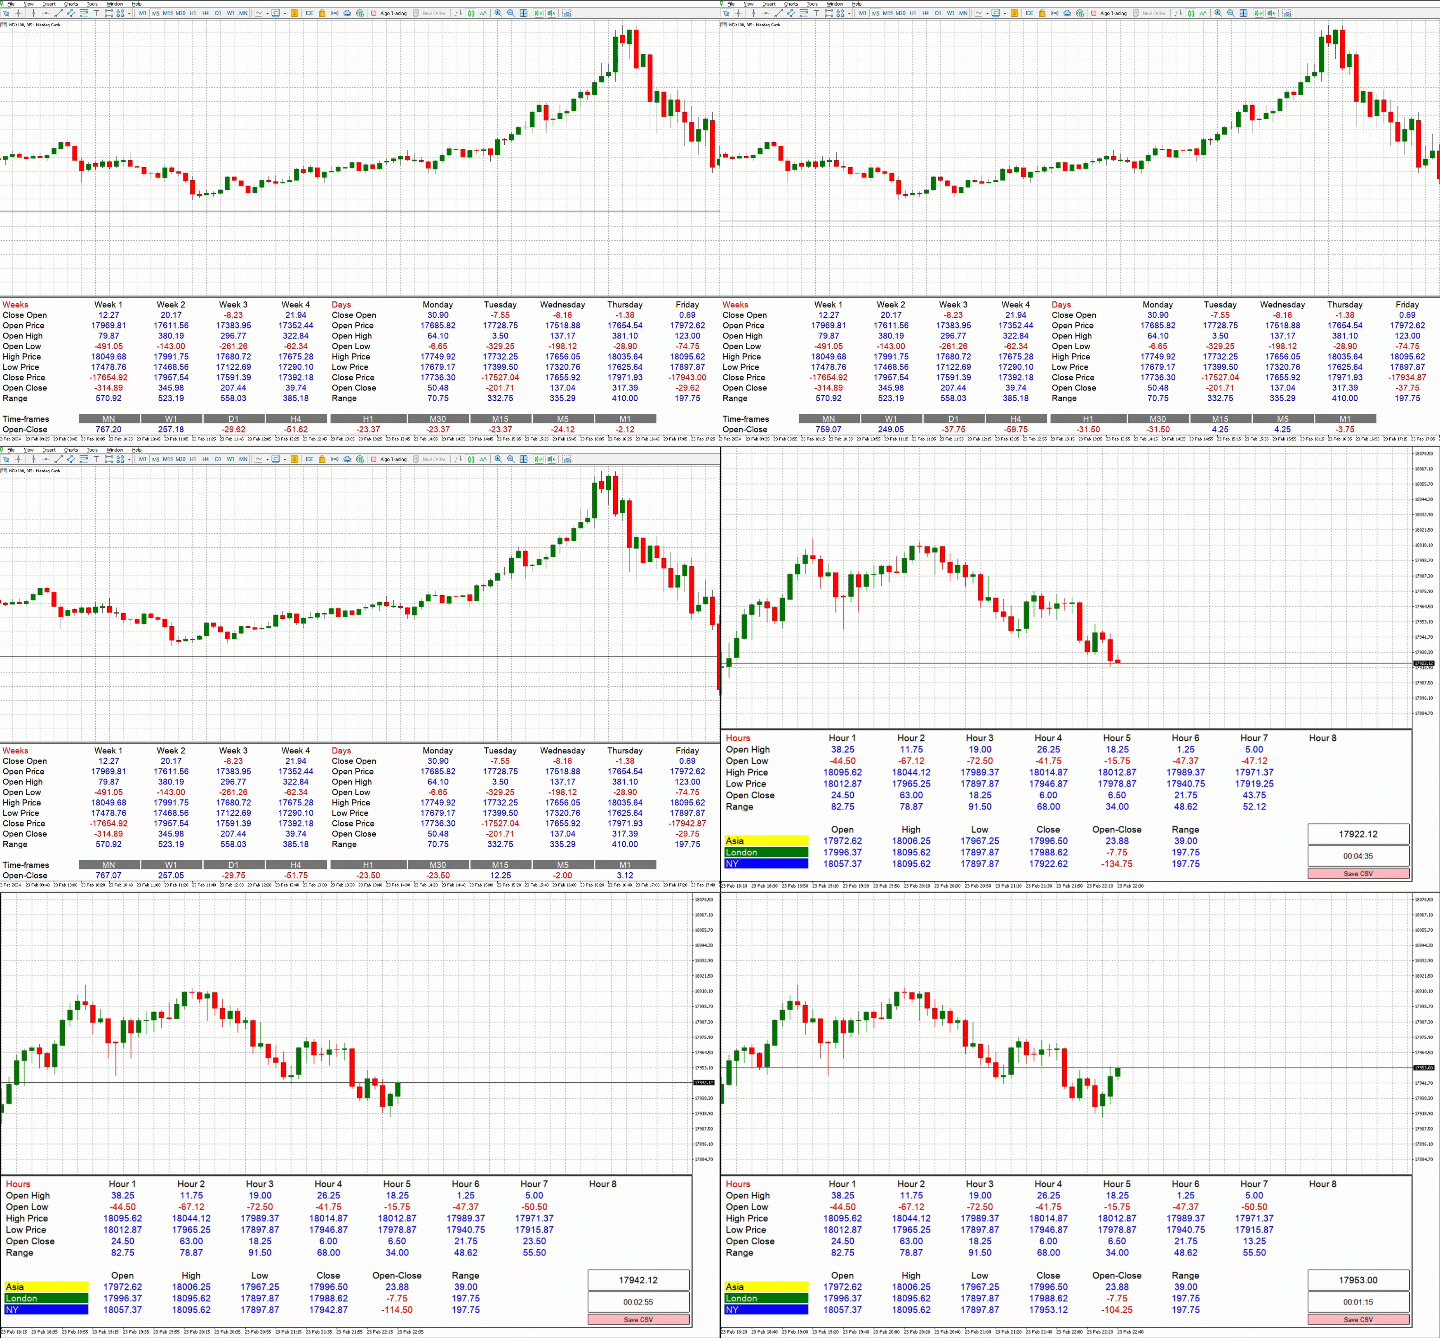
The Chart Clarity Dashboard provides clear insights into price movements for various financial instruments like currency pairs, cryptocurrencies, equities, commodities, and indices. This dashboard displays detailed price information in real-time, making it easier for traders to make decisions quickly. It shows price movements down to the second, giving you essential data before you trade or analyze charts.

Chart Clarity Dashboard allows you to monitor price changes across all time frames and session. Changes in colour of numerical values indicate bullish or bearish momentum, showing whether the price is above or below the open price for the given timeframe.

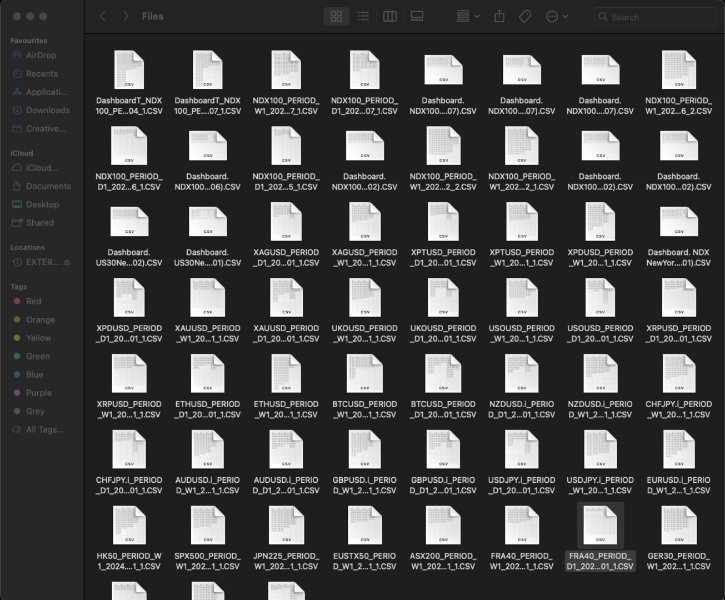
The dashboard also saves daily activity as a CSV file within an internal folder on MT4, making historical data easily accessible for future analysis. Please refer to our attached YouTube video for valuable insights into the functionality and detailed breakdown of how the Chart Clarity Dashboard presents essential information, assisting traders view charts with clarity.

Key Features

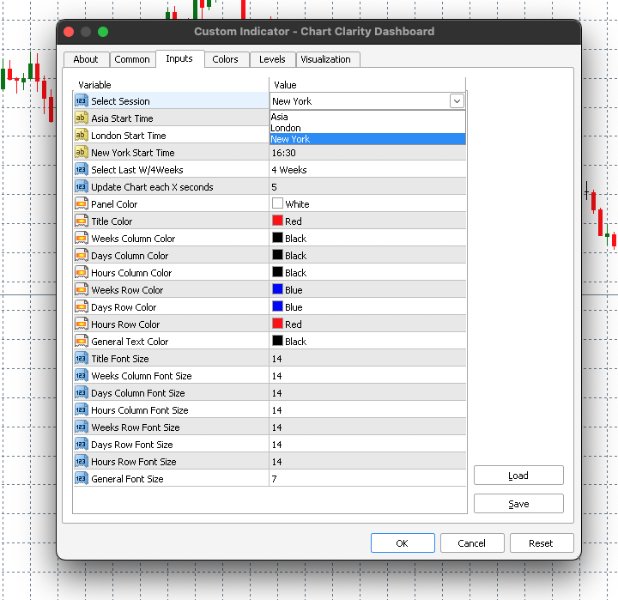
  • Analyze price action during the Asia, London, and New York trading sessions.
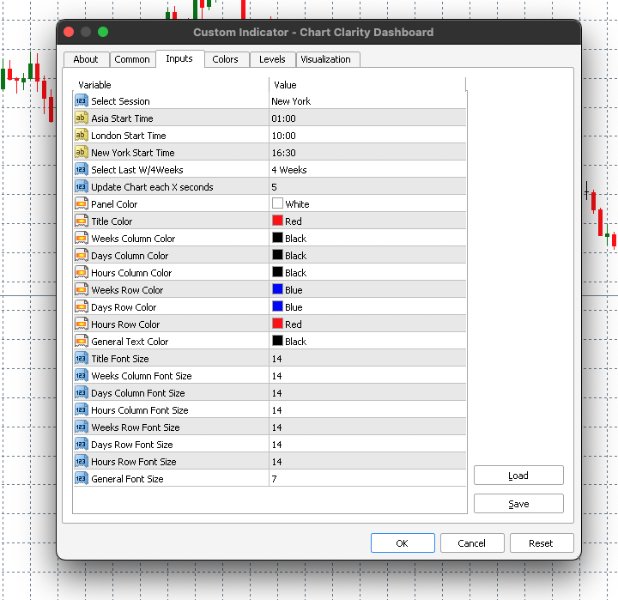
  • Adjust the timing for the Asia, London, and New York trading sessions manually, according to your country's time zone.
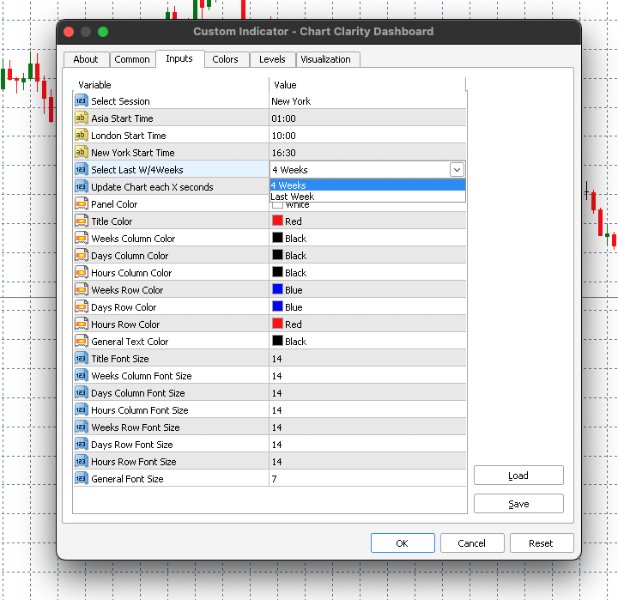
  • Review price action for the current week, last week and last month.
  • Track price action for the entire month down to the present second.
  • Monitor price action hourly, across all trading sessions.
  • View dynamic price action across all time frames and trading sessions in one place.
  • View Candle close countdown timer specific to your trading time frame.
  • Save daily trading activity in a CSV file for future reference or chart analysis.
  • Experience real-time updates.
  • Quickly visualize bullish or bearish momentum from market open, through colour representation of numerical values.
  • Offers an intuitive interface for easy interpretation and analysis of incoming data.
  • Displays fluctuations in trading activity throughout different hours of the trading session, identifying hours with concentrated trading activity.
  • Visual representation of patterns in price action such as spikes, divergences or trends to to assist in making trading decisions.
  • Can be used in conjunction with other technical indicators for comprehensive market analysis.
  • Enables users to analyze historical price action to identify past trading patterns and trends for chart analysis.
  • Allows users to personalize settings such as font colour, session selection, and time periods.

Pricing

We have set a premium price for our MT4 indicators, reflecting over two years of development, rigorous backtesting, and diligent bug fixing to ensure optimal functionality. Our confidence in the precision and accuracy of our indicators is such that we regularly showcase them in real-time market conditions through daily content on our social media channels.

Our belief in trading simplicity, adhering to the principle of buying low and selling high, is echoed in our indicators' clear display of potential entry and exit points. We consistently provide daily content demonstrating our indicators in action. Additionally, we offer traders the opportunity to rent our indicators for $66 per month. This allows traders to test the indicator for one month with their chosen trading pair before committing to a yearly subscription.

We are committed to monitoring user feedback closely and making necessary improvements to our indicators should any bugs arise, ensuring that traders have access to the most effective tools for their trading endeavours.

*The attached GIF file showcases a 2.5-hour video of the Chart Clarity Dashboard in action, condensed into a few seconds.

MT5 Version Available: Yes

Currency Pairs: Any

Timeframe: Any

Timezone: Any

Brokers: Any

Account Type: Any

Prop Firms: Yes

Multi-Currency Indicator: Yes

Compatibility: Chart Clarity Dashboard works with currency pairs, indicies, equities, commodities and cryptocurrencies

BLOG: View settings for your selected trading pair CLICK HERE

NOTE: If you need help with settings or have any questions, please feel free to leave a comment in the comment section below. You can also visit our blog where you can leave a comment, and we'll respond promptly. 

Numerical Value Colour Indication

  • Blue Numerical Values - Bullish Momentum: Indicates the price is above the open or positive for the corresponding session or time-frame
  • Red Numerical Values - Bearish Momentum: Indicates the price is below the open or negative for the corresponding session or time-frame, a (-) minus sign will appear next to the price.

Note: Any trading decision made should be based on independent analysis and a thorough understanding of fundamentals, rather than solely relying on the colour of numerical values.


Last Week/ Days

  • Close Open: Difference between close & open price - Price gapping up or gapping down
  • Open price: Opening price for the day
  • Open High: Difference between open price & daily high
  • Open Low: Difference between open price & daily low
  • High Price: Highest price for the day
  • Low Price: Lowest price for the day 
  • Close Price: Close price for the day
  • Range: Difference between the highest and lowest prices of the day 

Sessions

  • Open: Opening price for the session
  • High: Highest price during the session
  • Low: Lowest price during the session
  • Close: Close price for the session
  • Open-Close: Difference between session open price & close price
  • Range: Difference between the highest and lowest prices of the session

Hours

  • Open High: Difference between open price & hourly high,  within the respective session
  • Open Low: Difference between open price & hourly low,  within the respective session
  • High Price: Highest price for the hour,  within the respective session
  • Low Price: Lowest price for the hour,  within the respective session
  • Open Close: Difference between open & close price for the hour,  within the respective session
  • Range: Difference between the highest & lowest prices for the hour, within the respective session

Time-Frames

  • Open - Close: Difference between open & close price within the respective time frame

Extras

  • Price: Current price of trading pair
  • Time: Countdown timer for the next candle formation,  within the respective time frame
  • Save CSV: Save entire day's activity as a CSV file within an internal folder on MT4

Disclaimer

We would like to emphasize that the information provided by seller and its affiliates, including its premium software subscribers, is not intended as financial advice and should not be construed as such. The content and opinions shared in our social media content and premium software subscription are for general informational purposes only, and they do not offer specific advice or recommendations for individuals or entities.

The seller and its affiliates do not endorse or recommend any securities, and our content is not an offer or solicitation to buy or sell any securities. The information provided in our social media content and premium software subscription may not be exhaustive and is subject to change without notice.

It's important to note that our social media content, research, information, and disclosures do not guarantee financial success or profitability. They provide insights into our investment strategies and how we manage our private capital in the financial markets.

Given the inherent risks of financial markets and the fact that past performance does not guarantee future results, we cannot assure specific outcomes or returns. Investing in financial markets carries the risk of loss.

Therefore, we advise conducting your own research and seeking professional advice before making any investment decisions. The information and opinions presented in our social media content and premium software subscription are meant for general informational purposes only and do not constitute specific advice or recommendations for any individual or entity.

By purchasing any premium software subscription, you acknowledge and accept that the seller and its affiliates are not liable for any investment decisions made based on information provided through social media content or premium subscription software.



Рекомендуем также
Enhance your trading strategy with this indicator from tr1cky.com . When the indicator turns red - Hold off When the indicator turns green - Proceed with the trade in the direction indicated by the indicator This indicator provides insights into the market’s momentum and the optimal trading direction. Derived from its successful Expert Advisor counterpart, the RSIMFI100 go indicator is now available to all. Happy trading!
FREE
Представляем Binary Smart System: Ваш идеальный торговый компаньон Binary Smart System — это не просто индикатор, это сложный торговый инструмент, тщательно разработанный для обеспечения трейдеров точными и своевременными сигналами на различных рынках. Основываясь на передовых алгоритмах и обширной коллекции технических индикаторов, эта система является ключом к успеху в торговле. Компоненты индикатора: Процентное значение скользящей средней (MAP) : Этот компонент вычисляет взвешенное среднее зн
Preface: First of all, let me introduce myself. I am a programmer and have been working for over 20 years. 2023 has passed, and our studio has achieved a record of 500 times with 7 manual transmissions. Below, we will show you how to do it through a series of operations. The first step is to model. Modeling is to find a fixed trading pattern. I think everyone has heard of a 2/8 probability, and through this probability, we can further refine it, which means that 1 to 4 is the optimal state. We h
Раскройте всю мощь прибыльной торговли бинарными опционами с индикатором "Eagle Eye" для MT4 Готовьтесь отправиться в уникальное путешествие в мире торговли бинарными опционами с впечатляющим индикатором "Eagle Eye" для MetaTrader 4 (MT4). Этот революционный инструмент готов изменить ваш опыт торговли, наполнив его максимальной точностью и непревзойденной прибыльностью. Войдите в мир, где границы потенциала рушатся, а прибыль максимизируется благодаря непревзойденной точности и надежности индика
NOTE: PRICE WILL RISE VERY SOON. DON'T SKIP THIS OFFER! Dear traders I am glad to introduce the " Market Swing Scanner Board" indicator to you. This indicator was made mainly to be used in combination with the Market Swing Index Indicator. You use the  "Market Swing Scanner Board"  indicator to scan for trading opportunities on the  Market Swing Index Indicator . This tool is designed for serious traders who have decided to make a difference through trading. Be the next person to witness this st
YOU CAN NOW DOWNLOAD FREE VERSIONS OF OUR PAID INDICATORS . IT'S OUR WAY OF GIVING BACK TO THE COMMUNITY ! >>>    GO HERE TO DOWNLOAD   The system is a free open source pine script originally published on TradingView by everget   . It was converted to Mt4 by Forex Robot Makers. This system is a  popular trend indicator based on ATR ( Average True Range ) , Moving Averages and the Donchian channel . System BackGround ATR The average true range is an indicator of the price volatility of an as
FREE
Limitless MT4    - это универсальный индикатор который подойдет каждому как начинающему так и опытному трейдеру работает на всех валютных парах криптовалютах сыре акциях Limitless MT4 - уже настроен и не требует дополнительной настройки   А теперь главное Почему    Limitless MT4 ? 1 полное отсутствие перерисовки  2 два года тестирования лучшими специалистами в трейдинге 3 точность правильных сигналов превышает 80% 4 хорошо показал себя в торговле во время выхода новостей Правила торговли  1 сигн
The sample on the right corner of the chart uses Font Size 20. The characters/numbers will start from the right side/corner of the chart, so that when increase the font size, the text will expand out to the left/top and won't goes to the right/bottom and get hidden.  Able to change these Inputs. a. Other Symbol.  Current chart symbol will always be displayed. b. Fonts. c. Font size. d. Text color (All the text label, local time, bid, ask, spread, lots, number of trades, Margin, Free Margin, Mar
Price Action Scanner is an indicator that identifies price behaviors and provides alerts. This indicator can simultaneously detect signals for up to 6 different symbols across various timeframes. By setting a separator, you can add different symbol names and timeframes. The indicator can detect multiple common signal types such as Pinbar, Engulfing Pattern, Inside Bar, Morning Star, Evening Star, Fakey, and display corresponding information in separate subcharts, indicating the direction of t
Flag Pattern Indicator - Your Guide to Flagging Profitable Trade Setups Welcome to the world of precision trading with the "Flag Pattern Indicator." Designed for MetaTrader, this powerful tool is your go-to solution for identifying one of the most reliable and versatile chart patterns in technical analysis: the flag pattern. Whether you're a seasoned trader or just starting, this indicator simplifies the process of spotting flag patterns, giving you an edge in your trading decisions. Key Feature
FREE
Multi Information Panel designed to give alot more precision to both trade entries and exits and provide an instant snapshot of a currency pair’s movement. Multi Information Panel works on any currency or timeframe (or it should) and displays the following in the bottom right corner of the chart.. A graph of Stochastic Oscillators on timeframes M1 up to D1. An indication of the market trend using EMA’s on timeframes M1 to D1. The direction of the MACD on the current chart, and crossing of the
This is a Multi-currency multi-timeframe Support/Resistance Scanner Dashboard for Metatrader 4 (MT4) platform. Get all extras and download free demo here: https://abiroid.com/product/abiroid-support-resistance-scanner Read detailed description in post above. Features: Scan Support/Resistance zones (also called Supply/Demand zones) Show alert when price is inside these zones and highlights the pair/timeframe Show or hide SR zones price nearest to current price (Price_Close) Show or hide cur
KT Candlestick Patterns Scanner is a Multi-Symbol and Multi-Timeframe scanner that fetches and shows various candlestick patterns on 28 currency pairs and 9 time-frames concurrently . The scanner finds the candlestick patterns by loading the KT Candlestick Patterns indicator as a resource in the background. Features The scanner can find the candlestick patterns on 252* combinations of symbols and time-frames from a single chart. Open the signal's chart loaded with a predefined template with
It works around the clock, completely in automatic mode and does not require special settings. ********It is a PORTFOLIO of different strategies all trading together at the same time.******* BTC Break Free  trades on all trading accounts and symbols, as well as all time frames. I recommend using it for   BTCUSD   and   EURUSD . For large accounts, I recommend using the 1-Very Low risk mode. Minimum deposit of $1000, recommended $ 2000 and above. Leverage 1:25 - 1:500. For small deposits 1:50
Signal Aggregator
Algoritmic Capital, Ltd.
4.87 (15)
Optimized set files for 23 currency pairs -  H1 SET FILES  , for 17 currency pairs -  M15 SET FILES  , for 18 currency pairs -  H4 SET FILES . You can read detail manual for learn how trade -  MANUAL   . For clients we have ready GIFT -  UTILITY SIGNAL AGGREGATOR . Contact us to private message with purchase number.  But only clients with Lifetime version of SIGNAL AGGREGATOR.  Utility will manage to you open positions base on Indicator rules. SIGNAL AGGREGATOR  - is not just an indicator which
This EA is an extension for the free trade indicator Trend Mate . https://www.mql5.com/en/market/product/50082 The main idea is to support your decision to  trade  according to the current trend. It is possible to configure alert and push notification to receive when entering to first candle for bull / bear trend. For this extension of the free indicator now it is possible to filter the current trend info with other timeframes. For example show trend for timeframe M5 considering also timefra
Black series MT4 - Индикатор предназначен для торговли на бинарных опционах с Tаймфреймом М1-M5-M15 Мультивалютный (Работает на криптовалюте и на валютных парах) Сигнал появляется при открытии свечи До 90% верных сигналов Полностью отсутствует перерисовка сигналов  Можно использовать с другими индикаторами. Хороший для скальпинга! В Настройках есть: -Методы работы индикатора -И Аллерт Цвет стрелок Красный сигнал вниз Синий сигнал вверх Так же смотрите видео как работает индикатор и появляются си
Price Action Scanner Pro is an indicator that identifies price behaviors and provides alerts, offering more features and customization compared to Price Action Scanner   (  https://www.mql5.com/zh/market/product/118937?source=Site+Profile+Seller   )   . This indicator can simultaneously detect signals for up to 15 symbols across different timeframes. You can configure it to detect signals during specific trading sessions such as Asian, European, and US sessions, using different timeframes. This
Heikin-Ashi-Sniper is a perfect addition to your portfolio. This is the second part of the Portfolio. It is meant to be traded on GBPUSD on H1 Timeframe. It uses Bollinger Bands to determine optimal entry signals while having a reasonably low drawdown Each Expert of our portfolio uses a different technique to minimize curve fitting and diversify the strategy. More EA´s will be published shortly to complete the Portfolio. The EA Trades not very frequently it waits for the right chance and place
Everyday trading represents a battle of buyers ("Bulls") pushing prices up and sellers ("Bears") pushing prices down. Depending on what party scores off, the day will end with a price that is higher or lower than that of the previous day. Intermediate results, first of all the highest and lowest price, allow to judge about how the battle was developing during the day. It is very important to be able to estimate the Bears Power balance since changes in this balance initially signalize about possi
Автоматические линии тренда, с push, email и звуковыми оповещениями. Вид линий (цвет, толщина, тип) отражает историю их взаимодействия с ценой: отскок, пробой, отскок после пробоя, количество отскоков, двойной пробой. Оповещения информируют пользователя об этих событиях. Пользователь может редактировать линии (корректировать, перетаскивать, удалять) и настраивать систему линий, не выгружая индикатор. Для полноценного использования индикатора рекомендуется ознакомиться с руководством в 5-минутном
This indicator plots in the candles the divergence found in the selected indicator and can also send a notification by email and / or to the cell phone. Works on all TIMEFRAMES. Meet Our Products   He identifies the divergences in the indicators: Relative Strength Index (RSI); Moving Average Convergence and Divergence (MACD); Volume Balance (OBV) and;. iStochastic Stochastic Oscillator  (STOCHASTIC). It is possible to choose the amplitude for checking the divergence and the indicator has
FREE
Trade with super Support and Resistance Breakout system. are you looking for the most sophisticated tools for your daily trading ? this tools are perfect for you, it has a most comprehensive breakout identification spot on all market (Forex, CFD, indice, etc) Limited offer :  10 copy for 30$ Indicator parameter: Depth: to arrange how deep to calculates the support and resistance zone Deviation Back-step the demonstration result you can see on the media file below.
Индикатор Trends Trg определяет господствующую тенденци. Они помогает анализировать рынок на выбранном временном интервалею. Прост в настройке и работает на всех парах и всех временных интервалах. Индикаторы тренда дают возможность классифицировать направление ценового движения, определив его силу. Решение этой проблемы помогает инвесторам вовремя войти в рынок и получить хорошую отдачу.  Для любого трейдера крайне важно правильно определить направление и силу трендового движения. К сожалению
ToolBox 360 is the swiss knife of all indicators. It is full packed with useful tools to help you with your trading. It can be used to find best entry and exit points and help you to decide if you should open a trade or not. It shows market trends, candlestick formations outside / inside bars and you can sett time based allerts. Main features: Time based Fibonacci lines Choose a start and end time and the indicator shows you Fibonacci lines within the selected time range including range high
We Trade Live Trend Candle Stick can help identify potential trend in the market when  trading, spot market trends and predict future prices.  We Trade Live Trend Candle Stick has a smoother look, as it is essentially taking an average of the movement.   candles will  stay RED during a downtrend and Green during an uptrend . We believe It's useful for making candlestick charts more readable and trends easier to analyse. As a breakout trader you are looking for trades that are ‘breaking out’ of
FREE
IMPORTANT; Price is subject to rise at any time from now! Do not miss this offer! Dear trader I am glad to introduce my new tool called Trend Analyser Dashboard to you. The design, style, and settings of this indicator  have been made simple to make its users not take too much time in understanding the indicator itself.   The purpose is to help traders in analysing the direction of the major trend and the status of the trend whether in weak trend or its strong trend. The indicator will also prov
Percentage
Luis Alberto Atuncar Sanchez
Daily Percentage and Current Candle Would you like to know how much an asset has risen or fallen in a day or in the last candle? Do you want a numerical reference for the strength and direction of price movement? Then, the Daily Percentage and Current Candle indicator is the tool you need. The Daily Percentage and Current Candle indicator shows you the percentage increase or decrease of an asset in the current day or in the last candle, depending on the timeframe you choose. The indicator allows
FREE
Quantina Multi Indicator Reader может быстро анализировать до 12 наиболее популярных и часто используемых совместно индикаторов, работающих на любом таймфрейме, на любых валютных парах, акциях или индексах. На панели на графика отображаются значения по умолчанию каждого индикатора, а также итоговое значение по всем индикаторам. Особенности Только один файл: индикатор Quantina Multi Indicator Reader состоит из единственного файла. Для работы не требует установки других индикаторов. Использует в
ReboltP
David Theodore Caro-greene
Rebalance Overlay Technology (Rebolt) enables the trader to visualize the flow of money from one chart to another chart. Rebolt Probability indicates the probability that money has flowed from one chart to another chart for a specified length of time over a number of intervals specified by the user. When Rebolt reads Cyan or Blue these are buying signs good for the length of time specified by the user or until a conflicting signal arises. When Rebolt reads Violet or Red there are selling signs
С этим продуктом покупают
Full Forex Market View Dashboard
Opengates Success International
5 (2)
ПОЛНЫЙ ОБЗОР РЫНКА FOREX Индикатор приборной панели Это пользовательский индикатор, созданный, чтобы дать трейдерам полное представление о том, что происходит на рынке. Он использует данные в режиме реального времени для доступа к рынку и отображения каждого бита информации, необходимой для успешной торговли. МОНТАЖ: Прежде чем прикреплять этот индикатор к оконному графику, перейдите на панель «Обзор рынка» вашего MT4 и СКРЫТЬ все валютные пары, которые вам не нужны или которыми вы торг
Представляем удивительный форекс-индикатор "Miraculous": раскройте силу точного трейдинга Вы устали от бесконечного поиска лучшего форекс-индикатора, который действительно доставляет исключительные результаты на всех таймфреймах? Не ищите дальше! Представляем вам форекс-индикатор "Miraculous", который пришел, чтобы изменить ваш опыт трейдинга и поднять ваши прибыли на новый уровень. Основанный на передовых технологиях и годам тщательной разработки, форекс-индикатор "Miraculous" является вершиной
IA Trendx3 PRO
Marco Aurelio Santos Costa
Что если бы Бог создал торговую систему? Без чудес... Просто посмотрите, как математика может быть эффективной на рынке. Нам удалось объединить технический анализ / ценовое движение в индикаторы, создав лучшую настройку для торговли, будь то на рынке Forex, индексах или акциях. Нам понадобилось 2 года, чтобы создать что-то, что действительно работает, и теперь пришло время вам это открыть. TrendX3 - это революция в анализе трендов. На основе передовых алгоритмов и данных в реальном времени он пр
The indicator of a Professional Trader - это стрелочный индикатор для прогнозирования направления движения цены. Над этим индикатором я работаю с 2014 года.  Вы можете использовать этот индикатор в качестве основного, использовать его сигналы для входа и использовать его в качестве единственного индикатора для поиска точек входа. О продукте: Рекомендуемый TF [H4-D1-W1] . Индикатор предсказывает направление движения следующей свечи.  Подходят множество инструментов; Гибкость в настройках под
Это индикатор за самые большие деньги. Он обладает исключительными характеристиками. Какой бы интерес ни был на рынке, вы увидите его.  Почти во всех случаях он дает вам только долгосрочный взгляд на рынок, но не обманывайтесь, думая, что он привязан к событиям. Ничего подобного. Он находит, где на рынке находится наибольший интерес, и показывает его вам. Не забывайте, что самые большие деньги (проценты) не отображаются на рынке каждый день. Это то, с чем вы еще не сталкивались. Цена разумная
The breakout algorithm is a technique based on price, price features, to shape a breakout strategy. The strategy in this indicator will not be redrawn (none-repaint indicator), it is suitable for short or long term traders In the screenshot is the EURUSD pair, these currency pairs, commodities or stocks, it have similar strength *Non-Repainting (not redrawn) *For Metatrader4 Only *Great For Scalping *Great For Swing Trading *Arrow Entry, Green is Long, Red is Short *Works On Any Timeframe *Work
WARNING: PRICE IS SUBJECT TO RISE AT ANY TIME. GET YOUR COPY TODAY TO AVOID MORE COST! Dear Traders I am so glad to introduce to you my other tool called the Forex Sniper Entries Indicator. This tool is designed to help serious traders and investors capture big moves in the currency price movements. The philosophy behind this tool is all about winning big and riding the price movement from its beginning until the maximum point. We want to capture those big moves in both down and up markets as mu
"Dragon's Tail" представляет собой интегрированную торговую систему, а не просто индикатор. Эта система анализирует каждую свечу по минутам, что особенно эффективно в условиях высокой волатильности рынка. Система "Dragon's Tail" определяет ключевые моменты на рынке, обозначенные как "сражения быков и медведей". Основываясь на этих "сражениях", система дает рекомендации по направлению сделки. В случае появления стрелки на графике, это сигнализирует о возможности открытия двух сделок в указанном н
WARNING!! THIS SWORD IS TOO SHARP!    ONLY 10 COPIES LEFT FOR THE NEXT PRICE TO BE 8,000$ FOR UNLIMITED PLAN. Dear traders I am very glad once again to introduce to you my other tool called "Forex Sword Indicator". In short this tool is meant to give you an edge over the market that you have been waiting for  so long. Now, here it is. It is a very very simple tool but yet a dangerous sword. I call it a  Holy grail indicator!. I will not talk a lot about this tool. Just let the tool speak by itse
MT My Way
Issara Seeboonrueang
Best strategy,  Easy trade ,  Support of version update in the future MT My Way:  For new traders with no experience It is a very simple trade. Open the order when there is signal and close the order when there is exit or found the next opposite signal. You can set Stop Loss at the arrow and set the distance at Arrow Gap. For experienced traders, It will be very easy to trade. indicator for trade by yourself TRADE: Forex TIME FRAME:  All Time Frame (Not M1) SYMBOL PAIR: All Sym
Idea: RSI ( Relative Strength Index) and CCI ( Commodity Channel Index ) are powerfull to solved the market.  This indicator has Smoothed Algorithmic signal of RSI and CCI. So that, it separates the market into buy and sell zones, these areas are marked with arrows, red for downtrend, green for uptrend. This algorithm has the effect of predicting the next trend based on the historical trend, so users need to be cautious when the trend has gone many candles. Please visit screenshots
Weddell Pro хороший торговый инструмент который подойдет как для новичка так и для опытного трейдера. С ним можно работать как отдельно так и совмещать с другими стратегиями и индикаторами Настроен для валютных пар несколько раз тестировался на криптовалюте но высокого результата не показал Валютные пары USD/EUR AUD/CAD GBP/USD Очень хорошо себя тут показал Процент правильных сделок выше 68% что не делает его идеальным и плохим Не рисует и не пропадает Красная стрелка показывает сделку на низ  С
VTrende Pro MT4 - МТФ индикатор для трендовой торговли с панелью индикации для МТ5 !!! - Подробное описание на русском языке под видео (на Youtube) - !!! Хотя сигналы индикатора VTrende Pro можно использовать, как сигналы полноценной торговой системы, рекомендуется применять их в связке с ТС Билла Вильямса. VTrende Pro MT4 - это расширенная версия индикатора VTrende . Отличие Pro версии от VTrende: - Временные зоны - Сигнал V - сигнал 1-2 волн Основная задача индикатора - определить т
Скачайте индикатор уровней поддержки и сопротивления( Support and resistance ). Индикатор рисует горизонтальные и трендовые уровни поддержки и сопротивления. Настройки индикатора: Trends - Установка режима отображения трендовых или горизонтальных уровней поддержки сопротивления Yes - отображает только трендовые уровни No - отображает только горизонтальные уровни UseResource - Установка режима использования встроенных в индикатор ресурсов. Yes - использовать индикатор ZigZag из ресурсов продукта.
Торговая система для ручной торговли The [GRAFF] III основана на многочисленных индикаторах MetaTrader (MT4). Собранные вместе, эти индикаторы представляют собой эффективный торговый инструмент. Система включает в себя более 20 различных пользовательских индикаторов, которые были тщательно отобраны и протестированы на длительном историческом периоде. Каждый конкретный индикатор основан на той или иной формуле расчета. Таким образом вся система настроена таким образом, чтобы отсеивать ложные сигн
Данный индикатор используется для определения тренда. В нем применяется классический индикатор OSMA. Оснащен системой оповещений: звуковые сигналы, оповещения на электронную почту и три типа алертов, включая отправку сообщений на мобильный телефон. Лучшие результаты были получены на 5-минутном графике. Система оповещений активируется при достижении трендом установленного значения. Работает на Форекс с CFD и другими инструментами. СИГНАЛЫ НА ПОКУПКУ НА ПАРЕ EURUSD M5 https://www.mql5.com/ru/chart
Данный индикатор используется для определения тренда. Используются три скользящие средние и ADX. Оснащен системой оповещений: звуковые сигналы, оповещения на электронную почту и три типа алертов, включая отправку сообщений на мобильный телефон. Наилучший результат зафиксирован на M5. Система оповещений активируется при достижении трендом установленного значения. Индикатор работает только с CFD. Входные параметры SoundAlarm = true - звуковое оповещение Sendmail=true - отправка уведомления о сиг
Данный индикатор используется для определения тренда. Используются три скользящие средние и ADX. Оснащен системой оповещений: звуковые сигналы, оповещения на электронную почту и три типа алертов, включая отправку сообщений на мобильный телефон. Наилучший результат зафиксирован на M5. Система оповещений активируется при достижении трендом установленного значения. Индикатор работает только с Forex-символами. Входные параметры SoundAlarm = true - звуковое оповещение Sendmail=true - отправка уведо
Данный индикатор используется для определения тренда. Используется стандартный индикатор MACD. Оснащен системой оповещений: звуковые сигналы, оповещения на электронную почту и три типа алертов, включая отправку сообщений на мобильный телефон. Лучшие результаты были получены на 5-минутном графике. Система оповещений активируется при достижении трендом установленного значения. Работает на Форекс с CFD и другими инструментами. Первое значение - быстрое EMA. Значение по умолчанию 26. Входные парам
Технический индикатор Smooth Price (Гладкая цена) используется для построения гладкой линии максимально приближенной к цене торгового инструмента и служит для устранения ее шумовых составляющих. Индикатор является частью торговой системы Monarch, но здесь он представлен как самостоятельный инструмент технического анализа. Основой индикатора служит кластерный цифровой фильтр , который, в отличии от проекта ClusterSMA , применяется непосредственно к ценовой таймсерии. Smooth Price не перерисовывае
Этот индикатор предлагает солидный метод анализа рынка, основанный на концепции 'Инструмента регрессионного канала'. Путем использования этого инструмента трейдеры могут получить исключительный контроль над регрессионным каналом своего графика, что позволяет принимать более обоснованные торговые решения. Инструмент регрессионного канала является мощным инструментом в арсенале трейдера. Он разработан для предоставления ценной информации о тенденциях цен и потенциальных уровнях поддержки и сопроти
Green Wall Arrows достигает большого количества TP, изменяя идею о неиспользовании SL как чего-то плохого. Вместо этого применяется небольшой TP, большой размер свободных средств и терпение. Для торговли при помощи этого индикатора на Форекс используйте микор-TP и большой размер свободных средств. Возможно его применение и на бинарных опционах. Эта стратегия предназначена для торговли в ручном режиме. Этот индикатор работает на открытии бара, стрелки будут удаляться, если цена пойдет против них.
Golden Monowave - индикатор моноволн. Теория моноволн - это один из подходов волновой теории Эллиотта, и один из наиболее сложных и точных методов. Golden Monowave может сократить много крупных шагов для определения и описания моноволны. Он работает на любом таймфрейме и с любым торговым инструментом, включая валюты, индексы, фьючерсы и так далее. Входные параметры initial_Bars - начальное количество баров для вычисления. wave_color - цвет волны. label_color - цвет меток. temp_label_color - цв
Индикатор отображает в отдельном окне разность между количеством пунктов, которые увеличили цену, и количеством пунктов, которые уменьшили цену за заданный в настройках интервал времени. Временной интервал, за который проводится расчет, выражается в количестве баров графика, на который индикатор прикреплен. Данный подход позволяет оценить в какую сторону (рост или падение) движется цена инструмента, силу движения и величину движения в пунктах. В работе индикатор использует только тики поступающи
NostradamusMT4
Andrey Spiridonov
1 (1)
NostradamusMT4 - мощный индикатор из набора профессионального трейдера. В основе индикатора лежит авторский метод Андрея Спиридонова расчета цены (ESTIMATED PRICE) для текущей цены свечи. Преимущества Индикатор не перерисовывается; Работает на любых временных интервалах; Работает с любыми торговыми инструментами; Отлично подходит для скальпинга и торговли бинарными опционами. Параметры Color - цвет линии ESTIMATED PRICE FUTURE . Порядок работы с индикатором Индикатор формирует расчетную ц
BinaryIndicator - высокоточный индикатор для торговли бинарными опционами. Отличные результаты показывает при скальпинге. Основу данного индикатора составляет многофакторный анализ трендовых индикаторов, а также подтверждающих осцилляторов, что в итоге дает повышенную точность сигналов. Преимущества индикатора Повышенная точность сигналов; Показывает отличные результаты при торговле бинарными опционами с временем экспирации от M30 до M1 ; Работает на любых временных интервалах; Работает с любы
FutureTrade
Andrey Spiridonov
2.33 (3)
FutureTrade - один из немногих индикаторов, который делает прогноз цены прямо на ценовом графике. Алгоритм расчета индикатора основан на быстром преобразовании Фурье. Имея колебательное поведение цены, функция Фурье прогнозирует ее поведение в дальнейшем. Индикатор устанавливается обычным образом на график с торговым инструментом указанным в переменной symbol с периодом M15 , данный временной период является самым оптимальным для работы с любыми торговыми символами. После установки, индикатор ра
xCalper Triad работает в качестве инструмента для распознавания целевых уровней. Его алгоритм мгновенно рассчитывает области ценовых уровней с высокой точностью. По умолчанию, они распознаются автоматически , а трейдер обычно устанавливает только параметры визуализации. Изучите новую перспективу в анализе ценового действия, добавив Triad в вашу систему, и удивите себя. Основные характеристики Автоматические и эксклюзивные целевые уровни Отображение дневной свечи на всех внутридневных таймфрейм
BinaryScalping - профессиональный индикатор для торговли бинарными опционами и скальпинга. Алгоритм работы индикатора основан на расчете опорных точек ( Pivot) для каждого временного периода отдельно, анализируется расположение цены торгового инструмента относительно опорных точек и вычисляется вероятность совершения торговой операции. В индикатор встроен фильтр торговых сигналов по глобальному тренду. Индикатор устанавливается обычным образом и работает с любым торговым инструментом. На графике
Другие продукты этого автора
Liquidity Pro The Liquidity Pro pin points liquidity zones in any financial instrument, including currency pairs, cryptocurrencies, commodities, equities and indices. The Liquidity Pro shows previous and current liquidity zones, down to the present minute, providing essential information about your chosen trading pair, when conducting chart analysis or initiating trades. Remember each trading pair requires a different price separation value for M5, M15 and M30 Tally, to provide accurate data. Y
Volume Clarity Pro The Volume Clarity Pro provides clarity in the movement of price for any financial instrument, including currency pairs, cryptocurrencies, equities, commodities and indices. The Volume Clarity Pro maps out where price is consolidating, retracing, resisting or settled in areas of support. The Volume Clarity Pro accurately displays the month's price action, offering crucial data about your selected trading pair for chart analysis and trade initiation.  The Volume Clarity Pro is
Liquidity Pro The Liquidity Pro pin points liquidity zones in any financial instrument, including currency pairs, cryptocurrencies, commodities, equities and indices. The Liquidity Pro shows previous and current liquidity zones, down to the present minute, providing essential information about your chosen trading pair, when conducting chart analysis or initiating trades. The Liquidity Pro allows you to observe where price consolidates, retraces, resists, or settles within support areas. It pinp
Chart Clarity Dashboard The Chart Clarity Dashboard provides clear insights into price movements for various financial instruments like currency pairs, cryptocurrencies, equities, commodities, and indices. This dashboard displays detailed price information in real-time, making it easier for traders to make decisions quickly. It shows price movements down to the second, giving you essential data before you trade or analyze charts. Chart Clarity Dashboard allows you to monitor price changes acr
Volume Clarity Pro The Volume Clarity Pro provides clarity in the movement of price for any financial instrument, including currency pairs, cryptocurrencies, equities, commodities and indices. The Volume Clarity Pro maps out where price is consolidating, retracing, resisting or settled in areas of support. The Volume Clarity Pro accurately displays the month's price action, offering crucial data about your selected trading pair for chart analysis and trade initiation.  The Volume Clarity Pro is
Фильтр:
Нет отзывов
Ответ на отзыв