• Обзор
  • Отзывы (1)
  • Обсуждение (2)
  • Что нового

RVi Oscillator Breakout

5

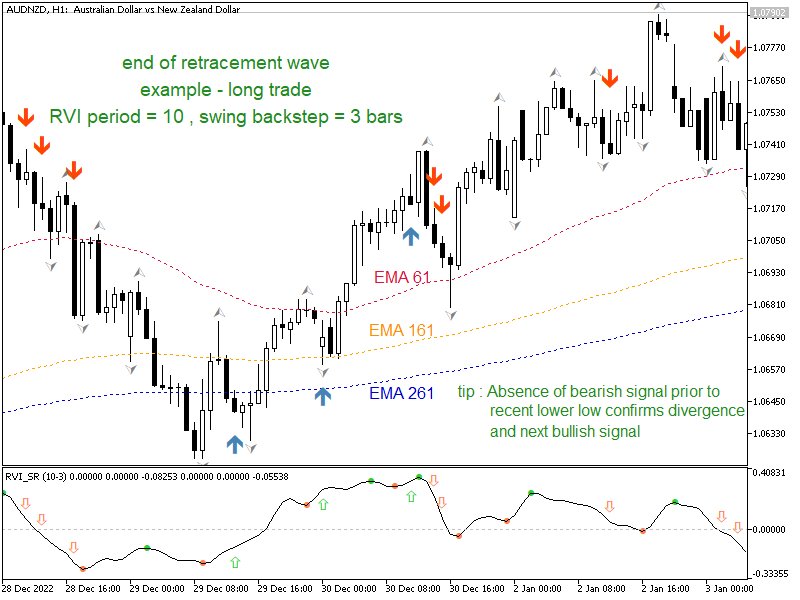
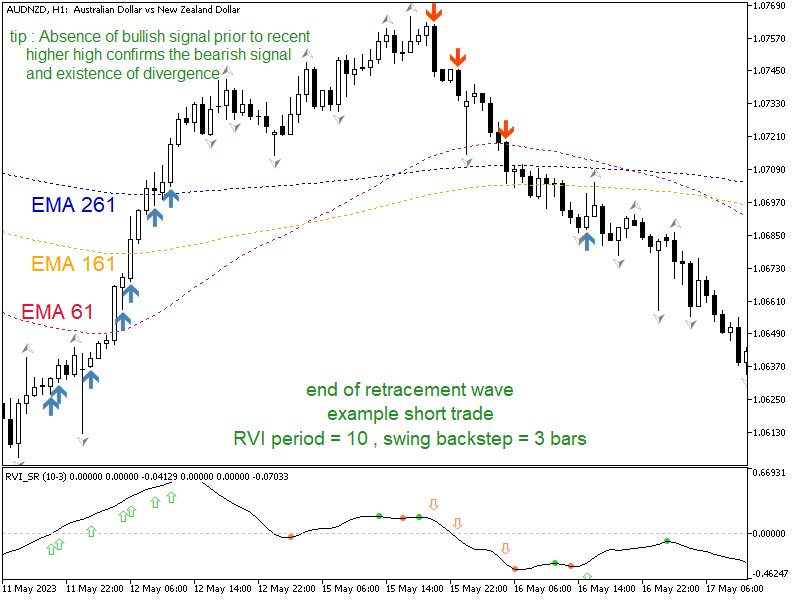
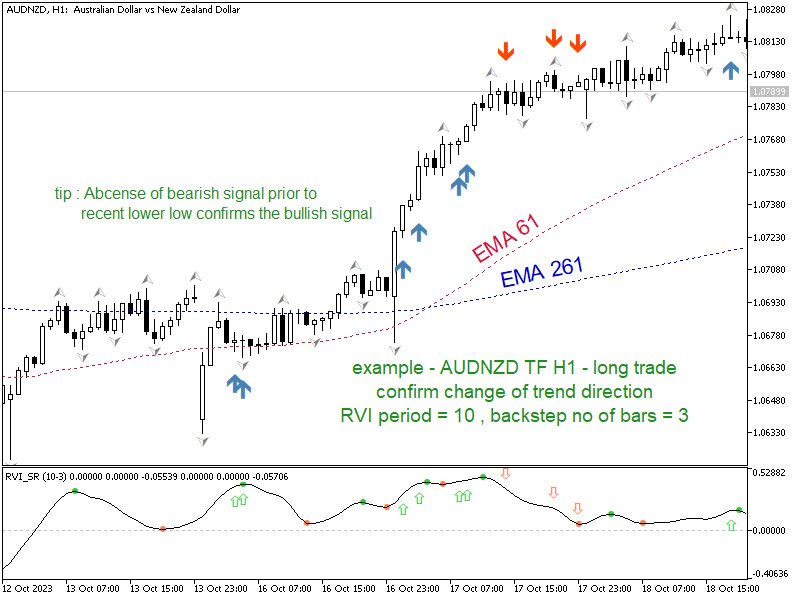
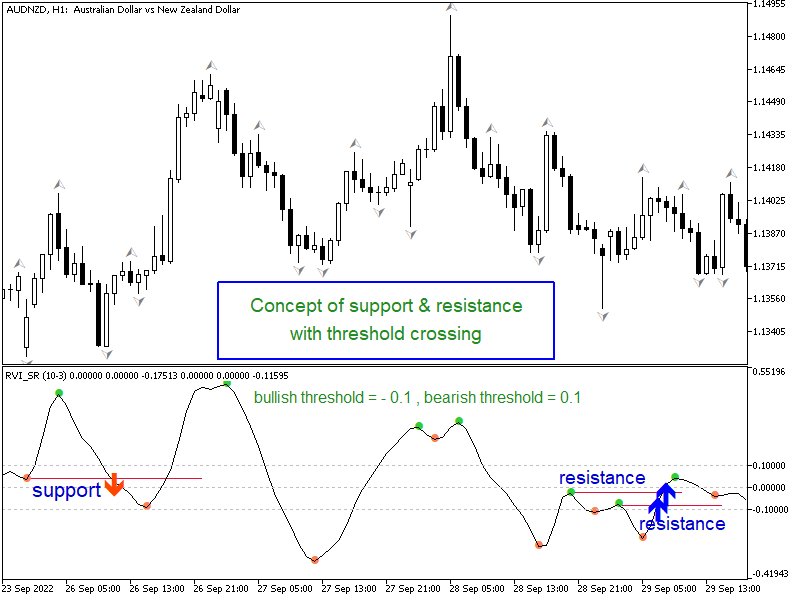
Probability emerges to record higher prices when RVi breaks out oscillator historical resistance level. It's strongly encouraged to confirm price breakout with oscillator breakout since they have comparable effects to price breaking support and resistance levels; surely, short trades will have the same perception.

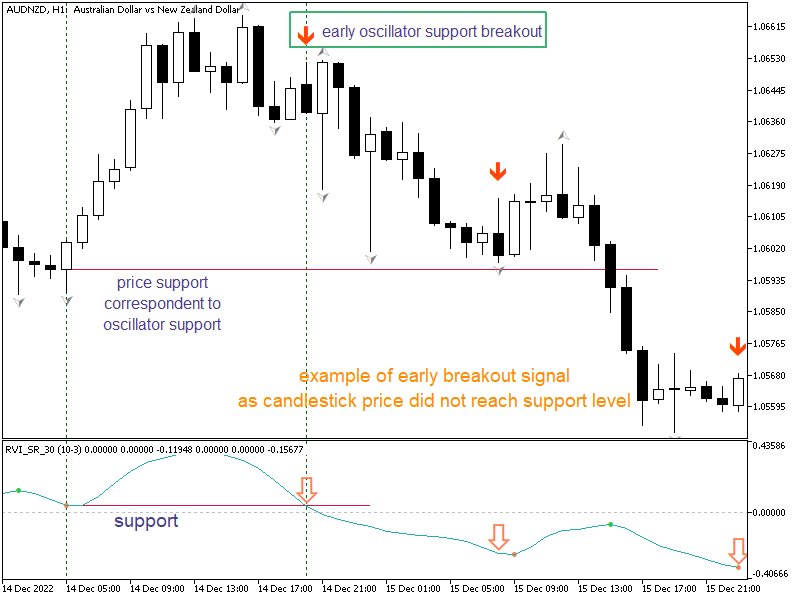
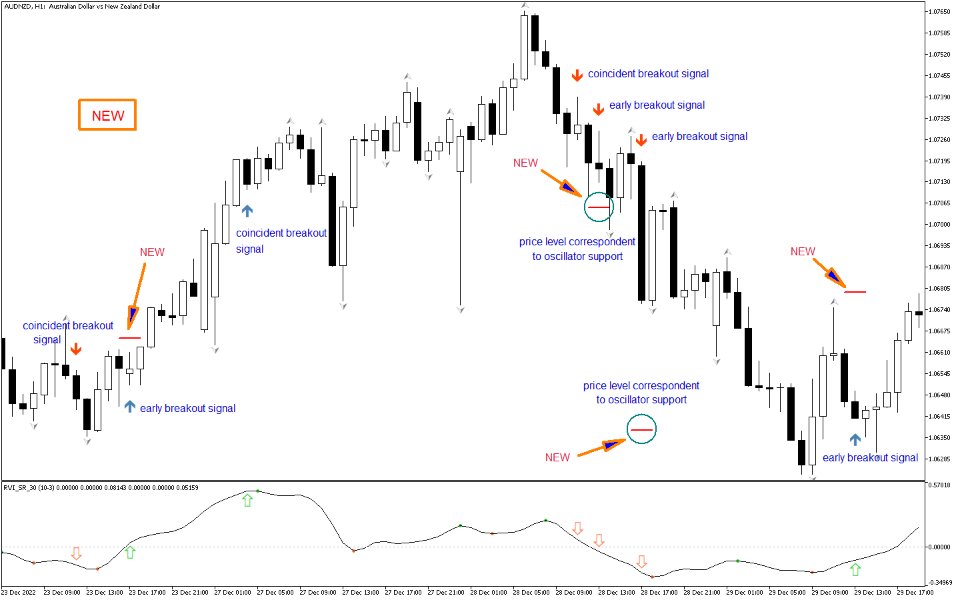
As advantage, a lot of times oscillator breakout precedes price breakout as early alert to upcoming event as illustrated by last screenshot. Furthermore, divergence is confirmed in case of absence of continuation signal prior to highest high or lowest low and reversal signal is encountered.

Thresholds have been provided to utilize if required, but remember to disable when looking for the earliest reversal signal.

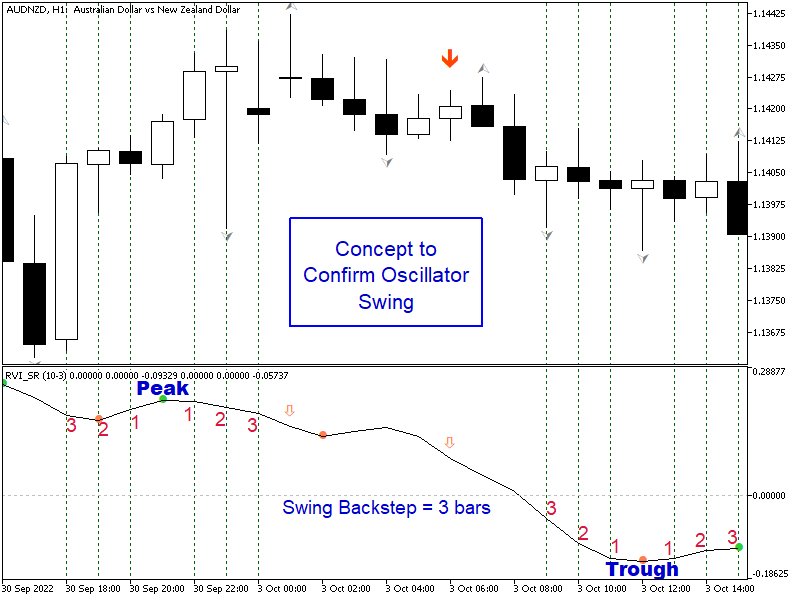
Concept is based on find swing levels which based on number of bars by each side of peak or trough - as mentioned by the fourth screenshot - and in turn subjected to change by indicator settings "swing backstep".

Indicator signals are shown only on chart window; separate window shown by screenshots depicted only for illustration purpose; however, in case of desire to have signals displayed in separate window, pertained indicator could be found at https://www.mql5.com/en/market/product/117795/

Indicator recommended to be used coinciding with other indicators for price support and resistance, supply & demand zones, and/or trend indicator/s

Having desire to use the indicator in your EA, consider buffer no 0 for long trades, and buffer no 1 for short trades

indicator setting:

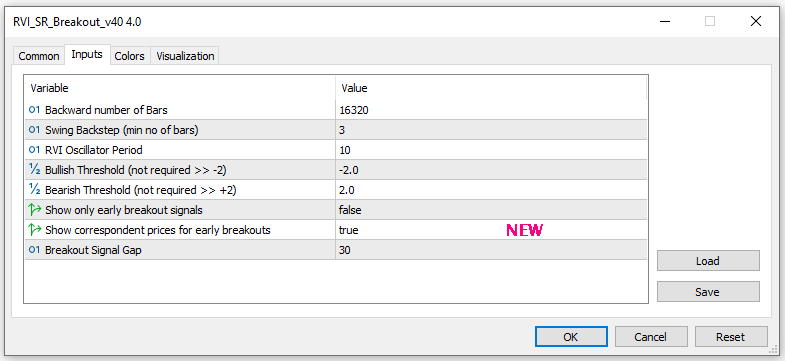
  • Backward number of Bars :  No of backward bars in demand to analyse by indicator
  • Swing Backstep (min no of bars) :  minimum no of bars to form peak or trough by each side
  • RVi Oscillator Period :  No of bars to calculate RVi values
  • Bullish Threshold (if not required >> -2.0) :  minimum RVi value to consider overbought and display signal; having no desire to use threshold and display signals of any breakout, use a very low value (ex. -2.0)
  • Bearish Threshold (if not required >> +2.0) :  maximum RVi value to consider oversold and display signal; having no desire to use threshold and display signals of any breakout, use a very high value (ex. +2)
  • Show only early breakout signals : Only display oscillator breakouts when coincides with delay of price breakout (if required).
  • (NEW) Show correspondent prices for early breakouts : show price levels corresponding to oscillator broken levels
  • Breakout Arrow Gap :  Controls the distance between signal arrow and bar wick

Note:

No indicator will guarantee 100% of wining trades, but trader shall backtest for optimized setting in conjunction with other indicators 

MT4 version available at https://www.mql5.com/en/market/product/120684

Отзывы 1
Newera2023
242
Newera2023 2024.06.14 04:51 
 

Great indicator and functionality. Been using it along with my current system for trading and it is working well.

Рекомендуем также
Free automatic Fibonacci is an indicator that automatically plots a Fibonacci retracement based on the number of bars you select on the BarsToScan setting in the indicator. The Fibonacci is automatically updated in real time as new highest and lowest values appears amongst the selected bars. You can select which level values to be displayed in the indicator settings. You can also select the color of the levels thus enabling the trader to be able to attach the indicator several times with differe
FREE
RVi Oscillator Breakout SW
Mohamed Hassan Mohamed Hassan Alsherbiny
Probability emerges to record higher prices when RVi breaks out oscillator historical resistance level. It's strongly encouraged to confirm price breakout with oscillator breakout since they have comparable effects to price breaking support and resistance levels; surely, short trades will have the same perception. As advantage, a lot of times oscillator breakout precedes price breakout as early alert to upcoming event as illustrated by last screenshot. Furthermore, divergence   is confirmed in
FREE
Ловец трендов: Стратегия Ловец трендов с индикатором оповещения - это универсальный инструмент технического анализа, который помогает трейдерам определять рыночные тренды и потенциальные точки входа и выхода. Он представляет собой динамичную стратегию Ловец трендов, адаптирующуюся к рыночным условиям для четкого визуального представления направления тренда. Трейдеры могут настраивать параметры в соответствии со своими предпочтениями и уровнем риска. Индикатор помогает в идентификации тренда, с
FREE
Necessary for traders: tools and indicators Waves automatically calculate indicators, channel trend trading Perfect trend-wave automatic calculation channel calculation , MT4 Perfect trend-wave automatic calculation channel calculation , MT5 Local Trading copying Easy And Fast Copy , MT4 Easy And Fast Copy , MT5 Local Trading copying For DEMO Easy And Fast Copy , MT4 DEMO Easy And Fast Copy , MT5 DEMO The homeopathic indicator is also called the CCI indicator. The CCI indicator was proposed
FREE
Indicator and Expert Adviser  EA Available in the comments section of this product. Download with Indicator must have indicator installed for EA to work. Mt5 indicator alerts for bollinger band and envelope extremes occurring at the same time. Buy signal alerts occur when A bullish candle has formed below both the lower bollinger band and the lower envelope  Bar must open and close below both these indicators. Sell signal occur when A bear bar is formed above the upper bollinger band and upper
FREE
Follow The Line MT5
Oliver Gideon Amofa Appiah
4.52 (29)
This indicator obeys the popular maxim that: "THE TREND IS YOUR FRIEND" It paints a GREEN line for BUY and also paints a RED line for SELL. (you can change the colors). It gives alarms and alerts of all kinds. IT DOES NOT REPAINT and can be used for all currency pairs and timeframes. Yes, as easy and simple as that. Even a newbie can use it to make great and reliable trades. NB: For best results, get my other premium indicators for more powerful and reliable signals. Get them here: https://www.m
FREE
Мультитаймфреймовый трендовый индикатор, на основе индикатора ADX / ADXWilder c уровнями Фибоначчи Индикатор показывает трендовые участки, используя данные индикатора ADX или ADXWilder с нескольких таймфреймов. Импульсный режим индикатора позволяет поймать начало тренда, а несколько "Экранов" с разными таймфреймами позволяют отфильтровать рыночный шум. На график цены добавляются уровни Фибоначчи, которые имеют гибкие настройки. Принцип работы индикатора: если PDI больше NDI, то устанавливается
FREE
This indicator is an automated version of the Fibonacci retracement (Fib) indicator. Deciding the best areas to use when drawing the fib can be tricky and this  indicator was made with that in mind. When you drop it on the chart it will automatically choose the best points to draw the fib with, but in case you aren't satisfied with those regions, you can adjust it as you wish.
FREE
RSI abcd
Francisco Gomes Da Silva
RSI ABCD Pattern Finder: Technical Strategy 1. How the Indicator Works Combines the classic RSI with automatic detection of ABCD harmonic patterns . Key Components Standard RSI (adjustable period) Peak and Trough Markers (arrows) ABCD Patterns (green/red lines) Overbought (70) and Oversold (30) Filters 2. MT5 Setup period = 14 ; // RSI period size = 4 ; // Maximum pattern size OverBought = 70 ; // Overbought level OverSold = 30 ; // Oversold level Filter = USE_FILTER_ YES ; // Confirmation filte
FREE
Индикатор Haiken Ashi для MT5 Улучшите свой торговый анализ с помощью индикатора Haiken Ashi для MT5. Этот мощный инструмент преобразует стандартные ценовые данные в более плавные, трендовые свечи, что упрощает идентификацию рыночных тенденций и потенциальных точек разворота. Ключевые особенности: Четкая идентификация тренда: Визуально различайте восходящие и нисходящие тренды по различным цветам свечей. Снижение шума: Фильтруйте ценовые колебания, обеспечивая более четкое представление об осно
FREE
Индикатор основан на методике Роберта Майнера, описанной в его книге "Торговые стратегии с высокой вероятностью успеха" и отображает сигналы по моментуму двух таймфреймов. В качестве индикатора моментума используется Стохастический осциллятор.  Настройки говорят сами за себя period_1 - текущий таймфрейма, указывается 'current' period_2 - старший таймфрейм - в 4 или 5 раз больше текущего. Например если текущий 5-мин, то старший будет 20-мин остальные настройки - это настройки Стохастического осци
FREE
RSI divergence indicator finds divergences between price chart and   RSI   indicator and informs you with alerts (popup, mobile notification or email). Its main use is to find trend reversals in the chart. Always use the divergence indicators with other technical assets like support resistance zones, candlestick patterns and price action to have a higher possibility to find trend reversals. Three confirmation type for   RSI   divergences: RSI   line cross 50 level Price returns to previous H/L C
FREE
Dual RSI
Paul Conrad Carlson
3 (1)
Indicator alerts for Dual Relative strength index rsi. Large rsi preset at 14 is below 30 small rsi preset at 4 is below 10 for buy bullish signals . Large rsi preset are 14 is above 70 small rsi preset at 4 is above 90 for sell bearish signals . Includes mobile and terminal alerts. draws lines when alerts. This indicator can help identify extremes and then the tops or bottoms of those extremes .
FREE
Bounce Zone MT5
Nguyen Thanh Cong
4.43 (7)
Introduction The Bounce Zone indicator is a cutting-edge non-repainting technical tool built to identify key areas on the price chart where market sentiment is likely to cause a significant price reversal. Using advanced algorithms and historical price data analysis, this indicator pinpoints potential bounce zones. Combined with other entry signal, this indicator can help forex traders place the best trades possible Signal A possible buy signal is generated when price is in the green zone an
FREE
Об индикаторе: DALA Forecast - универсальный инструмент предсказания динамики временных рядов любой природы. Для предсказания используется модифицированные методы анализа нелинейной динамики, на основе которых строится предсказательная модель с применением методов машинного обучения.  Для получения ознакомительной версии индикатора вы можете связаться со мной в личных сообщениях. Как пользоваться индикатором: Примените индикатор к выбранному вами финансовому интрументу или индикатору с нужными
FREE
Индикатор   Haven FVG   — это инструмент для анализа рынков, который позволяет выделять области неэффективности (Fair Value Gaps, FVG) на графике, предоставляя трейдерам ключевые уровни для анализа цены и принятия торговых решений. Другие продукты ->  ЗДЕСЬ Основные особенности: Индивидуальные настройки цветов: Цвет для бычьего FVG   (Bullish FVG Color). Цвет для медвежьего FVG   (Bearish FVG Color). Гибкая визуализация FVG: Максимальное количество свечей для поиска FVG. Дополнительное удлинени
FREE
Индикатор   "Haven Key Levels PDH PDL"   помогает трейдерам визуализировать ключевые уровни на графике. Он автоматически отмечает следующие уровни: DO (Daily Open)   — уровень открытия дня. NYM (New York Midnight)   — уровень полуночи Нью-Йорка. PDH (Previous Day High)   — максимум предыдущего дня. PDL (Previous Day Low)   — минимум предыдущего дня. WO (Weekly Open)   — уровень открытия недели. MO (Monthly Open)   — уровень открытия месяца. PWH (Previous Week High)   — максимум предыдущей недел
FREE
This indicator is especially for the binary trading. Time frame is 1 minutes and exp time 5 or 3 minutes only. You must be use martingale 3 step. So you must put lots size is 10 % at most. You should use Mt2 trading platform to connect with my indicator to get more signal without human working. This indicator wining rate is over 80% but you may get 100% of profit by using martingale 3 step. You should use MT2 Trading Platform to connect meta trader platform and binary platform . You can get mt2
FREE
Donchian Pro
Paulo Henrique Faquineli Garcia
5 (3)
The Donchian Channel Channels are among the most popular tools of technical analysis, as they visually convey to the analyst the limits within which most price movement tends to occur. Channel users know that valuable information can be obtained at any time, whether prices are in the central region of a band or close to one of the border lines. One of the best known techniques to explore these concepts is Bollinger Bands. However, John Bollinger was not the only one to research the application
FREE
HighLow MT5
Azamat Mullayanov
4 (2)
Индикатор строит две линии по ценам High и Low, соответствующие определенным критериям. Синяя линия - на покупку. Красная линия - на продажу. Сигнал на вход - бар открывается выше\ниже линий. Работает на всех валютных парах и на всех таймфреймах. Можно использовать как готовую торговую систему или как дополнительный сигнал для своей ТС. Входные параметры отсутствуют. Как и полагается любому сигнальному индикатору, на флете использовать его крайне сложно. Нужно повременить с входом, когда цена на
FREE
Haven Volume Profile - это многофункциональный индикатор для анализа объемного профиля, который помогает определять ключевые ценовые уровни на основе распределения объема торгов. Он предназначен для профессиональных трейдеров, желающих более точно понимать рынок и выявлять важные точки для входа и выхода из сделок. Другие продукты ->  ЗДЕСЬ Основные возможности: Расчет Point of Control (POC) - уровня максимальной торговой активности, который позволяет выявить наиболее ликвидные уровни Определени
FREE
ZigZag Support Resistance
Emmanuel Tshepang Mosweu
5 (3)
This indicator uses the Zigzag indicator to identify swing highs and swing lows in the price chart.  Once it has identified the swing highs and swing lows, it can use them to determine potential support and resistance levels. A support level is formed when the price drops and bounces back up from a swing low, indicating that there is buying pressure at that level. A resistance level is formed when the price rises and reverses downward from a swing high, suggesting selling pressure at that level.
FREE
Coral trend is   a trend-following indicator that is widely popular among FOREX traders . It is usually used as a confluence with other indicators. It uses combinations of moving averages with complex smoothing formulas! It has two configurable parameters: Coefficient   - smoothing ratio (*) Applied price Calculation: Coral = (-0.064) * B6 + 0.672 * B5 - 2.352 * B4 + 2.744 * B3
FREE
Peak Trough Analysis - отличный инструмент для обнаружения пиков и впадин на графике. Peak Trough Analysis может использовать три разных алгоритма обнаружения пиков и впадин. Эти три алгоритма включают в себя оригинальный индикатор Fractals Билла Вильямса, модифицированный индикатор Fractals и индикатор ZigZag. Вы можете использовать этот инструмент анализа пиков и впадин для обнаружения паттернов, составленных Равновесным Фрактально-Волновым процессом. Для дальнейшего использования имеется хоро
FREE
Профессиональный инструмент для торговли  - индикатор дивергенции между RSI и ценой, позволяющий своевременно получать сигнал о развороте тренда или ловить движения откатов цены (в зависимости от настроек). Настройки индикатора позволяют регулировать силу дивергенции за счет угла наклона пиков RSI и процентного изменения цены, что даёт возможность тонко настроить силу сигнала. Код индикатора оптимизирован и в составе советника очень быстро тестируется.  Индикатор не перерисовывает, стрелки для н
FREE
Basic Harmonic Pattern MT5
Mehran Sepah Mansoor
4.78 (77)
Этот индикатор определяет наиболее популярные гармонические паттерны, которые предсказывают точки разворота рынка. Эти гармонические паттерны представляют собой ценовые формации, которые постоянно повторяются на рынке Форекс и указывают на возможные будущие движения цены /   Бесплатная версия MT4 Кроме того, данный индикатор имеет встроенный сигнал входа в рынок, а также различные тейк-профиты и стоп-лоссы. Следует отметить, что хотя индикатор гармонических паттернов может сам по себе давать с
FREE
This indicator is a zero-lag indicator and displays  strength of trend change . True Trend  Oscillator Pro works best in combination with True Trend Moving Average Pro that displays exact trend as is. Oscillator value is exact price change in given direction of the trend. True Trend Moving Average Pro: https://www.mql5.com/en/market/product/103586 If you set PERIOD input parameter to 1 this indicator becomes a sharpshooter for binary options. Developers can use True Trend Oscillator in Exper
FREE
Скользящая средняя Хала (HMA) пользуется заслуженной популярностью у трейдеров из-за эффективного сглаживания рыночных шумов и относительно небольшого запаздывания. Данная реализация индикатора для MetaTrader 5 меняет цвет при смене направления движения, может давать звуковой и текстовый сигнал. Также поддерживается отправка сообщений на электронную почту и push-сообщений на мобильные устройства. Есть возможность подачи сигнала на текущем незакрытом баре, однако этот сигнал может отмениться до з
FREE
Блоки ордеров спроса и предложения: Индикатор "Блоки ордеров спроса и предложения" - это сложный инструмент, основанный на концепциях умного денег, фундаментальных для технического анализа рынка Форекс. Он направлен на выявление зон спроса и предложения, ключевых областей, где институциональные трейдеры оставляют значительные следы. Зона предложения, указывающая на ордера на продажу, и зона спроса, указывающая на ордера на покупку, помогают трейдерам предвидеть потенциальные развороты или заме
FREE
Индикатор определяет, когда происходит расхождение между ценой и индикатором или осциллятором. Он выявляет как регулярные, так и скрытые расхождения. В сочетании с вашими собственными правилами и методами этот индикатор позволит вам создать (или улучшить) вашу собственную мощную систему. Функции Может обнаруживать дивергенции для следующих осцилляторов / индикаторов:       MACD, OsMA, Stochastics, RSI, CCI, RVI, Awesome, ADX, ATR, OBV, композитный индекс, MFI и моментум. Можно выбрать только од
FREE
С этим продуктом покупают
Раскройте силу торговли трендами с помощью индикатора Trend Screener: вашего идеального решения для торговли трендами, основанного на нечеткой логике и мультивалютной системе! Повысьте уровень своей торговли по тренду с помощью Trend Screener, революционного индикатора тренда, основанного на нечеткой логике. Это мощный индикатор отслеживания тренда, который сочетает в себе более 13 инструментов и функций премиум-класса и 3 торговые стратегии, что делает его универсальным выбором для превращения
Каждый покупатель этого индикатора получает дополнительно Бесплатно: Авторскую утилиту "Bomber Utility", которая автоматически сопровождает каждю торговую операцию, устанавливает уровни Стоп Лосс и Тейк профит и закрывает сделки согласно правилам этой стратегии, Сет-файлы для настройки этого индикатора на различных активах, Сет-файлы для настройки Bomber Utility в режимы: "Минимум Риска", "Взвешенный Риск" и "Стратегия Выжидания", Пошаговый видео-мануал, который поможет вам быстро установить, на
Golden Trend Indicator MT5
Noha Mohamed Fathy Younes Badr
4.89 (18)
Golden Trend indicator  is The best indicator for predicting trend movement this indicator never lags and never repaints and never back paints    and give  arrow buy and sell    before the candle appear  and it will help you and  will make your trading decisions clearer its work on all currencies and  gold and crypto and all time frame This unique  indicator uses very secret algorithms to catch the  trends, so you can trade using this indicator and see the trend clear on charts  manual guide and
PUMPING STATION – Ваша персональная стратегия "всё включено" Представляем PUMPING STATION — революционный индикатор Forex, который превратит вашу торговлю в увлекательный и эффективный процесс! Это не просто помощник, а полноценная торговая система с мощными алгоритмами, которые помогут вам начать торговать более стабильно! При покупке этого продукта вы БЕСПЛАТНО получаете: Эксклюзивные Set-файлы: Для автоматической настройки и максимальной эффективности. Пошаговое видео-руководство: Научитесь т
NOTE: CYCLEMAESTRO is distributed only on this website, there are no other distributors. Demo version is for reference only and is not supported. Full versione is perfectly functional and it is supported. CYCLEMAESTRO , the first and only indicator of Cyclic Analysis, useful for giving signals of TRADING, BUY, SELL, STOP LOSS, ADDING. Created on the logic of   Serghei Istrati   and programmed by   Stefano Frisetti ;   CYCLEMAESTRO   is not an indicator like the others, the challenge was to inter
MonetTrend — Премиум-индикатор для торговли по тренду (M30, H1, H4) MonetTrend — это мощный и визуально понятный трендовый индикатор, созданный для торговли на таймфреймах M30, H1 и H4. Он идеально подходит для работы с волатильными инструментами, такими как: • Золото (XAUUSD) • Криптовалюты (BTCUSD) • Валютные пары (EURUSD, USDJPY и др.) Ключевые особенности MonetTrend: • Автоматическое отображение Take Profit 1 (TP1) и Stop Loss (SL): После появления сигнала индикатор сразу показывает: • TP
Скринер поддержки и сопротивления находится в одном индикаторе уровня для MetaTrader, который предоставляет несколько инструментов внутри одного индикатора. Доступные инструменты: 1. Скринер структуры рынка. 2. Зона бычьего отката. 3. Зона медвежьего отката. 4. Ежедневные опорные точки 5. еженедельные опорные точки 6. ежемесячные опорные точки 7. Сильные поддержка и сопротивление, основанные на гармоническом паттерне и объеме. 8. Зоны уровня берега. ПРЕДЛОЖЕНИЕ ОГРАНИЧЕННОЕ ВРЕМЯ: Индикатор подд
Quantum TrendPulse
Bogdan Ion Puscasu
5 (13)
Представляем   Quantum TrendPulse   , совершенный торговый инструмент, который объединяет мощь   SuperTrend   ,   RSI   и   Stochastic   в один комплексный индикатор, чтобы максимизировать ваш торговый потенциал. Разработанный для трейдеров, которые ищут точность и эффективность, этот индикатор помогает вам уверенно определять рыночные тренды, сдвиги импульса и оптимальные точки входа и выхода. Основные характеристики: Интеграция SuperTrend:   легко следуйте преобладающим рыночным тенденциям и п
Точки входа по закрытию бара, без перерисовки .  Сканер трендов по всем активам, режим MTF  и многое другое в одном инструменте. Рекомендуем использовать вместе с   RFI LEVELS. ИНСТРУКЦИЯ RUS   /   INSTRUCTIONS  ENG         /        VERSION MT4   Основные функции: Точные сигналы на вход БЕЗ ПЕРЕРИСОВКИ! Если сигнал появился, он остается актуальным! Это важное отличие от индикаторов с перерисовкой, которые могут предоставить сигнал, а затем изменить его, что может привести к потере средств на деп
FX Power: Анализируйте силу валют для более эффективной торговли Обзор FX Power — это ваш незаменимый инструмент для понимания реальной силы валют и золота в любых рыночных условиях. Определяя сильные валюты для покупки и слабые для продажи, FX Power упрощает принятие торговых решений и выявляет высоковероятные возможности. Независимо от того, хотите ли вы следовать за трендами или предсказывать развороты с использованием экстремальных значений дельты, этот инструмент идеально адаптируется под
MetaForecast M5
Vahidreza Heidar Gholami
5 (3)
MetaForecast предсказывает и визуализирует будущее любого рынка на основе гармонии в данных о ценах. Хотя рынок не всегда предсказуем, если существует узнаваемый паттерн в ценах, то MetaForecast способен предсказать будущее с наибольшей точностью. По сравнению с другими аналогичными продуктами, MetaForecast способен генерировать более точные результаты, анализируя тренды на рынке. Входные параметры Past size (Размер прошлых данных) Указывает количество баров, которые MetaForecast использует для
Разворотные зоны / Пиковые объемы / Активные зоны крупного игрока =  ТС TPSPROSYSTEM ИНСТРУКЦИЯ RUS  /  INSTRUCTIONS  ENG        /       Version MT4    Каждый покупатель этого индикатора получает дополнительно БЕСПЛАТНО:  3 месяцев доступа к торговым сигналам от сервиса RFI SIGNALS — готовые точки входа по алгоритму TPSproSYSTEM. Обучающие материалы с регулярными обновлениями — погружение в стратегию и рост профессионального уровня. Круглосуточная поддержка в будние дни (24/5) и доступ в закрыт
Прежде всего стоит подчеркнуть, что этот торговый индикатор не перерисовывается, не перерисовывает и не отставает, что делает его идеальным как для ручной, так и для роботизированной торговли. Руководство пользователя: настройки, вводы и стратегия. Атомный аналитик - это индикатор ценового действия PA, который использует силу и импульс цены, чтобы найти лучший край на рынке. Оборудованный расширенными фильтрами, которые помогают убирать шумы и ложные сигналы, и повышают торговый потенциал. Испо
MONEYTRON – ТВОЙ ЛИЧНЫЙ СИГНАЛ НА УСПЕХ! XAUUSD | AUDUSD | USDJPY | BTCUSD Поддержка таймфреймов: M5, M15, M30, H1 Почему трейдеры выбирают Moneytron? 82% успешных сделок — это не просто цифры, это результат продуманной логики, точного алгоритма и настоящей силы анализа. Автоматические сигналы на вход — не нужно гадать: когда покупать, когда продавать. 3 уровня Take Profit — ты сам выбираешь свой уровень прибыли: безопасный, уверенный или максимум. Четкий Stop Loss — контролируешь риск
Лучшее решение для новичка или трейдера-эксперта! Этот индикатор является уникальным, высококачественным и доступным торговым инструментом, поскольку мы включили в него ряд собственных функций и новую формулу. С помощью всего лишь ОДНОГО графика вы можете определить силу валюты для 28 пар Форекс! Представьте, как улучшится ваша торговля, потому что вы сможете точно определить точку запуска нового тренда или возможность скальпирования? Руководство пользователя:   нажмите здесь Это первый, ори
Gold Stuff mt5
Vasiliy Strukov
4.93 (178)
Gold Stuff mt5 - трендовый индикатор, разработанный специально для золота, также может использоваться на любых финансовых инструментах. Индикатор не перерисовывается и не запаздывает. Рекомендуемый тайм-фрейм H1.  Свяжитесь со мной сразу после покупки для получения   персонального бонуса!   Вы можете получить бесплатную копию нашего индикатора Strong Support and Trend Scanner, пожалуйста, в личку. мне! Настройки и мануал  здесь ПАРАМЕТРЫ Draw Arrow -   вкл.выкл. отрисовку стрелок на графике. Al
FX Volume MT5
Daniel Stein
4.82 (17)
FX Volume: Оцените подлинную динамику рынка глазами брокера Краткий обзор Хотите вывести свою торговлю на новый уровень? FX Volume дает вам информацию в реальном времени о том, как розничные трейдеры и брокеры распределяют свои позиции — задолго до появления запаздывающих отчетов типа COT. Независимо от того, стремитесь ли вы к стабильной прибыли или ищете дополнительное преимущество на рынке, FX Volume поможет выявлять крупные дисбалансы, подтверждать пробои и совершенствовать управление риск
Сейчас 147 долл. США (увеличиваясь до 499 долл. США после нескольких обновлений) - неограниченные учетные записи (ПК или Mac) Руководство пользователя + Обучающие видео + Доступ к приватному Discord-каналу + VIP-статус и мобильная версия + Лицензия на 5 ПК с неограниченным количеством аккаунтов и терминалов MT4. Сколько раз вы покупали индикатор торговли с замечательными обратными тестами, доказательствами производительности на живых счетах и зашикарными цифрами и статистикой, но после исполь
CBT Quantum Maverick Высокоэффективная система торговли бинарными опционами CBT Quantum Maverick – это точно настроенная, высокопроизводительная система торговли бинарными опционами, созданная для трейдеров, стремящихся к точности, простоте и дисциплинированному подходу. Настройка не требуется – система оптимизирована для эффективных результатов прямо "из коробки". Просто следуйте сигналам, которые можно освоить с небольшой практикой. Основные характеристики: Точность сигналов: Сигналы для тор
Auto Order Block with break of structure based on ICT and Smart Money Concepts (SMC) Futures Break of Structure ( BoS )             Order block ( OB )            Higher time frame Order block / Point of Interest ( POI )    shown on current chart           Fair value Gap ( FVG ) / Imbalance   -  MTF      ( Multi Time Frame )    HH/LL/HL/LH  -  MTF      ( Multi Time Frame )  Choch  MTF      ( Multi Time Frame )  Volume Imbalance     ,  MTF          vIMB Gap’s Power of 3 Equal High / Low’s  
Matrix Arrow Indicator MT5
Juvenille Emperor Limited
5 (13)
Индикатор Matrix Arrow MT5   — это уникальный индикатор тренда 10 в 1, следующий за   100% неперерисовывающимся   индикатором с несколькими таймфреймами, который можно использовать на всех символах/инструментах:   форекс ,  товары ,   криптовалюты ,   индексы ,  акции . Индикатор Matrix Arrow MT5  будет определять текущую тенденцию на ранних этапах, собирая информацию и данные от до 10 стандартных индикаторов, а именно: Индекс среднего направленного движения (ADX) Индекс товарного канала (CCI)
*** Entry In The Zone и SMC Multi Timeframe — это инструмент анализа рынка в реальном времени, основанный на концепции умных денег (SMC). Он эффективно интегрирует сигналы разворота и автоматически определяет ключевые зоны разворота через детекцию структуры на нескольких таймфреймах, а также определяет ключевые точки интереса (POI). Этот инструмент предназначен для того, чтобы помочь трейдерам планировать и принимать решения с большей уверенностью и структурированным подходом. *** Особенности: -
FourAverage - новое слово в обнаружении тренда. С развитием информационных технологий и большого количества участников финансовые рынки всё менее поддаются анализу устаревшими индикаторами. Обычные технические средства анализа, такие как Скользящая средняя или Стохастик, в чистом виде не способны определять направления тренда или его разворот. Может ли один индикатор указывать правильное направление будущей цены, не меняя своих параметров, на истории 14 лет? При этом не терять адекватность при б
Эта панель показывает последние доступные   гармонические паттерны   для выбранных символов, так что вы сэкономите время и будете более эффективны /   MT4 версия . Бесплатный индикатор:   Basic Harmonic Pattern Колонки индикатора Symbol:   отображаются выбранные символы Trend   :   бычий или медвежий Pattern   :   тип паттерна (Гартли, бабочка, летучая мышь, краб, акула, шифр или ABCD) Entry   :   цена входа SL:   цена стоп-лосса TP1:   цена первого тейк-профита TP2:   цена второго тейк-профи
Прежде всего стоит подчеркнуть, что этот Торговый Инструмент является Неперерисовывающимся Нерепейнтинговым Индикатором, что делает его идеальным для профессиональной торговли. Онлайн-курс, руководство пользователя и демонстрация. Индикатор Концепций Умного Действия Цены - очень мощный инструмент как для новичков, так и для опытных трейдеров. Он объединяет более 20 полезных индикаторов в одном, комбинируя передовые торговые идеи, такие как анализ Inner Circle Trader и стратегии торговли концеп
Gold Trend 5
Sergei Linskii
3.5 (2)
Gold Trend – хороший биржевой технический индикатор. Алгоритм индикатора анализирует движение цены актива и отражает волатильность и потенциальные зоны для входа. Самые лучшие сигналы индикатора: Для SELL = красная гистограмма + красный указатель SHORT + желтая сигнальная стрелка в этом же направлении. Для BUY = синяя гистограмма + синий указатель LONG + аква сигнальная стрелка в этом же направлении.   Преимущества индикатора: И ндикатора выдает сигналы с высокой точностью. Подтвержденный сигна
FX Levels: Исключительно точные уровни поддержки и сопротивления для всех рынков Краткий обзор Ищете надежный способ определить уровни поддержки и сопротивления для любых инструментов—валют, индексов, акций или сырьевых товаров? FX Levels сочетает традиционный «Lighthouse» метод с современным динамическим подходом, обеспечивая почти универсальную точность. Благодаря сочетанию опыта реальных брокеров и автоматических ежедневных плюс «в реальном времени» обновлений, FX Levels поможет вам выявлят
Индикатор определения тренда, дополнит любую стратегию, а также может использоваться как самостоятельный инструмент.  ВАЖНО! Свяжитесь со мной сразу после покупки, чтобы получить инструкции и бонус!  Преимущества Прост в использовании, не перегружает график не нужной информацией; Возможность использования  как фильтр для любой стратегии; Имеет встроенные уровни динамических поддержек и сопротивлений, что может использоваться как для фиксации прибыли, так и для установки стоп-лоссов; Индикатор не
Представляю Вам отличный технический индикатор GRABBER, который работает, как готовая торговая стратегия "Все включено"! В одном программном коде интегрированы мощные инструменты для технического анализа рынка, торговые сигналы (стрелки), функции алертов и Push уведомлений.  Каждый покупатель этого индикатора получает дополнительно БЕСПЛАТНО:  Grabber Утилиту для автоматического управления открытыми ордерами, Пошаговый видео-мануал : как установить, настроить и торговать, Авторские сет-файлы дл
MetaBands M5
Vahidreza Heidar Gholami
4.5 (2)
MetaBands использует мощные и уникальные алгоритмы для построения каналов и обнаружения тенденций, чтобы предоставлять трейдерам потенциальные точки для входа и выхода из сделок. Это индикатор канала плюс мощный индикатор тенденций. Он включает различные типы каналов, которые могут быть объединены для создания новых каналов, просто используя параметры ввода. MetaBands использует все типы оповещений, чтобы уведомлять пользователей о событиях на рынке. Особенности Поддерживает большинство алгоритм
Другие продукты этого автора
Momentum Oscillator Breakout
Mohamed Hassan Mohamed Hassan Alsherbiny
When prices breakout resistance levels are combined with momentum oscillator breaks out its historical resistance levels then probability emerges to record farther higher prices.   It's strongly encouraged to confirm price breakout with oscillator breakout since they have comparable effects to price breaking support and resistance levels; surely, short trades will have the same perception. Concept is based on find swing levels which based on number of bars by each side to confirm peak or trough
FREE
MACD Breakout Indicator
Mohamed Hassan Mohamed Hassan Alsherbiny
5 (1)
Probability emerges to record higher prices when   MACD breaks out oscillator historical resistance level. It's strongly encouraged to confirm price breakout with oscillator breakout since they have comparable effects to price breaking support and resistance levels; surely, short trades will have the same perception. As advantage, many times oscillator breakout precedes price breakout as early alert to upcoming event as illustrated by   2nd & 3rd screenshot. Furthermore, divergence is confirmed
FREE
RSI Breakout MT4
Mohamed Hassan Mohamed Hassan Alsherbiny
When prices breakout resistance levels are combined with   Relative Strength Index "RSI"   oscillator breaks out its historical resistance levels then probability emerges to record farther prices.   It's strongly encouraged to confirm price breakout with oscillator breakout since they have comparable effects to price breaking support and resistance levels; surely, short trades will have the same perception. Concept is based on find swing levels which based on number of bars by each side to confi
FREE
CCi Oscillator Breakout SW
Mohamed Hassan Mohamed Hassan Alsherbiny
5 (1)
Probability emerges to record higher prices when Commodity Channel Index breaks out oscillator historical resistance level when exhibit overbought values. Since, oscillator breakout of support and resistance have similar effect as price breaks support and resistance levels, therefore, its highly advised to confirm price breakout with oscillator breakout; certainly, will have the same output in short trades. Concept is based on find swing levels which based on number of bars by each side of peak
FREE
ROC Oscillator Breakout
Mohamed Hassan Mohamed Hassan Alsherbiny
When prices breakout resistance levels are combined with Rate of Change oscillator "ROC" oscillator breaks out its historical resistance levels then probability emerges to record farther prices.   It's strongly encouraged to confirm price breakout with oscillator breakout since they have comparable effects to price breaking support and resistance levels; surely, short trades will have the same perception. Concept is based on find swing levels which based on number of bars by each side to confirm
FREE
MACD Breakout MT4
Mohamed Hassan Mohamed Hassan Alsherbiny
2 (1)
Probability emerges to record higher prices when   MACD breaks out oscillator historical resistance level. It's strongly encouraged to confirm price breakout with oscillator breakout since they have comparable effects to price breaking support and resistance levels; surely, short trades will have the same perception. As advantage, many times oscillator breakout precedes price breakout as early alert to upcoming event as illustrated by   2nd & 3rd screenshot. Furthermore, divergence is confirmed
FREE
RSI Oscillator Breakout SW
Mohamed Hassan Mohamed Hassan Alsherbiny
The likelihood of farther price movement increases when Relative Strength Index oscillator "RSI" breaks through its historical resistance levels in conjunction with prices breakout of resistance levels. It's strongly encouraged to confirm price breakout with oscillator breakout since they have comparable effects to price breaking support and resistance levels; similar perception is applied to short trades. Concept is based on find swing levels which based on number of bars by each side to confir
FREE
RSI Oscillator Breakout
Mohamed Hassan Mohamed Hassan Alsherbiny
The likelihood of farther price movement increases when Relative Strength Index oscillator "RSI" breaks through its historical resistance levels in conjunction with prices breakout of resistance levels. It's strongly encouraged to confirm price breakout with oscillator breakout since they have comparable effects to price breaking support and resistance levels; similar perception is applied to short trades. Concept is based on find swing levels which based on number of bars by each side to confir
FREE
WPR Oscillator Breakout
Mohamed Hassan Mohamed Hassan Alsherbiny
The likelihood of farther price movement increases when Larry Williams Percentage Range oscillator "WPR" breaks through its historical resistance levels in conjunction with prices breakout of resistance levels. It's strongly encouraged to confirm price breakout with oscillator breakout since they have comparable effects to price breaking support and resistance levels; similar perception is applied to short trades. Concept is based on find swing levels which based on number of bars by each side t
FREE
Momentum Breakout Indicator MT4
Mohamed Hassan Mohamed Hassan Alsherbiny
When prices breakout resistance levels are combined with momentum oscillator breaks out its historical resistance levels then probability emerges to record farther prices. It's strongly encouraged to confirm price breakout with oscillator breakout since they have comparable effects to price breaking support and resistance levels; surely, short trades will have the same perception. Concept is based on find swing levels which based on number of bars by each side to confirm peak or trough and in tu
FREE
MACD Breakout indicator SW
Mohamed Hassan Mohamed Hassan Alsherbiny
Probability emerges to record higher prices when   MACD breaks out oscillator historical resistance level. It's strongly encouraged to confirm price breakout with oscillator breakout since they have comparable effects to price breaking support and resistance levels; surely, short trades will have the same perception. As advantage, many times oscillator breakout precedes price breakout as early alert to upcoming event as illustrated by   2nd & 3rd screenshot. Furthermore, divergence is confirmed
FREE
WPR Oscillator Breakout SW
Mohamed Hassan Mohamed Hassan Alsherbiny
The likelihood of farther price movement increases when Larry Williams Percentage Range oscillator "WPR" breaks through its historical resistance levels in conjunction with prices breakout of resistance levels. It's strongly encouraged to confirm price breakout with oscillator breakout since they have comparable effects to price breaking support and resistance levels; similar perception is applied to short trades. Concept is based on find swing levels which based on number of bars by each side t
FREE
MACD Breakout SW
Mohamed Hassan Mohamed Hassan Alsherbiny
Probability emerges to record higher prices when MACD breaks out oscillator historical resistance level. It's encouraged to confirm price breakout with oscillator breakout since they have comparable effects to price breaking support and resistance levels; certainly, short trades will have the same perception. As advantage, many times oscillator breakout precedes price breakout as early alert to upcoming event as illustrated by second and third screenshot. Furthermore divergence is confirmed in c
FREE
CCi Oscillator Breakout
Mohamed Hassan Mohamed Hassan Alsherbiny
Probability emerges to record higher prices when CCi oscillator breaks out oscillator historical resistance level when exhibit overbought values. Since, oscillator breakout of support and resistance have similar effect as price breaks support and resistance levels, therefore, its highly advised to confirm price breakout with oscillator breakout; certainly, will have the same output in short trades. Concept is based on find swing levels which based on number of bars by each side of peak or troug
FREE
WPR Breakout SW
Mohamed Hassan Mohamed Hassan Alsherbiny
When prices breakout resistance levels are combined with Larry Williams' Percent Range oscillator "WPR" breaks out its historical resistance levels then higher chances emerges to record farther prices. It's strongly encouraged to confirm price breakout with oscillator breakout since they have comparable effects to price breaking support and resistance levels; certainly short trades will have the same perception. Concept is based on find swing levels which based on number of bars by each side to
FREE
CCI Breakout MT4
Mohamed Hassan Mohamed Hassan Alsherbiny
Probability emerges to record higher prices when CCi oscillator breaks out oscillator historical resistance level when exhibit overbought values. Since, oscillator breakout of support and resistance have similar effect as price breaks support and resistance levels, therefore, its highly advised to confirm price breakout with oscillator breakout; certainly, will have the same output in short trades. Concept is based on find swing levels which based on number of bars by each side of peak or trough
FREE
WPR Breakout MT4
Mohamed Hassan Mohamed Hassan Alsherbiny
When prices breakout resistance levels are combined with   Larry Williams' Percentage Range "WPR"   oscillator breaks out its historical resistance levels then probability emerges to record farther prices.   It's strongly encouraged to confirm price breakout with oscillator breakout since they have comparable effects to price breaking support and resistance levels; surely, short trades will have the same perception. Concept is based on find swing levels which based on number of bars by each side
FREE
ROC Oscillator Breakout SW
Mohamed Hassan Mohamed Hassan Alsherbiny
When prices breakout resistance levels are combined with Rate of Change oscillator "ROC" breaks out its historical resistance levels then higher chances emerges to record farther prices. It's strongly encouraged to confirm price breakout with oscillator breakout since they have comparable effects to price breaking support and resistance levels; certainly short trades will have the same perception. Concept is based on find swing levels which based on number of bars by each side to confirm peak or
FREE
RVI Breakout SW
Mohamed Hassan Mohamed Hassan Alsherbiny
Probability emerges to record higher prices when RVi breaks out oscillator historical resistance level. It's strongly encouraged to confirm price breakout with oscillator breakout since they have comparable effects to price breaking support and resistance levels; surely, short trades will have the same perception. As advantage, a lot of times oscillator breakout precedes price breakout as early alert to upcoming event as illustrated by 6th screenshot. Furthermore, divergence is confirmed in case
FREE
Momentum Oscillator Breakout SW
Mohamed Hassan Mohamed Hassan Alsherbiny
When prices breakout resistance levels are combined with momentum oscillator breaks out its historical resistance levels then probability emerges to record farther higher prices. It's strongly encouraged to confirm price breakout with oscillator breakout since they have comparable effects to price breaking support and resistance levels; certainly short trades will have the same perception. Concept is based on find swing levels which based on number of bars by each side to confirm peak or trough
FREE
RVi Oscillator Breakout SW
Mohamed Hassan Mohamed Hassan Alsherbiny
Probability emerges to record higher prices when RVi breaks out oscillator historical resistance level. It's strongly encouraged to confirm price breakout with oscillator breakout since they have comparable effects to price breaking support and resistance levels; surely, short trades will have the same perception. As advantage, a lot of times oscillator breakout precedes price breakout as early alert to upcoming event as illustrated by last screenshot. Furthermore, divergence   is confirmed in
FREE
RSI Breakout SW
Mohamed Hassan Mohamed Hassan Alsherbiny
The likelihood of farther price movement increases when the Relative Strength Index oscillator "RSI" breaks through its historical resistance levels in conjunction with prices breakout of resistance levels. It's strongly encouraged to confirm price breakout with oscillator breakout since they have comparable effects to price breaking support and resistance levels; similar perception is applied to short trades. Concept is based on find swing levels which based on number of bars by each side to co
FREE
CCI Breakout SW
Mohamed Hassan Mohamed Hassan Alsherbiny
Probability emerges to record higher prices when Commodity Channel Index breaks out oscillator historical resistance level when exhibit overbought values. Since, oscillator breakout of support and resistance have similar effect as price breaks support and resistance levels, therefore, its highly advised to confirm price breakout with oscillator breakout; certainly, will have the same output in short trades. Concept is based on find swing levels which based on number of bars by each side of peak
FREE
Momentum Breakout SW
Mohamed Hassan Mohamed Hassan Alsherbiny
When prices breakout resistance levels are combined with momentum oscillator breaks out its historical resistance levels then probability emerges to record farther prices. It's strongly encouraged to confirm price breakout with oscillator breakout since they have comparable effects to price breaking support and resistance levels; certainly short trades will have the same perception. Concept is based on find swing levels which based on number of bars by each side to confirm peak or trough and in
FREE
RVI Breakout MT4
Mohamed Hassan Mohamed Hassan Alsherbiny
Probability emerges to record higher prices when RVi breaks out oscillator historical resistance level. It's strongly encouraged to confirm price breakout with oscillator breakout since they have comparable effects to price breaking support and resistance levels; surely, short trades will have the same perception. As advantage, a lot of times oscillator breakout precedes price breakout as early alert to upcoming event as illustrated by 6th screenshot. Furthermore; divergence is confirmed in case
FREE
Фильтр:
Newera2023
242
Newera2023 2024.06.14 04:51 
 

Great indicator and functionality. Been using it along with my current system for trading and it is working well.

Mohamed Hassan Mohamed Hassan Alsherbiny
11229
Ответ разработчика Mohamed Hassan Mohamed Hassan Alsherbiny 2024.06.14 05:41
appreciated support
profitable trades
Ответ на отзыв
Версия 4.0 2024.07.08
on chart show of price levels correspond to broken oscillator levels
Версия 3.10 2024.06.12
one bug released due to client report
Версия 3.0 2024.06.11
new item took place in setup menu to only display the early breakup signals
Версия 2.0 2024.06.09
Discard false signals showing late breakout of price and filtered the early signals of breakouts