Accurate Trend Finder
- Эксперты
- Machel Delaurence Miller
- Версия: 1.10
- Обновлено: 27 мая 2024
- Активации: 5
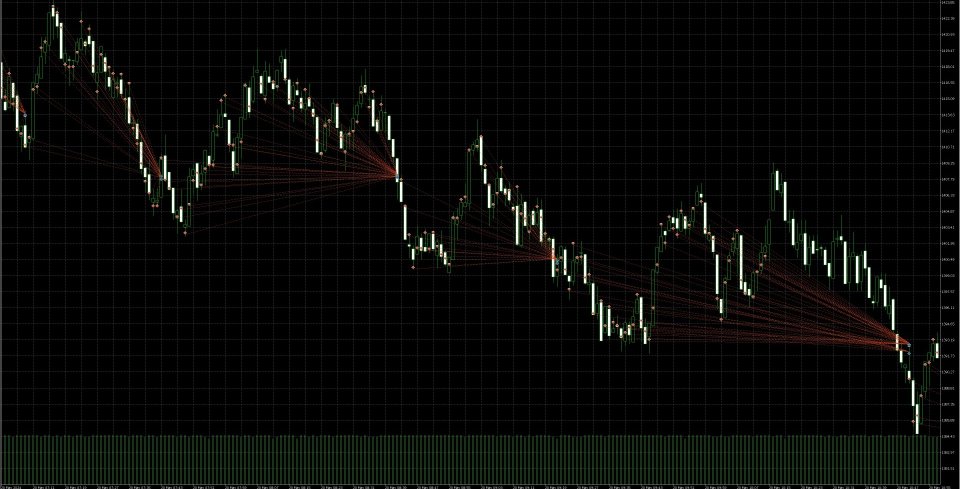
The "Accurate Trend Finder" EA combines the power of 10 technical indicators, 10 candlestick patterns, and precise analysis of support and resistance levels to make highly accurate and reliable decisions on trend direction, ensuring you stay ahead in the market.
This EA is a sophisticated trading tool designed to automate trading decisions based on a combination of technical indicators and candlestick patterns. This EA is engineered to help traders make informed and precise trading decisions by analyzing multiple market signals and executing trades accordingly. It includes various configurable input fields to tailor its behavior to the user's specific trading strategy.
Capabilities
-
Indicator-Based Signal Generation
-
Simple Moving Average (SMA)
- Uses a 50-period and 200-period SMA to generate buy or sell signals.
- Buy Signal: Short-term SMA crosses above long-term SMA.
- Sell Signal: Short-term SMA crosses below long-term SMA.
-
Exponential Moving Average (EMA)
- Uses a 50-period and 200-period EMA for trend detection.
- Buy Signal: Short-term EMA crosses above long-term EMA.
- Sell Signal: Short-term EMA crosses below long-term EMA.
-
Moving Average Convergence Divergence (MACD)
- Analyzes the MACD line crossing above or below the signal line.
- Buy Signal: MACD line crosses above the signal line.
- Sell Signal: MACD line crosses below the signal line.
-
Relative Strength Index (RSI)
- Uses a 14-period RSI to gauge market momentum.
- Buy Signal: RSI value is above 50.
- Sell Signal: RSI value is below 50.
-
Stochastic Oscillator
- Uses a 14-period %K and 3-period %D to identify overbought or oversold conditions.
- Buy Signal: %K crosses above %D and is above 50.
- Sell Signal: %K crosses below %D and is below 50.
-
Average Directional Index (ADX)
- Uses a 14-period ADX to measure the strength of a trend.
- Buy Signal: ADX value is above 25.
- Sell Signal: ADX value is below 25.
-
Parabolic SAR
- Uses a step of 0.02 and a maximum of 0.2 to determine trend reversals.
- Buy Signal: Current price is above the Parabolic SAR value.
- Sell Signal: Current price is below the Parabolic SAR value.
-
Ichimoku Cloud
- Analyzes the Ichimoku components for trend confirmation.
- Buy Signal: Current price is above the Tenkan-sen line.
- Sell Signal: Current price is below the Tenkan-sen line.
-
Fibonacci Retracement
- Uses Fibonacci levels to identify potential reversal points.
- Buy Signal: Current price is above the 61.8% Fibonacci level.
- Sell Signal: Current price is below the 61.8% Fibonacci level.
-
Bollinger Bands
- Uses a 20-period Bollinger Band with a 2 standard deviation.
- Buy Signal: Current price is above the middle band.
- Sell Signal: Current price is below the middle band.
-
-
Candlestick Pattern Detection
- Doji
- Hammer
- Hanging Man
- Bullish Engulfing
- Bearish Engulfing
- Morning Star
- Evening Star
- Piercing Line
- Dark Cloud Cover
- Three White Soldiers
- Three Black Crows
These patterns are analyzed to provide additional confirmation for trading signals.
-
Support and Resistance Levels
- Identifies recent highs and lows to determine support and resistance levels.
- Uses proximity to these levels as additional criteria for validating trade signals.
-
Trade Management
- Close All Trades
- Automatically closes all open trades if no clear signal is detected, provided the option is enabled.
- Threshold-Based Trade Closure
- Closes all trades if the total profit falls below a specified loss threshold or exceeds a specified profit threshold.
- Close All Trades
Input Fields and Their Functions
-
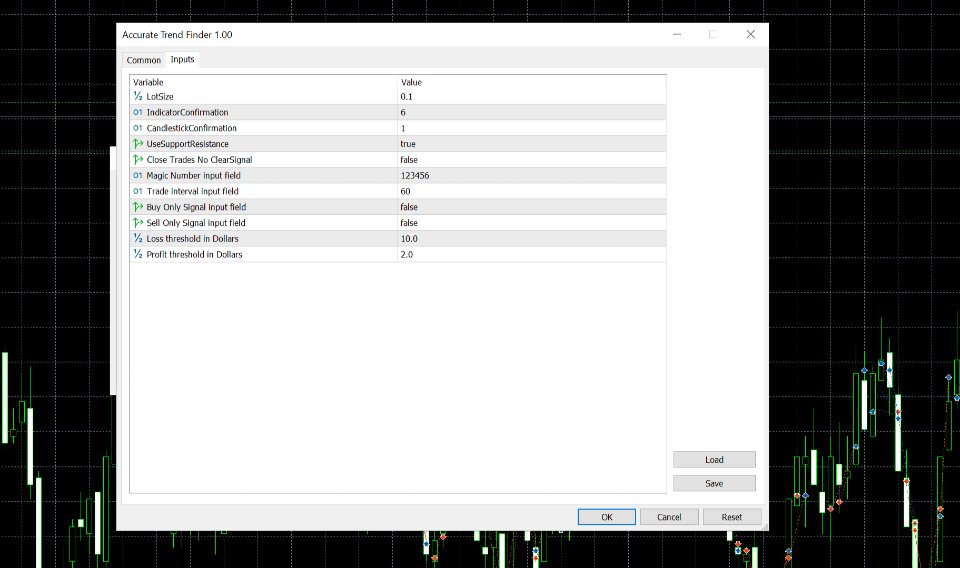
LotSize (default: 0.1)
- Defines the lot size for each trade.
-
IndicatorConfirmation (default: 7)
- Number of indicators that need to align to confirm a trend change (bullish or bearish).
-
CandlestickConfirmation (default: 1)
- Number of candlestick patterns needed to confirm a trend change.
-
UseSupportResistance (default: true)
- Whether to consider support and resistance levels when making trading decisions.
-
CloseTradesOnNoClearSignal (default: true)
- If enabled, the EA will close all trades if no clear signal is detected.
-
MagicNumber (default: 123456)
- Unique identifier for the EA's trades, used to distinguish them from other trades on the same account.
-
TradeIntervalSeconds (default: 60)
- Minimum time interval between trades, in seconds.
-
BuyOnlySignal (default: false)
- If enabled, the EA will only consider buy signals and ignore sell signals.
-
SellOnlySignal (default: false)
- If enabled, the EA will only consider sell signals and ignore buy signals.
-
LossThreshold (default: 100.0)
- The maximum allowable loss in dollars before all trades are closed.
-
ProfitThreshold (default: 100.0)
- The minimum profit target in dollars before all trades are closed.
Execution Logic
- Signal Generation: Combines indicator signals and candlestick patterns to generate buy or sell signals.
- Trade Execution: Executes buy or sell orders based on the generated signals and user-configured settings.
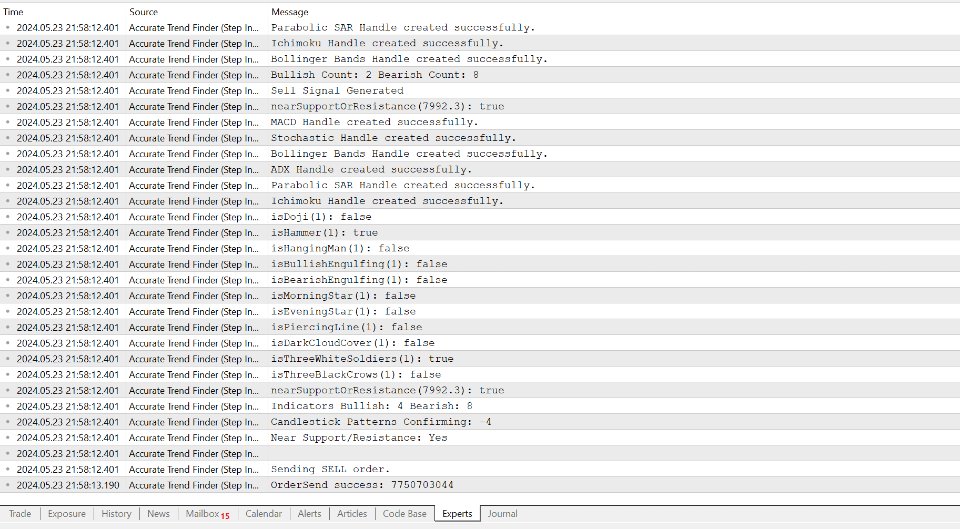
- Logging: Logs the decision-making process, including the number of indicators and patterns supporting each trade and proximity to support/resistance levels.
- Trade Interval Management: Ensures trades are placed only at user-defined intervals.
- Threshold-Based Closure: Closes all trades when profit or loss thresholds are reached to protect the trader's capital.
The "Accurate Trend Finder" EA is a powerful and flexible tool designed to help traders navigate the complexities of the market with precision and confidence. By leveraging a wide range of technical indicators and patterns, it provides robust trading signals and comprehensive trade management features.

