• Обзор
  • Отзывы (1)
  • Обсуждение (9)
  • Что нового

Liquidity Pro MT4

5

Liquidity Pro

The Liquidity Pro highlights liquidity and supply & demand zones in any financial instrument, including currency pairs, cryptocurrencies, commodities and indices. The Liquidity Pro highlights "Supply & Demand" zones, down to the present minute, providing optimal trade entries and exits, when conducting chart analysis or initiating trades.

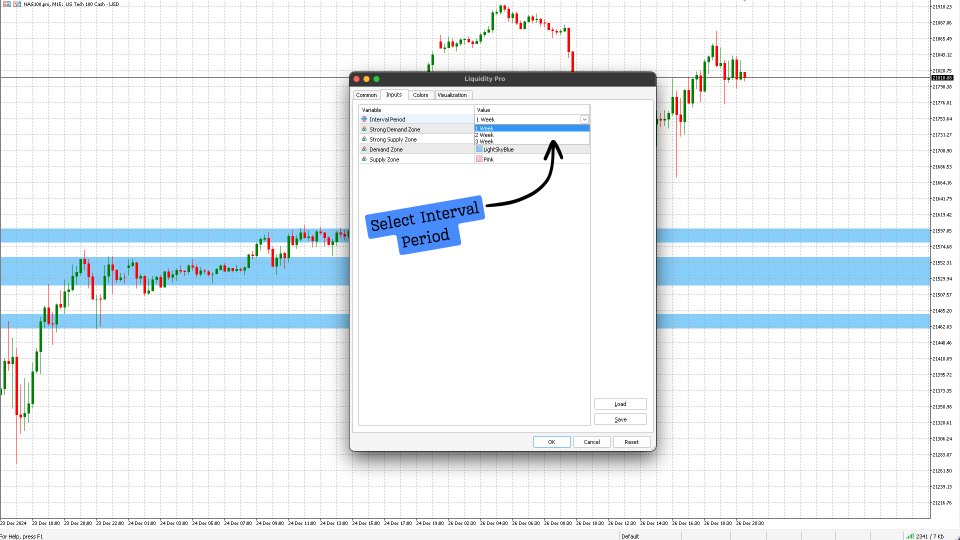
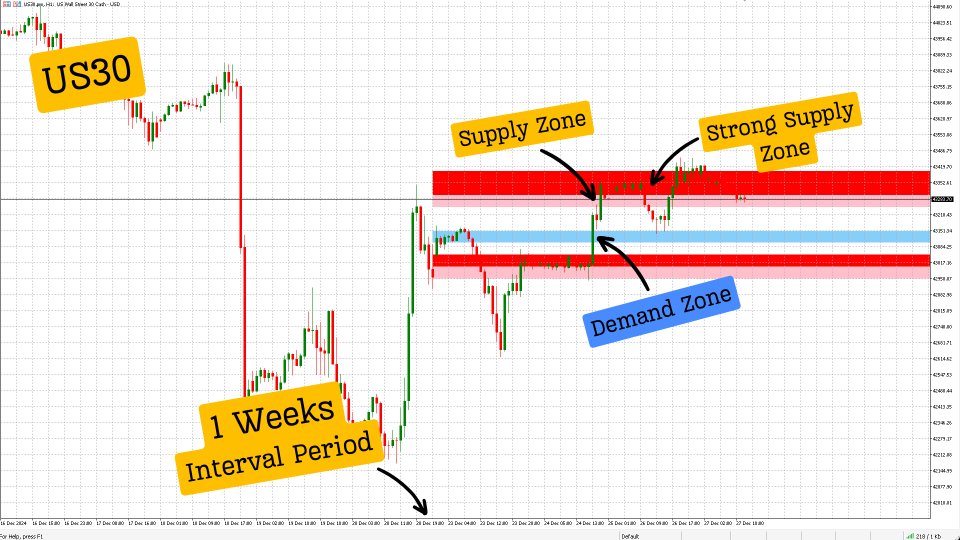
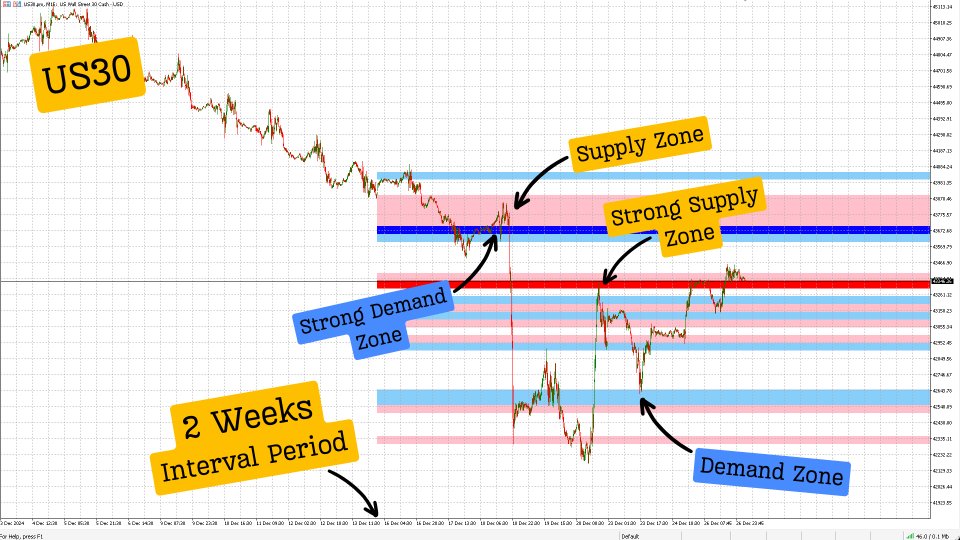
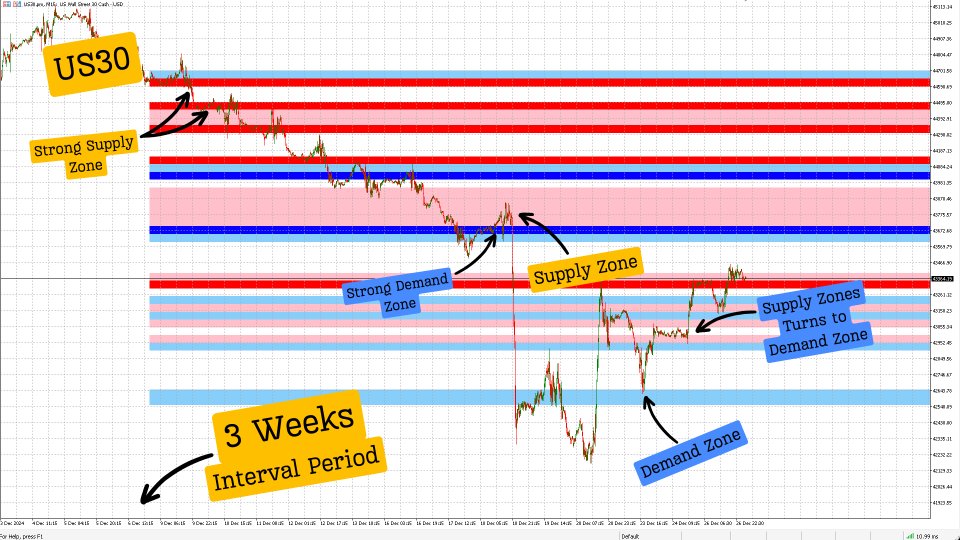
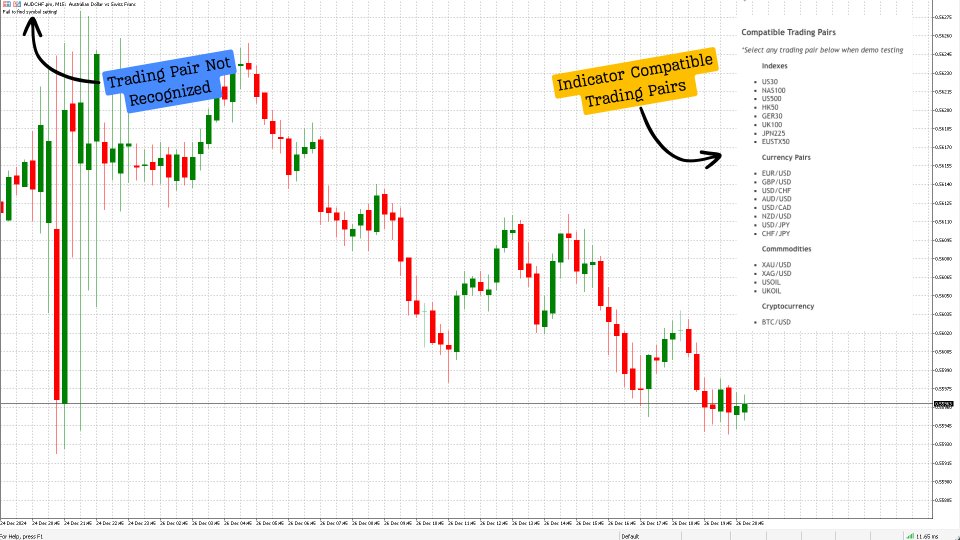
The Liquidity Pro algorithm automatically detects your trading pair, enabling you to instantly view liquidity, supply, and demand zones. The interval period feature allows you to view liquidity, supply and demand zones for up to 3 weeks, enabling traders to analyze the current week, previous week and the week before that. Currently, the indicator is compatible only with the popular trading pairs listed below, with additional pairs added based on user feedback and suggestions.

The Liquidity Pro allows you to observe where price consolidates, retraces, resists, or settles within support areas. It highlights areas where market participants are likely to react to price movements, providing real-time insights into market dynamics. Additionally the Liquidity Pro offers a visual representation, as the price approaches potential liquidity zones and "Supply & Demand" zones, enabling users to make quick and informed decisions.

One standout feature of this indicator is its ability to detect both bullish and bearish momentum. It visually indicates wether the momentum is bullish or bearish at the conclusion of the last tick, regardless of the chosen time frame. Further more you can view the "Liquidity" and "Supply & Demand" zones for the current week, current week and previous week or the last 3 weeks, however it is recommended to use the default settings regardless of trading pair.

Disclaimer: News events and economic data releases can affect the accuracy and performance of this indicator. Supply zones may also shift into demand zones, or vice versa, based on market conditions. It is recommended to use this indicator in conjunction with proper risk management and additional analysis.

Please refer to our attached YouTube video for valuable insights into the functionality and detailed breakdown of how the "Liquidity Pro" algorithm is a game changer, assisting traders view charts with clarity.

NOTICE: Before adding the demo indicator to your chart, please follow the steps outlined in the video to ensure the algorithm gathers the necessary data points from all time frames. If you have any questions, feel free to write to us in the comment section, and we’ll respond promptly.

PROP FIRMS: Liquidity Pro is NOT compatible with the "FTMO" Prop Firm because they restrict access to their broker's data, however "Liquidity Pro is compatible with all other Prop Firms"

What is Liquidity? 

Liquidity refers to when traders are actively buying or selling at a particular price level, causing the price to remain relatively stable over a certain period. High liquidity indicates a substantial presence of both buyers and sellers actively participating in currency trading, resulting in narrow bid-ask spreads and stable market prices. On the contrary, low liquidity may lead to broader spreads and heightened price volatility due to a reduced number of market participants.

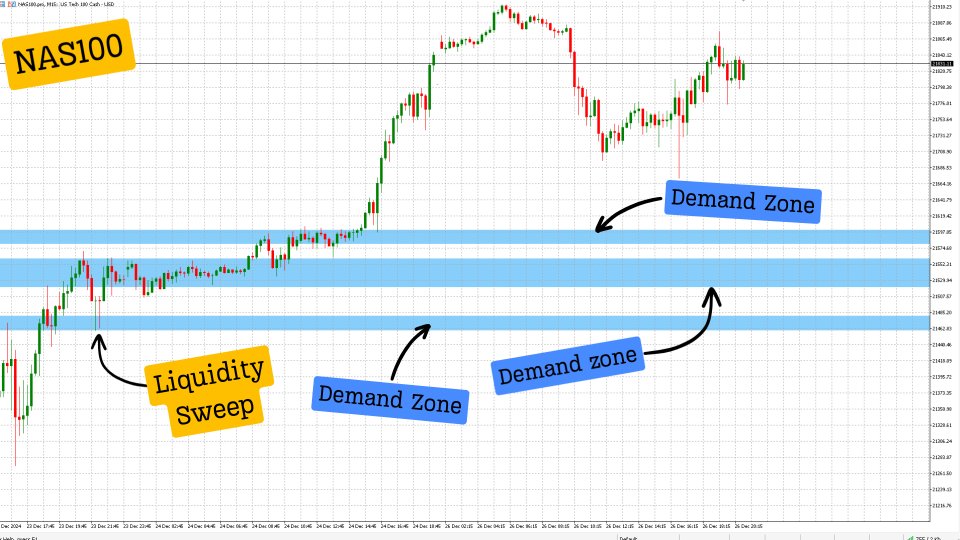
Liquidity Pro highlights liquidity zones as smaller rectangular zones, irrespective of colour, confined to a narrower price range. Liquidity is often found near support and resistance levels or areas where traders have placed stop-loss or pending orders, Indicating where large volumes of trades may occur, attracting institutional traders or market makers.

Liquidity can exist within supply and demand zones, as these zones attract orders, but not all liquidity areas are necessarily supply or demand zones.


What are "Supply & Demand" zones? 

Specific areas on a chart where selling (supply) or buying (demand) pressure is dominant, causing price reversals or sharp price movements away from a zone, indicating a prior imbalance in buy and sell orders.

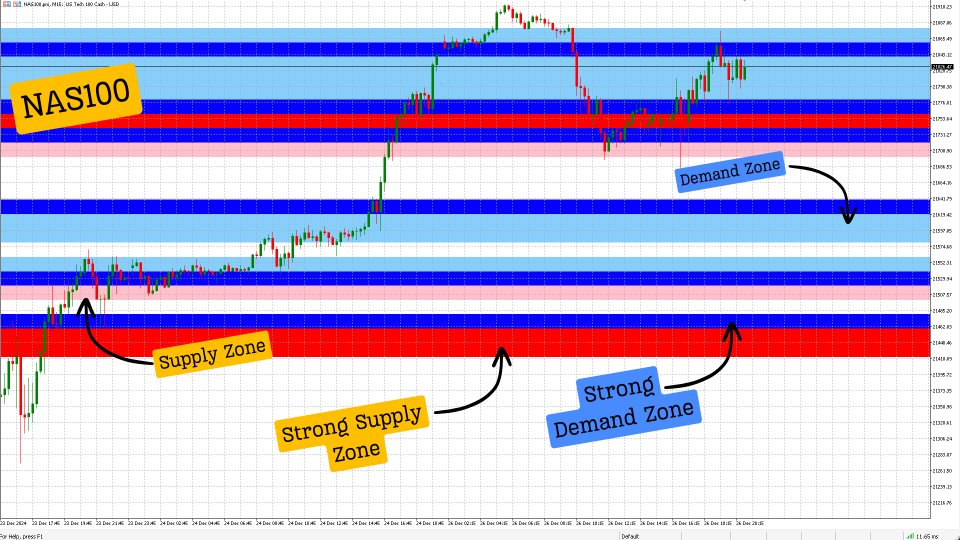
Strong Zones Zones (Red): Represents areas of high selling pressure, where price has consistently reversed or been rejected previously.

Supply Zones (Pink): Indicates less dominant selling pressure or potential areas where price may pause but not necessarily reverse strongly.

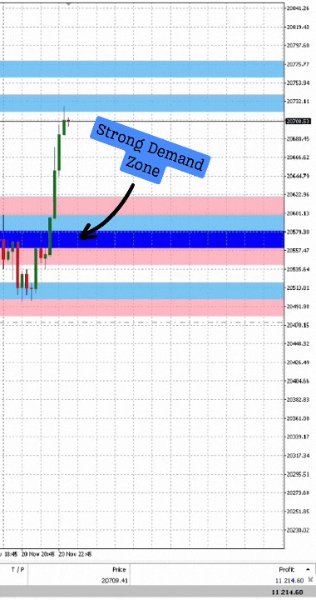
Strong Demand Zones (Blue): Represents areas of high buying pressure, where price has historically bounced with significant momentum.

Demand Zones (Light Blue): Suggests areas of lower buying pressure or possible price pauses rather than a stronger bounce.


Key Features

  • Once loaded, the Liquidity Pro algorithm automatically identifies the trading pair and begins highlighting liquidity and supply & demand zones.
  • Review liquidity and supply & demand zones for the current week, current week & previous week or the previous 3 weeks.
  • Track liquidity and supply & demand zones down to the present second, through our superior algorithm. 
  • Liquidity areas are depicted as smaller rectangular zones, limited to a narrower price range.
  • Displays distribution of prices across different levels to identify areas of concentrated trading activity.
  • The algorithm updates liquidity zones and supply and demand zones in real time, tick by tick, with no data lag
  • Dynamic coloured rectangular zones indicate supply or demand zone.
  • Quickly visualize bullish or bearish momentum, through coloured rectangular zones.
  • Offers an intuitive interface for easy interpretation and analysis of incoming data.
  • Visual representation of price movement such as spikes, divergences or trends.
  • Can be used in conjunction with other technical indicators for comprehensive market analysis.
  • Allows users to examine historical areas of liquidity and supply & demand zones.
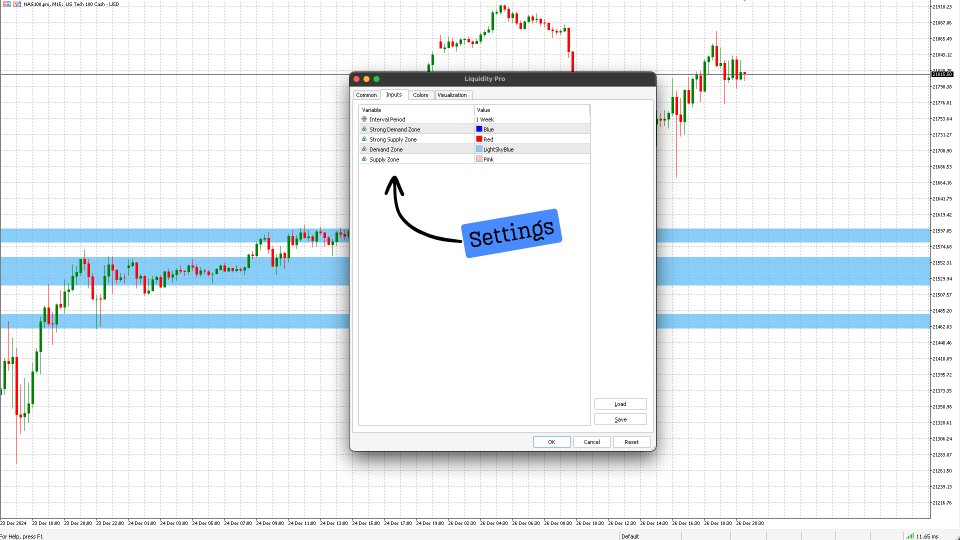
  • Allows users to personalize settings such as zone colours.

Pricing 

Our MT4 version of "Liquidity Pro" is priced at $66.00 per month, reflecting over two years of development, rigorous backtesting, and diligent bug fixing to ensure optimal functionality. Our confidence in the precision and accuracy of our indicators is such that we regularly showcase them in real-time market conditions through daily content on our social media channels.

Our belief in trading simplicity, adhering to the principle of buying low and selling high, is echoed in our indicators' clear display of potential entry and exit points. We consistently provide daily content demonstrating our indicators in action. We are committed to monitoring user feedback closely and making necessary improvements to our indicators should any bugs arise, ensuring that traders have access to the most effective tools for their trading endeavours.


Compatible Trading Pairs

*Select any trading pair below when demo testing

Indexes

  • US30
  • NAS100 
  • US500
  • HK50 
  • GER30 
  • UK100 
  • JPN225 
  • EUSTX50 

Currency Pairs

  • EUR/USD 
  • GBP/USD 
  • USD/CHF 
  • AUD/USD 
  • USD/CAD 
  • NZD/USD 
  • USD/JPY 
  • CHF/JPY 

Commmodities

  • XAU/USD
  • XAG/USD 
  • USOIL
  • UKOIL

Cryptocurrency 

  • BTC/USD

MT5 Version Available: Yes

Trading Pairs: Most Popular Pairs (see compatible trading pairs) 

Timeframe: Any

Brokers: Any

Account Type: Any

Prop Firms: Yes

Multi-Currency Indicator: Yes

Compatibility: Liquidity Pro works with currency pairs, indicies, equities, commodities and cryptocurrencies

NOTE: If you need help with settings or have any questions, please feel free to leave a comment in the comment section below. You can also visit our blog where you can leave a comment, and we'll respond promptly.

Disclaimer

We would like to emphasize that the information provided by seller and its affiliates, including its premium software subscribers, is not intended as financial advice and should not be construed as such. The content and opinions shared in our social media content and premium software subscription are for general informational purposes only, and they do not offer specific advice or recommendations for individuals or entities.

The seller and its affiliates do not endorse or recommend any securities, and our content is not an offer or solicitation to buy or sell any securities. The information provided in our social media content and premium software subscription may not be exhaustive and is subject to change without notice.

It's important to note that our social media content, research, information, and disclosures do not guarantee financial success or profitability. They provide insights into our investment strategies and how we manage our private capital in the financial markets.

Given the inherent risks of financial markets and the fact that past performance does not guarantee future results, we cannot assure specific outcomes or returns. Investing in financial markets carries the risk of loss.

Therefore, we advise conducting your own research and seeking professional advice before making any investment decisions. The information and opinions presented in our social media content and premium software subscription are meant for general informational purposes only and do not constitute specific advice or recommendations for any individual or entity.

By purchasing any premium software subscription, you acknowledge and accept that the seller and its affiliates are not liable for any investment decisions made based on information provided through social media content or premium subscription software.



Отзывы 1
David T
303
David T 2024.09.27 05:10 
 

After using it while limited to my on screen time due to working full-time...I can see that with a short learning curve how a great addition this can be to a trader. It makes for a great confirmation indicator as to change in direction . In my view it rivals SMC or regular support and resistance zones. Great seller communication.

Рекомендуем также
Это, пожалуй, самый полный индикатор автоматического распознавания гармонического ценообразования, который вы можете найти для платформы MetaTrader. Он обнаруживает 19 различных паттернов, воспринимает проекции Фибоначчи так же серьезно, как и вы, отображает зону потенциального разворота (PRZ) и находит подходящие уровни стоп-лосс и тейк-профит. [ Руководство по установке | Руководство по обновлению | Устранение неполадок | FAQ | Все продукты ] Он обнаруживает 19 различных гармонических ценов
Introduction to X3 Chart Pattern Scanner X3 Cherart Pattern Scanner is the non-repainting and non-lagging indicator detecting X3 chart patterns including Harmonic pattern, Elliott Wave pattern, X3 patterns, and Japanese Candlestick patterns. Historical patterns match with signal patterns. Hence, you can readily develop the solid trading strategy in your chart. More importantly, this superb pattern scanner can detect the optimal pattern of its kind. In addition, you can switch on and off individu
Alpha Trend sign - это мой давний и очень популярный торговый инструмент, который проверяет нашу торговую систему и четко сигнализирует о транзакциях, которые не дрейфуют.   Основные функции:   • В зависимости от того, показывает ли рынок активную область, показатели могут быть очень интуитивными, чтобы определить, является ли текущая конъюнктура трендовой или шоковой.   И в соответствии с индикатором стрелка врезается на рынок, зеленая стрела подсказывает купить, красная стрела подсказывает
Monster Harmonics - индикатор гармонических моделей (harmonic patterns). Он распознает следующие модели: Гартли (Gartley), Летучая мышь (Bat), Краб (Crab), Бабочка (Butterfly), Монограмма (Cypher), Черный лебедь (Black Swan), Белый лебедь (White Swan), Акула (Shark) и AB=CD. Незаконченные модели также распознаются. Monster даже показывает потенциальную зону разворота (Potential Reversal Zone, PRZ). Пользователи могут добавлять свои паттерны. Кроме текущей модели, Monster также показывает все мод
VR Cub
Vladimir Pastushak
VR Cub это индикатор что бы получать качественные точки входа. Индикатор разрабатывался с целью облегчить математические расчеты и упростить поиск точек входа в позицию. Торговая стратегия, для которой писался индикатор, уже много лет доказывает свою эффективность. Простота торговой стратегии является ее большим преимуществом, что позволяет успешно торговать по ней даже начинающим трейдерам. VR Cub рассчитывает точки открытия позиций и целевые уровни Take Profit и Stop Loss, что значительно повы
The Penta-O is a 6-point retracement harmonacci pattern which usually precedes big market movements. Penta-O patterns can expand and repaint quite a bit. To make things easier this indicator implements a twist: it waits for a donchian breakout in the right direction before signaling the trade. The end result is an otherwise repainting indicator with a very reliable trading signal. The donchian breakout period is entered as an input. [ Installation Guide | Update Guide | Troubleshooting | FAQ | A
Индикатор Elliott Wave Trend был разработан для научного подсчета волн на основе шаблонов и паттернов, впервые разработанных Чжон Хо Сео. Индикатор нацелен на максимальное устранение нечеткости классического подсчета волн Эллиотта с использованием шаблонов и паттернов. Таким образом индикатор Elliott Wave Trend в первую очередь предоставляет шаблон для подсчета волн. Во-вторых, он предлагает структурный подсчет волн Wave Structural Score, которые помогает определить точное формирование волны. Он
Профиль Рынка (Market Profile) определяет ряд типов дней, которые помогают трейдеру распознать поведение рынка. Ключевая особенность - это область значений (Value Area), представляющая диапазон ценового действия, в котором произошло 70% торговли. Понимание области значений может помочь трейдерам вникнуть в направление рынка и установить торговлю с более высокими шансами на успех. Это отличное дополнение к любой системе, которую вы возможно используете. Blahtech Limited представляет сообществу Me
Индикатор Supply and Demand Zones - один из лучших инструментов, которые мы когда-либо создавали. Этот замечательный инструмент автоматически рисует зоны спроса и предложения - лучшие места для открытия и закрытия позиций. Он имеет множество дополнительных функций, таких как поддержка зон на нескольких таймфреймах, отображение ширины зон, уведомления об измененных зонах и многое другое. Благодаря фрактальности рынка, этот индикатор можно использовать для любого вида торговли. Не имеет значения,
El indicador "MR BEAST ALERTAS DE LIQUIDEZ" es una herramienta avanzada diseñada para proporcionar señales y alertas sobre la liquidez del mercado basándose en una serie de indicadores técnicos y análisis de tendencias. Ideal para traders que buscan oportunidades de trading en función de la dinámica de precios y los niveles de volatilidad, este indicador ofrece una visualización clara y detallada en la ventana del gráfico de MetaTrader. Características Principales: Canal ATR Adaptativo: Calcula
ProTrading Arrow
Nedyalka Zhelyazkova
5 (1)
" A NEW TRADING METHOD… AN AMAZING TRADING INDICATOR! " Additional Bonus : You get the Forex Trend Commander indicator for FREE! It should not be forgotten that trading is not an event, but a process. This process has no end, i.e. it should never stop completely and completely. To lock in a profit from market movements you need to implement the strategy in practice, in most cases it takes much longer than planning it. ProTrading Arrow indicator is an advanced reversal system that can be played
Trade with Gann on your side!! MASTER CIRCLE 360 CIRCLE CHART, originally created by Gann admitted that this is “The Mother of all charts”. It is one of the last studies that this great trader left for us. The numeric tab le is apparently quite simple like all the tables and is based on square numbers, the SQUARE OF 12 and is by evolution, one of the most important square numbers. Here we can find CYCLE, PRICE AND TIME thanks to angles and grades, to show past and future support and resistance.
The CCI Divergence is a reasonably useful indicator in itself, but it is even more effective when used with divergence pattern trading. The CCI Divergence indicator signal is one of the most potent signals among the indicators that exist in the market. Here is new version for Divergence Indicator using CCI method, with more improvements. Divergences indicate a potential investment point because the directional moment does not confirm the price. A bullish divergence occurs when the underlying va
"Тренд - друг трейдера" . Это одна из самых известных пословиц в трейдинге, потому что правильное определение тренда может помочь заработать. Однако проще сказать о торговле по тренду, чем сделать, потому что многие индикаторы основаны на развороте цены, а не на анализе тренда. Они не очень эффективны при определении периодов тренда или в определении того, сохранится ли этот тренд. Мы разработали индикатор Trendiness Index , чтобы попытаться решить эту проблему. Индикатор определяет силу и напра
Master scalping M1 -инновационный индикатор, использующий алгоритм для быстрого и точного определения тренда.Индикатор рассчитывает время открытия и закрытия позиций, алгоритмы индикатора позволяют находить идеальные моменты для входа в сделку (покупки или продажи актива), повышающие успешность сделок у большинства трейдеров. Преимущества индикатора: Прост в использовании, не перегружает график не нужной информацией. Возможность использования  как фильтр для любой стратегии. Работает на рынке а
Reversal Pattern Pro
Boonyapagorn Rodvattanajinda
Reversal Patterns Pro Reversal Patterns Pro is a Price Action (PA) analytical tool that scans the reversal patterns.  - Finds and marks the most dependable Japanese candlestick patterns in real-time. - Supports all time frames (Best for Scalping) - Doesn't repaint making it an exceptional indicator for Expert Advisors. Input parameters : - Support & Resistance Mode ( true or false ) for enabling advanced filtering - Donchian Period - RSI Period - RSI Oversold Level - RSI Overbought Level - Al
Индикатор RTrends делает две вещи: во-первых, производит автоматическую (на лету) разметку графика цены путем нанесения линий трендов и, во-вторых, дает медвежьи и бычьи сигналы. Разметка отражает фрактальную природу рынка. На график одновременно наносятся тренды с разных временных горизонтов. Таким образом, трейдер, имея перед глазами только один график, может видеть линии трендов со старших таймфреймов. Линии, в зависимости от горизонта, различаются по цвету и толщине: чем старше горизонт, тем
The Chaikin Oscillator is a technical indicator developed by Marc Chaikin that combines price and volume data to measure the accumulation and distribution of a financial instrument. It aims to identify potential buying and selling opportunities in the market. The Chaikin Oscillator is calculated by subtracting a 10-day exponential moving average of the Accumulation Distribution Line (ADL) from a 3-day exponential moving average of the ADL. Here's how to use the Chaikin Oscillator indicator in tr
TWO PAIRS SQUARE HEDGE METER INDICATOR Try this brilliant 2 pairs square indicator It draws a square wave of the relation between your two inputs symbols when square wave indicates -1 then it is very great opportunity to SELL pair1 and BUY Pair2 when square wave indicates +1 then it is very great opportunity to BUY pair1 and SELL Pair2 the inputs are : 2 pairs of symbols         then index value : i use 20 for M30 charts ( you can try other values : 40/50 for M15 , : 30 for M30 , : 10 for H1 ,
Устали от построения линий поддержки и сопротивления? Сопротивление поддержки - это мульти-таймфреймовый индикатор, который автоматически обнаруживает и отображает линии поддержки и сопротивления на графике с очень интересным поворотом: поскольку ценовые уровни тестируются с течением времени и его важность возрастает, линии становятся более толстыми и темными. [ Руководство по установке | Руководство по обновлению | Устранение неполадок | FAQ | Все продукты ] Повысьте технический анализ в одноч
IconTradeSL.  Возможность выставлять sl по уровням. В индикаторе установлена возможность показывать историю уровней на графике. Возможность выставлять sl по уровням. Настройки индикатора: ЦВЕТ_BAR - цвет баров по которым ищем SL ЦВЕТ_Тек_BAR - Purple;//цвет текущего бара BAR - поиск в последних BAR барах (по умолчанию 200) show_bar - показывать бары по которым ищем SL
Advance Currency Meter is a currency meter that detects strong market trends. This indicator is good for scalping, intraday trading and swing trading. The indicator will detect short term to long term market trends. This will give you good insight which currencies are best to trade as of the moment. Note : Kindly contact me before you make any purchases. This won't work on your account without my permission. Note :   Works well with my MACD Currency Strength Meter
Excessive Momentum Indicator – один из немногих индикаторов, измеряющий чрезмерный импульс на финансовом рынке с использованием ценового поведения. Индикатор полностью разработан Янгом Хо Сео (Young Ho Seo). Этот показатель демонстрирует концепцию и практическое применение Равновесной фрактальной волны (Equilibrium Fractal Wave). Чрезмерный импульс на рынке может рассказать о психологии толпы и помочь спрогнозировать направление цены. Таким образом, вы можете основывать свои торговые решения на
Noize Absorption Index - is the manual trading system that measures the difference of pressure between bears forces and bulls forces. Green line - is a noize free index that showing curent situation. Zero value of index shows totally choppy/flat market.Values above zero level shows how powerfull bullish wave is and values below zero measures bearish forces.Up arrow appears on bearish market when it's ready to reverse, dn arrow appears on weak bullish market, as a result of reverse expectation. S
The indicator provides a superior alternative to price action analysis. It enables the identification of normalized patterns, which are then transformed into a graphical representation to forecast future steps within a time series. In the top-left corner, you'll find information regarding the expected prediction accuracy, determined through a complex MSQE calculation. You have the flexibility to adjust the time window, making it easy to validate the indicator's performance. Additionally, you can
All Symbols   AND  All Time frames Scan                                                                                                                 Document Introduction   The ABCD is a basic harmonic pattern. The ABCD pattern is a visual, geometric chart pattern comprised of three consecutive price swings. It looks like a diagonal lightning bolt and can indicate an upcoming trading opportu
It will be the best tool for you to make a profit! Through unique algorithms You're going to see an amazing amount of right trading signals Make huge profits every day and realize more possibilities!   Like the car no money to buy it, the love of the girls dare not to pursue?Or the credit card bill is not paid, the rent does not have the extra money to settle?Or are you fed up with being bossed around by your boss and Hope to get more people's respect?Can't afford to buy the things you want ? wa
Суть данного индикатора - анализ и предсказание котировок с помощью преобразования Фурье. Индикатор раскладывает ряд цен на гармоники и вычисляет их продукт на следующих барах. Вы можете использовать индикатор как самостоятельный продукт, однако для улучшения качества предсказания создан другой, родственный индикатор -  FreqoMaster  - который вызывает FreqoMeterForecast в качестве движка и объединяет результаты работы нескольких экземпляров FreqoMeterForecast для различных частотных диапазонов.
Индикатор SMC Venom Model BPR — профессиональный инструмент для трейдеров, работающих в рамках концепции Smart Money (SMC). Он автоматически идентифицирует на графике цены два ключевых паттерна:  FVG (Fair Value Gap) — комбинация их трёх свечей, в которой имеется разрыв между первой и третьей свечой. Формирует зону между уровнями, где отсутствует поддержка объемов, что часто приводит к коррекции цены. BPR (Balanced Price Range)— комбинация двух FVG-паттернов, образующих «мост»  — зону пробоя и
Owl smart levels
Sergey Ermolov
4.24 (37)
Версия MT5  | Как установить?  | FAQ Индикатор Owl Smart Levels   – это полноценная торговая система внутри одного индикатора, которая включает в себя такие популярные инструменты анализа рынка как усовершенствованные   фракталы Билла Вильямса , Valable ZigZag, который строит   правильную волновую структуру   рынка, а также  уровни Фибоначчи,   которые   отмечают точные уровни входа в рынок и места взятия прибыли. Подробное описание стратегии Инструкция по работе с индикатором Советник-помошник
С этим продуктом покупают
Это индикатор за самые большие деньги. Он обладает исключительными характеристиками. Какой бы интерес ни был на рынке, вы увидите его.  Почти во всех случаях он дает вам только долгосрочный взгляд на рынок, но не обманывайтесь, думая, что он привязан к событиям. Ничего подобного. Он находит, где на рынке находится наибольший интерес, и показывает его вам. Не забывайте, что самые большие деньги (проценты) не отображаются на рынке каждый день. Это то, с чем вы еще не сталкивались. Цена разумная.
Risk Reward ratio indicator for MT4  BING Risk Reward indicator is a powerful, basic, very needed tool for every trader. Clearly visualize Open Price , Stop Loss , and Top Profit levels on your graphs with easy-to-see colors and trendlines. Does BING Risk Reward show alerts? Of course! BING Risk Reward Indicator offers all Alerts available for the MT4 platform(Email, Popups, Sound, and Push). It shows alerts on Open Price , Stop Loss , and Top Profit. That way, besides easily seeing what is go
Скачайте индикатор уровней поддержки и сопротивления( Support and resistance ). Индикатор рисует горизонтальные и трендовые уровни поддержки и сопротивления. Настройки индикатора: Trends - Установка режима отображения трендовых или горизонтальных уровней поддержки сопротивления Yes - отображает только трендовые уровни No - отображает только горизонтальные уровни UseResource - Установка режима использования встроенных в индикатор ресурсов. Yes - использовать индикатор ZigZag из ресурсов продукта.
The indicator of a Professional Trader - это стрелочный индикатор для прогнозирования направления движения цены. Над этим индикатором я работаю с 2014 года.  Вы можете использовать этот индикатор в качестве основного, использовать его сигналы для входа и использовать его в качестве единственного индикатора для поиска точек входа. О продукте: Рекомендуемый TF [H4-D1-W1] . Индикатор предсказывает направление движения следующей свечи.  Подходят множество инструментов; Гибкость в настройках под ра
Торговая система для ручной торговли The [GRAFF] III основана на многочисленных индикаторах MetaTrader (MT4). Собранные вместе, эти индикаторы представляют собой эффективный торговый инструмент. Система включает в себя более 20 различных пользовательских индикаторов, которые были тщательно отобраны и протестированы на длительном историческом периоде. Каждый конкретный индикатор основан на той или иной формуле расчета. Таким образом вся система настроена таким образом, чтобы отсеивать ложные сигн
Данный индикатор используется для определения тренда. Используются три скользящие средние и ADX. Оснащен системой оповещений: звуковые сигналы, оповещения на электронную почту и три типа алертов, включая отправку сообщений на мобильный телефон. Наилучший результат зафиксирован на M5. Система оповещений активируется при достижении трендом установленного значения. Индикатор работает только с CFD. Входные параметры SoundAlarm = true - звуковое оповещение Sendmail=true - отправка уведомления о сигн
Данный индикатор используется для определения тренда. Используются три скользящие средние и ADX. Оснащен системой оповещений: звуковые сигналы, оповещения на электронную почту и три типа алертов, включая отправку сообщений на мобильный телефон. Наилучший результат зафиксирован на M5. Система оповещений активируется при достижении трендом установленного значения. Индикатор работает только с Forex-символами. Входные параметры SoundAlarm = true - звуковое оповещение Sendmail=true - отправка уведом
Данный индикатор используется для определения тренда. Используется стандартный индикатор MACD. Оснащен системой оповещений: звуковые сигналы, оповещения на электронную почту и три типа алертов, включая отправку сообщений на мобильный телефон. Лучшие результаты были получены на 5-минутном графике. Система оповещений активируется при достижении трендом установленного значения. Работает на Форекс с CFD и другими инструментами. Первое значение - быстрое EMA. Значение по умолчанию 26. Входные параме
The arrows are calculated with: -     2 Parabolic  parameters -     2 ADX parameters -     4 Stochastic parameters We recommend to combine it with Parabolic, ZigZag or Elliot waves indicator. Always trade the trend! If you make sure to draw your trend lines and support/resistance zones you will just have to wait for the signal to appear. Take the trade. For Binary Options it is advisable to set the expiry time to 5-15 min in M1 chart. THIS INDICATOR IS ZERO REPAINT Best assets to trade: - EUR
Let´s try to make some real money! Call me profit addicted. I thought why not try to make THE dream come reality. With discipline, a clear strategy and this indicator I focus on entering the perfect trades. This indicator is very easy to use as you will get perfect entry points for Put or Call trades. The arrows are calculated with: -     Momentum  parameters -     Candle stick patterns -     Fundamental Price action We recommend to combine it with Parabolic, ZigZag or Elliot waves indicator
Golden Chip provides Basic Market Structure, Fibonacci, supply and Demand Zones. Letting you identify when a sell off point is approaching or whne a buy opportunity is arriving. The awesome thing about Golden Chip is that, you will see rejection levels or continuation before ANYBODY ! This indicator moves directly with price and lines up perfectly with the Chart. Some indicators would lag but NOT this one ! Golden Chip is amazing for Clean chart (Naked Chart). GOLDEN CHIP IS ONLY ON METATRADER (
После покупки свяжитесь со мной через mql5. Так мы сможем убедиться, что дашборд корректно работает на вашей платформе. Вложенные зоны Forex предназначены для получения всех ключевых уровней на одном графике, чтобы найти области отскока и прорыва. Все, что вы можете себе представить, переносится из нескольких таймфреймов на одну панель мониторинга, чтобы определить вложенные области слияния и спроса. Если приборная панель показывает высокие баллы, это означает четкое определение поддержки и сопр
You can fins our other products from link : https://www.mql5.com/en/users/drbastem/seller   Also, you can ask all your questins from email : haskayafx@gmail.com or mobile : +90 530 867 5076 or @MehmetBastem    on telegram application This system created by using Corrected MACD, Different time zone support and resistant points,  Parabolic Sars, Bollinger band, 4 moving average, stochastic oscillator and ADX. In this system, Using parabolic Sars reverse bar count,  Pips difference between clos
This indicator prepared by using 57 days moving averagr and least square method. It can only work for 1 hr time interval. Once a signal created. It is creating order and 2 limit orders. It works in CFD pairs as well as in Forex pairs. You can fins our other products from link : https://www.mql5.com/en/users/drbastem/seller Also, you can ask all your questins from email : haskayafx@gmail.com or mobile : +90 530 867 5076 or @MehmetBastem on telegram application This system is for Long term and pr
This system created by using Corrected MACD,ADX, Different time zone support and resistant points,  Parabolic Sars, Bollinger band, 9 moving average, stochastic oscillator and ADX. In this system, Using parabolic Sars reverse bar count,  Pips difference between closing price and last parabolic Sars in the direction of signal and Trend strength.   Note that this system is not martingale, this system is creating limit order.    Best result for the orders are 25 Pips in USD, 50 Pips in GBP. Best
This system created by using Corrected MACD,ADX, Different time zone support and resistant points,  tree Parabolic Sars,two Bollinger band, 3 moving average, stochastic oscillator and ADX. In this system, Using parabolic Sars reverse bar count,  Pips difference between closing price and last parabolic Sars in the direction of signal and Trend strength.   Note that this system is not martingale, this system is creating limit order.    Best result for the orders are 45 Pips in USD, 75 Pips in G
This system created by using  Stochastic oscillator and moving average.  Entrance value and take profit values can be seen by system.  This is system for Long term and profitable. this system can be used for 15 minutes time frame. This system is not  repaints.         This system is for Long term and profitable.  Signals are shown as arrows. as an optional,  you can set a voice alarm or email notification  You can fins our other products from link : https://www.mql5.com/en/users/drbastem/seller
This indicator prepared by using 311,1298 days moving average and Calculates the Envelopes.    This system can be used for 5M time frame.     This system is for Long term and profitable.    Signals are shown as arrows. as an optional,    you can set a voice alarm or email notification    You can fins our other products from link : https://www.mql5.com/en/users/drbastem/seller    Also, you can ask all your questins from email : haskayafx@gmail.com or mobile : +90 530 867 5076 or @MehmetBastem   
This indicator prepared by using 311,1298 days Haskaya Trend Bandse and Calculates the strand ADX.    This system can be used for 5M time frame.     This system is for Long term and profitable.    Signals are shown as arrows. as an optional,    you can set a voice alarm or email notification    You can fins our other products from link : https://www.mql5.com/en/users/drbastem/seller    Also, you can ask all your questins from email : haskayafx@gmail.com or mobile : +90 530 867 5076 or @Mehm
This indicator is created by considering volume divergence with price that is outcome of Bollinger band and Envolpes indicators crossing. It won’t repaint.  It is providing 1 market and three pending orders.  If it is followed with patient, it is providing remarkable profit at the end.  This indicator will be on sale soon on expert advisor. Target is calculated for buy orders as follow 1. 50 pips standard 2. Top Bollinger band 3. Sell Signal Target is calculated for buy orders as follow 1. 50
https://youtu.be/t3SLLgcEEPM This indicator prepared by  using Moving Averages, Bollingers Bands .    This system can be used for 5M time frame and Gold Symbols (XAUUSD).     This system is for Long term and profitable.    Signals are shown as arrows. as an optional,    you can set a voice alarm or email notification    You can fins our other products from link : https://www.mql5.com/en/users/drbastem/seller    Also, you can ask all your questins from email : haskayafx@gmail.com or mobile : +90
This indicator prepared by  using Haskayafx Target Line Indicators .    This system can be used for 30M time frame and All Symbols.     This system is for Long term and profitable.    Signals are shown as arrows. as an optional,    you can set a voice alarm or email notification    You can fins our other products from link : https://www.mql5.com/en/users/drbastem/seller    Also, you can ask all your questins from email : haskayafx@gmail.com or mobile : +90 530 867 5076 or @MehmetBastem 
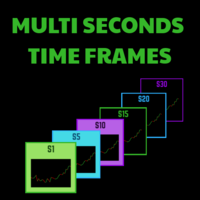
Seconds timeframe generator for MT4  (S1, S5, S10, S15, S20, S30). Features  1. Indicator generates timeframes in real time, with each new tick on the spot. 2. Indicator is also measuring point distance from extreme to extreme when hovered "This additionally shows us how strong movements are". Advantages 1. Easy to spot best entry and exit points. 2. You can easily trade news releases where market is very volatile. 3. You can also easily trade very slow market conditions and spot tre
This system never paints.   This system created by using Envolpes bands and reverse bar count.   This indicator is only working in M5 period.   This system is for long term and profitable.   Signals are shown as arrows. as an optional limit orders.   You can set a voice alarm or email notification.   You can fins our other products from link : https://www.mql5.com/en/users/drbastem/seller   Also, you can ask all your questins from email : haskayafx@gmail.com or mobile : +90 530 867 5076 or @Meh
PROMOÇÃO LIMITADA, NA COMPRA DE 1 INDICADOR VOCÊ LEVA CLUBINARIAS 6.0 , 5.1 e DonForex DE BRINDE!! ATÉ FINAL DO MÊS! -NA HORA DA COMPRA SELECIONAR COMBINAR COM O VENDEDOR OU BUSCAR PESSOALMENTE, A ENTREGA É DIGITAL EM POUCOS SEGUNDOS ==> VEJA O VIDEO PARA TIRAR AS SUAS DUVIDAS <== ==> VÍDEO OPERANDO NO YOUTUBE ROBÔ FEITO COM MUITO ESFORÇO E CARINHO E QUE ESTA TRAZENDO ÓTIMOS LUCROS APESAR DE EXISTIREM PESSOAS QUE APENAS VENDEM ROBÔS FAKES DE OPERAÇÕES , ACREDITO QUE SERIA MUITO BOM DA MI
This system never paints.   This system uses 30 standard MT4 indicators.   This indicator is only working in M5 period.   This system is for long term and profitable.   Signals are shown as arrows. as an optional limit orders.   You can set a voice alarm or email notification.   You can fins our other products from link : https://www.mql5.com/en/users/drbastem/seller   Also, you can ask all your questins from email : haskayafx@gmail.com or mobile : +90 530 867 5076 or @MehmetBastem    on teleg
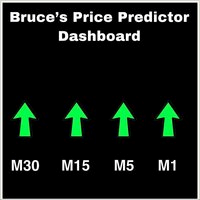
This is a Dashboard Indicator based on Bruce's Price Predictor Indicator . This Dashboard will Give you a visual to see the trend direction without having to flip through timeframes, so you can always be trading in direction of the trend, with little effort.  I Recommend   www.CoinexxBroker.com  as a great broker and the one I personally use *Non-Repainting Dashboard Arrows *For Desktop MT4 Only *Great For Scalping *Great For Swing Trading *Dashboard Arrow Entry Alerts *Dashboard Arrow Signals
Ежедневный скальпер тренда (DTS) Этот индикатор является частью систем RPTrade Pro Solutions. DTS — это индикатор дневного тренда, использующий ценовое действие, динамическую поддержку и сопротивление. Он предназначен для использования любым, даже абсолютный новичок в торговле может использовать его. НИКОГДА не перекрашивает. Показания даны от близкого к близкому. Предназначен для использования в одиночку, никаких других индикаторов не требуется. Дает вам тренд и потенциальный Take Profit в на
Namiri Trade Engine is an ALL in ONE trading system that combines price structure, volume pressure, market condition & risk management to give you the BEST opportunities for A+ trade setups with auto lot size WAIT FOR YOUR A+ SETUP || ONLY TAKE YOUR A+ TRADE || RINSE REPEAT YOUR A+ MOVE Chart Features Panel - Shows the asset, market, price, pip, account, trade & profit|loss information Structure - Shows areas of support & resistance Risk Management - Shows risk analysis period of 100 bars, buy
***** The REAL , ORIGINAL, Non-Repainting, Non-Delaying, Arrow Trade Entry indicator for Very Low-Risk market execution ***** ***This is the Golden standard in arrow indicators for MT4.*** BING Setup Arrows Indicator(BSA) will show easy-to-read High Probability trading situations with Non-Repainting , Non-Delaying , Up or Down arrows on the graph.  So simple, it's brilliant. Always shows very good trading setups, no flashy colors, confusing configurations, hard-to-read dashboards, etc.  Perfec
Другие продукты этого автора
Volume Clarity Pro The Volume Clarity Pro provides clarity in the movement of price for any financial instrument, including currency pairs, cryptocurrencies, equities, commodities and indices. The Volume Clarity Pro maps out where price is consolidating, retracing, resisting or settled in areas of support. The Volume Clarity Pro accurately displays the month's price action, offering crucial data about your selected trading pair for chart analysis and trade initiation.  The Volume Clarity Pro is
Chart Clarity Dashboard The Chart Clarity Dashboard provides clear insights into price movements for various financial instruments like currency pairs, cryptocurrencies, equities, commodities, and indices. This dashboard displays detailed price information in real-time, making it easier for traders to make decisions quickly. It shows price movements down to the second, giving you essential data before you trade or analyze charts. Chart Clarity Dashboard allows you to monitor price changes acros
Liquidity Pro The Liquidity Pro highlights liquidity and supply & demand zones in any financial instrument, including currency pairs, cryptocurrencies, commodities and indices. The Liquidity Pro highlights "Supply & Demand" zones, down to the present minute, providing optimal trade entries and exits, when conducting chart analysis or initiating trades.  The Liquidity Pro algorithm automatically detects your trading pair, enabling you to instantly view liquidity, supply, and demand zon es. The i
Chart Clarity Dashboard The Chart Clarity Dashboard provides clear insights into price movements for various financial instruments like currency pairs, cryptocurrencies, equities, commodities, and indices. This dashboard displays detailed price information in real-time, making it easier for traders to make decisions quickly. It shows price movements down to the second, giving you essential data before you trade or analyze charts. Chart Clarity Dashboard allows you to monitor price changes acro
Volume Clarity Pro The Volume Clarity Pro provides clarity in the movement of price for any financial instrument, including currency pairs, cryptocurrencies, equities, commodities and indices. The Volume Clarity Pro maps out where price is consolidating, retracing, resisting or settled in areas of support. The Volume Clarity Pro accurately displays the month's price action, offering crucial data about your selected trading pair for chart analysis and trade initiation.  The Volume Clarity Pro is
Фильтр:
David T
303
David T 2024.09.27 05:10 
 

After using it while limited to my on screen time due to working full-time...I can see that with a short learning curve how a great addition this can be to a trader. It makes for a great confirmation indicator as to change in direction . In my view it rivals SMC or regular support and resistance zones. Great seller communication.

Ответ на отзыв
Версия 7.0 2025.03.18
Changes to new version:

1. Additional modifications to the algorithm based on machine learning backtesting results
Версия 6.0 2025.02.28
Changes to new version:

1. Additional changes to algorithm for enhanced accuracy.
Версия 5.0 2025.01.06
Changes to new version:

1. Improved algorithm for enhanced accuracy.
Версия 4.0 2024.12.21
Changes to new version:

1. The interval period allows you to view liquidity, supply, and demand zones for up to 3 weeks, enabling traders to analyze the current week, the previous week, and the week before that.

2. The Liquidity Pro algorithm now automatically detects your trading pair when the indicator is loaded onto your chart, enabling you to instantly view liquidity, supply, and demand zones. Currently, the indicator is only compatible with the most popular trading pairs listed below, with additional pairs being added based on user feedback and suggestions. If Liquidity Pro is unable to detect a trading pair, a notification will be displayed in the top left corner of the chart.

Indexes
US30
NAS100
US500
HK50
GER30
UK100
FRA40
JPN225
EUSTX50

Currency Pairs
EUR/USD
GBP/USD
USD/CHF
AUD/USD
USD/CAD
NZD/USD
USD/JPY
CHF/JPY

Commmodities
XAU/USD
XAG/USD
USOIL
UKOIL

Cryptocurrency
BTC/USD
Версия 2.0 2024.11.16
Changes to new version:

1. Rectangular zones now highlight liquidity in real time, representing specific price levels with significant tally counts.

Examples:

* Sky blue rectangular zones display "Blue Numeric Values with 50+ Tally Counts" indicating liquidity and a surplus of buyers.
* Pink rectangular zones display "Red Numeric Values with 50+ Tally Counts" indicating liquidity and a surplus of sellers.
* Blue rectangular zones display "Blue Numeric Values with 100+ Tally Counts" indicating greater liquidity and a surplus of buyers.
* Red rectangular zones display "Red Numeric Values with 100+ Tally Counts" indicating greater liquidity and a surplus of sellers.

2.You can now customize the tally count to your preferred setting, though it is "Recommended" to use the default values.

3. You can also customize the colors of the rectangular zones to match your preferences.

4. An added feature allows you to hide the tally panel/window and view only the rectangular liquidity zones, providing real-time liquidity visualization.