• Обзор
  • Отзывы
  • Обсуждение
  • Что нового

Buysell stars

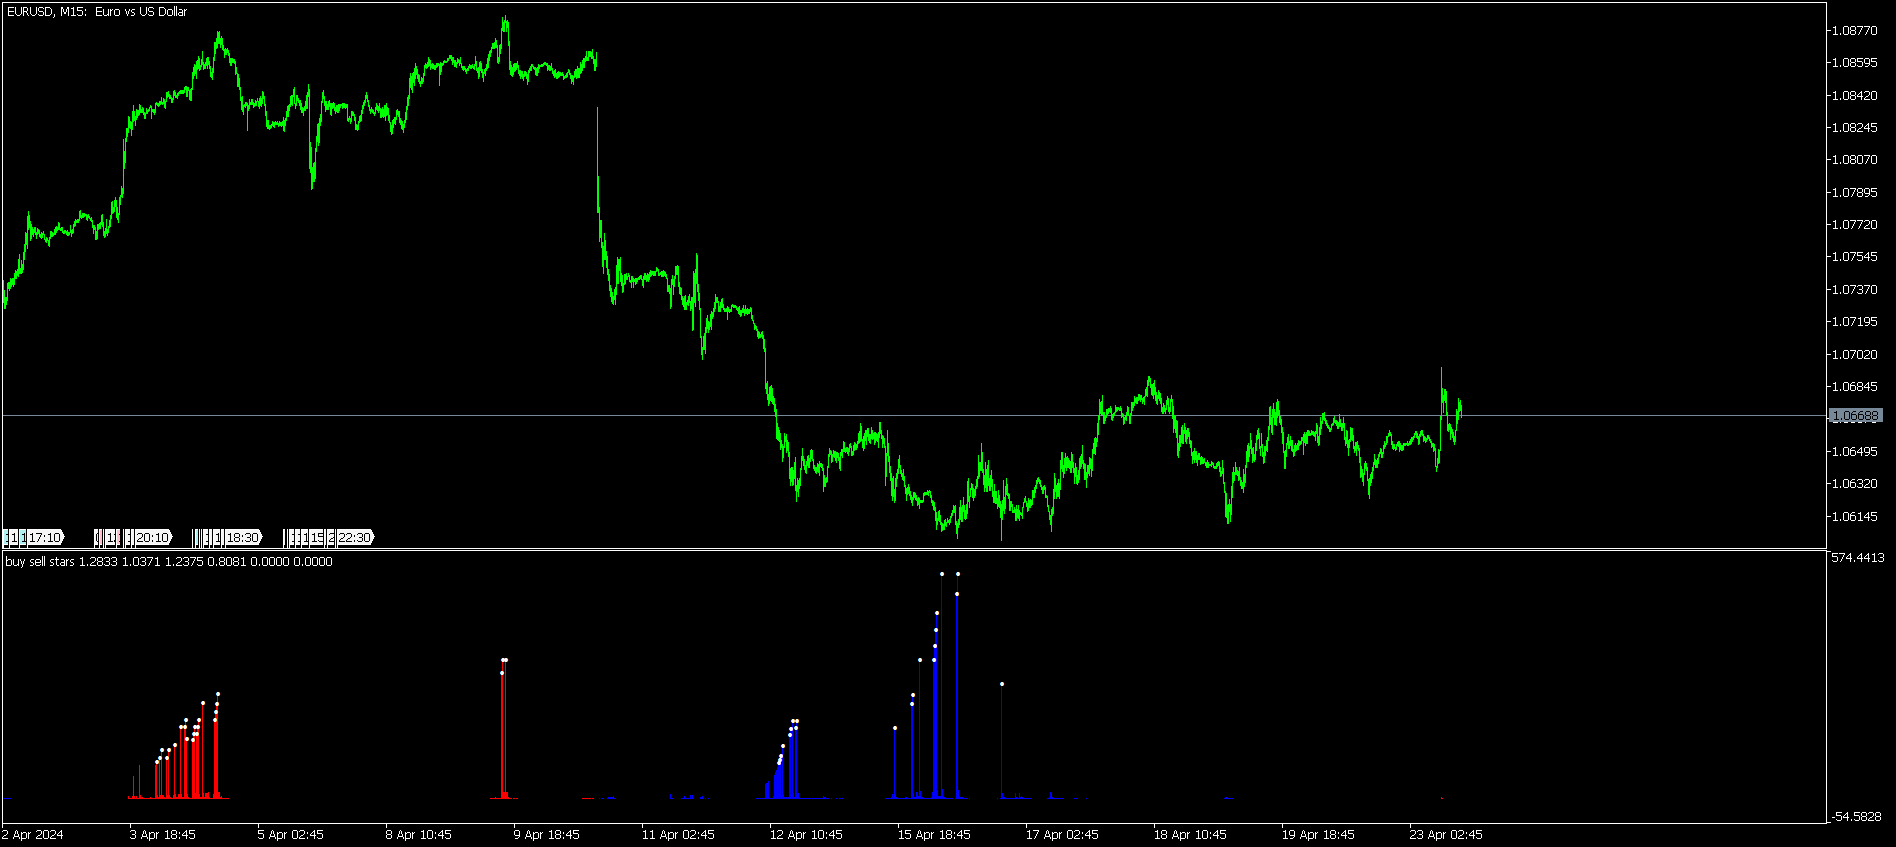
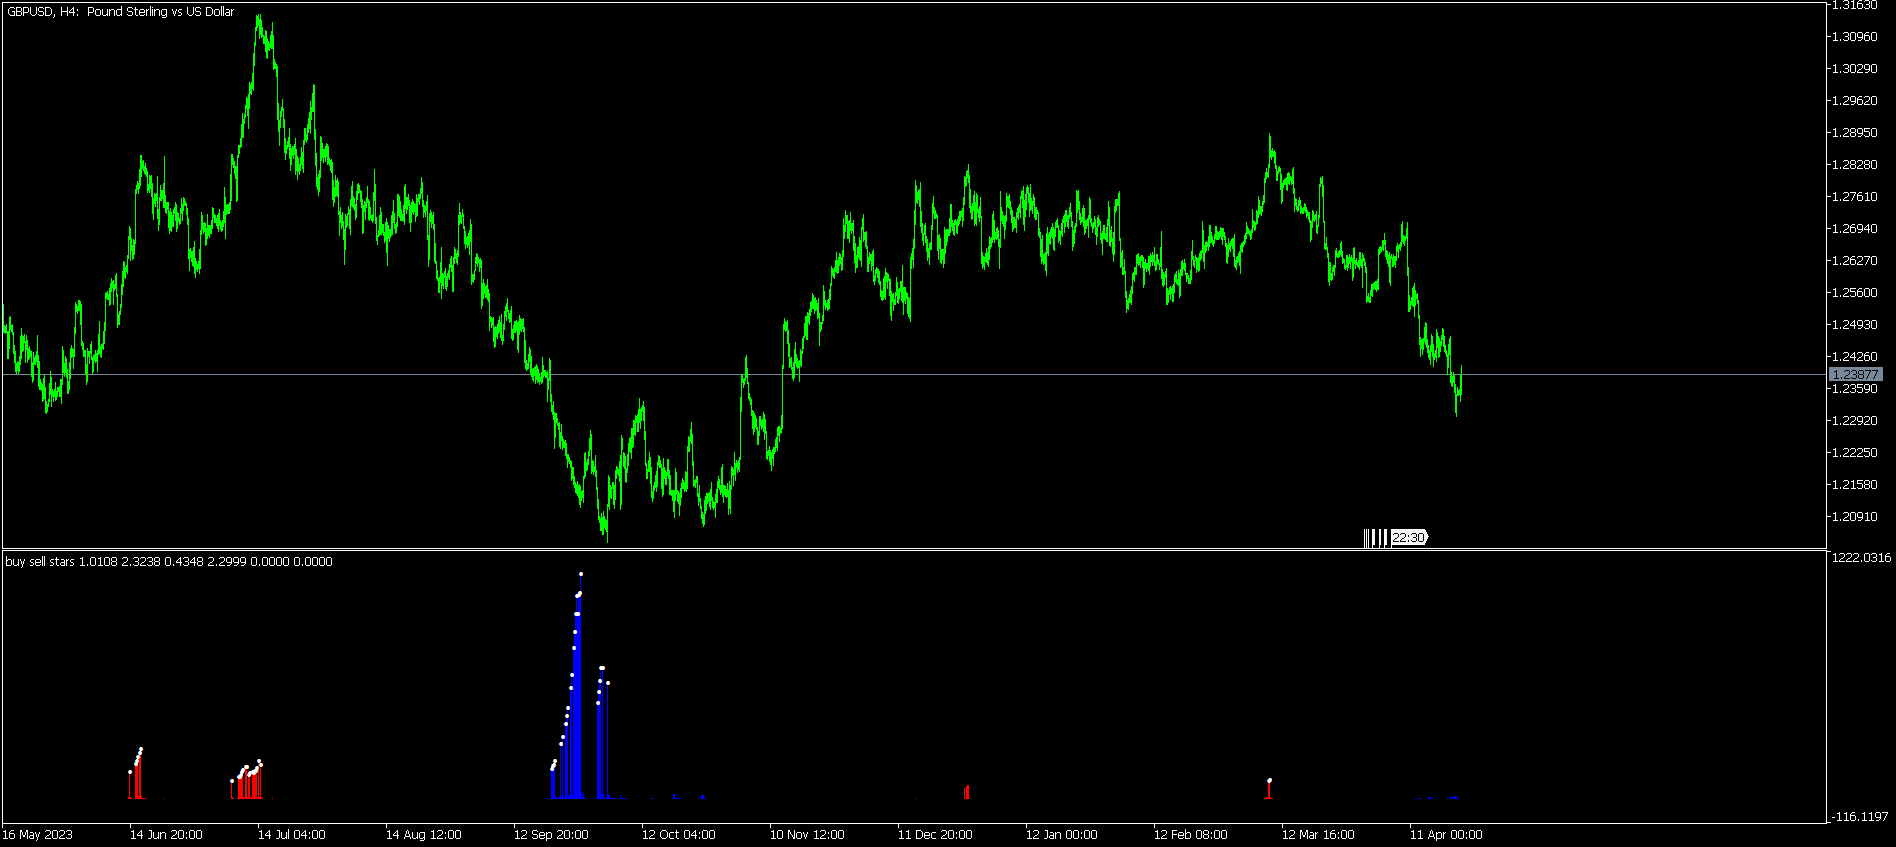
buy sell stars  is a no repaint ,all pairs and all time frames indicator.

first set control periot 500 to see signals.

it need minimum 500 bars on charts.

concept of indicator is wery easy.

if white point on the red histogram that means sell .

if white point on blue histogram that means buy..

indicator is no repaints.but some times makes drawdown.

so case it need to look one upper time frame.

indicator is not guarantie the win..


Рекомендуем также
Market Profile Introducing the Market Profile MetaTrader Indicator—your gateway to mastering market dynamics with precision and insight. This powerful tool delivers a classic Market Profile analysis, revealing price density over time and highlighting crucial levels, including the value area and control value for any trading session.  Compatible with timeframes from M1 to D1, it adapts to daily, weekly, monthly, or even intraday sessions, offering you unmatched flexibility. Lower timeframes pro
To get access to MT4 version please click here . This is the exact conversion from TradingView: " WaveTrend" by LazyBear. This is a light-load processing and non-repaint indicator. All input options are available. Buffers are available for processing in EAs. You can message in private chat for further changes you need. The filling area option is omitted to fit into MT5 graphics.
An ICT fair value gap is a trading concept that identifies market imbalances based on a three-candle sequence. The middle candle has a large body while the adjacent candles have upper and lower wicks that do not overlap with the middle candle. This formation suggests that there is an imbalance where buying and selling powers are not equal. Settings Minimum size of FVG (pips) -> FVGs less than the indicated pips will be not be drawn Show touched FVGs Normal FVG color -> color of FVG that hasn't
FREE
Профиль Рынка (Market Profile) определяет ряд типов дней, которые помогают трейдеру распознать поведение рынка. Ключевая особенность - это область значений (Value Area), представляющая диапазон ценового действия, в котором произошло 70% торговли. Понимание области значений может помочь трейдерам вникнуть в направление рынка и установить торговлю с более высокими шансами на успех. Это отличное дополнение к любой системе, которую вы возможно используете. Blahtech Limited представляет сообществу Me
Before installing the HeatMap indicator make sure you are using a broker that gives you access to the Depth of market (DOM) !! This indicator creates a heatmap on your chart allowing you to see the buy or sell limit orders easily and in real time. You have the possibility to change the setting and the colors of the HeatMap in order to adapt to all markets and all charts. Here is an example of a setting you can use with the NASDAQ100 on the AMPGlobal broker :  https://www.youtube.com/watch?v=x0
VR Grid Mt5
Vladimir Pastushak
3.43 (7)
Индикатор VR Grid разработан для создания графической сетки с настройками, определяемыми пользователем. В отличие от стандартной сетки VR Grid используется для построения круглых уровней . В зависимости от выбора пользователя, шаг между круглыми уровнями может быть произвольным. Кроме того, в отличие от других индикаторов и утилит, VR Grid сохраняет положение сетки даже при изменении временного периода или перезагрузке терминала. Настройки, set файлы, демо версии, инструкции, решение проблем, мо
FREE
First and foremost, the Insight Flow Indicator stands out as a Non-Repainting, Non-Redrawing, and Non-Lagging tool. This makes it a prime choice for both manual and algorithmic trading, ensuring reliable and consistent signals. User Manual: Settings, Inputs, and Strategy The Insight Flow Indicator leverages price action, strength, and momentum to provide a clear edge in the market. Equipped with advanced filters, it eliminates noise and false signals, enhancing trading potential. By using multip
BoxChart MT5
Evgeny Shevtsov
5 (7)
Рынок несправедлив, хотя бы потому, что всего лишь 10% игроков управляют 90% капитала. У рядового трейдера мало шансов, чтобы противостоять этим «хищникам». Но выход есть, необходимо всего лишь перейти на другую сторону, необходимо находиться в числе этих 10% «акул», научиться распознавать их намерения и двигаться вместе с ними. Объем - это единственный опережающий фактор, который безупречно работает на любом периоде и любом торговом инструменте. Сначала зарождается и накапливается объем, и толь
Индикатор Supply Demand использует предыдущее ценовое действие для выявления потенциального дисбаланса между покупателями и продавцами. Ключевым является определение зон с лучшими возможностями, а не просто вероятностей. Индикатор Blahtech Supply Demand обеспечивает функционал, не доступный ни в одной платформе. Этот индикатор 4 в 1 не только выделяет зоны с более высокой вероятностью на основе механизма оценки силы по множественным критериям, но также комбинирует его с мульти-таймфреймовым ана
Order Book, известный также как Market Book, глубина рынка, стакан цен, Level 2, - это предоставляемая брокером динамически обновляемая таблица с данными по текущим объемам торговых заявок на покупку и продажу для различных уровней цен вблизи Bid и Ask конкретного финансового инструмента. MetaTrader 5 предоставляет возможность трансляции стакана цен , но только в реальном времени. Данный индикатор OrderBook Cumulative Indicator позволяет аккумулировать данные стакана онлайн и визуализировать их
Индикатор строит текущие котировки, которые можно сравнить с историческими и на этом основании сделать прогноз ценового движения. Индикатор имеет текстовое поле для быстрой навигации к нужной дате. Параметры : Symbol - выбор символа, который будет отображать индикатор; SymbolPeriod - выбор периода, с которого индикатор будет брать данные; IndicatorColor - цвет индикатора; Inverse - true переворачивает котировки, false - исходный вид; Далее идут настройки текстового поля, в которое можн
You can see Binance Spot data instantly in Metatrader 5 and it allows you to use all the features that Metatrader has provided to you. You can access the data of all symbols listed on Binance Futures. Don't forget to set the timezone. Binance it's 00:00 UTC. You need to fix it according to your own country You need to install the free Binance Spot Symbol List plugin. https://www.mql5.com/tr/market/product/83507 After loading, it automatically downloads the data of the cryptos in the market obser
Market Profile Heat indicator  — is a classic Market Profile implementation that can show the price density over time, outlining the most important price levels, value area, and control value of a given trading session. This indicator can be attached to timeframes between M1 and D1 and will show the Market Profile for daily, weekly, monthly, or even intraday sessions. Lower timeframes offer higher precision. Higher timeframes are recommended for better visibility. It is also possible to use a f
Based on the trading model/strategy/system of gold double-position hedging and arbitrage launched by Goodtrade Brokers, problems encountered in daily operations: 1. Account B immediately places an order immediately following account A. 2: After account A places an order, account B will automatically copy the stop loss and take profit. 3: Account A closes the position of Account B and closes the position at the same time. 4: When account B closes the position, account A also closes the position.
Этот продукт позволит Вам выгодно приобреcти и использовать два самых популярных продукта для анализа объемов заявок и сделок на биржевых рынках: Actual Depth of Market Chart Actual Tick Footprint Volume Chart Данный продукт вобрал в себя всю мощь каждого отдельного индикатора и оформлен в виде одного файла. Функционал продукта Actual COMBO Depth of Market AND Tick Volume Chart полностью идентичен оригинальным индикаторам. Вы оцените удобство объединения этих двух продуктов в один супер-индикато
The Volume by Price Indicator for MetaTrader 5 features Volume Profile and Market Profile TPO (Time Price Opportunity). Volume and TPO histogram bar and line charts. Volume Footprint charts. TPO letter and block marker collapsed and split structure charts. Static, dynamic and flexible range segmentation and compositing methods with relative and absolute visualizations. Session hours filtering and segment concatenation with Market Watch and custom user specifications. Graphical layering, positio
Description: The Volume Profile displays detailed informations of historical trading activities at certain price levels (Market Profile). Locate the areas with the best prices in the market and get an advantage over other market participants. Features: Customizable Market Profile Shows the "fair" Value Area with 70% of all Volume Shows critical low volume zones Shows VPOC, VAL and VAH Points integrated resource management to reduce the load while working with multiple charts Works on all tim
Market profile was developed by Peter Steidlmayer in the second half of last century. This is a very effective tool if you understand the nature and usage. It's not like common tools like EMA, RSI, MACD or Bollinger Bands. It operates independently of price, not based on price but its core is volume. The volume is normal, as the instrument is sung everywhere. But the special thing here is that the Market Profile represents the volume at each price level. 1. Price Histogram The Price Histogram
TP SL Bot – утилита, которая автоматически устанавливает Stop Loss и Take Profit по вновь открытым ордерам различными способам по вашим указаниям. Также предусмотрена функция расчета объема, c которым нужно открыть сделку, чтобы получить желаемую сумму при указанном размере Stop Loss / Take Profit .   Есть несколько вариантов расчета размера и установки параметров: 1. Установки исходя из суммы, заданной пользователем в процентах от текущего остатка депозита 2. Установка исходя из введенной польз
AW Candle Patterns
AW Trading Software Limited
Индикатор AW Candle Patterns является комбинацией из продвинутого трендового индикатора в сочетании с мощным сканером свечных паттернов. Это полезный инструмент для распознания и выделения тридцати наиболее надежных свечных паттернов. Помимо этого это анализатор текущего тренда по окрашенным барам с  подключаемой мультитаймфреймовой трендовой панелью, изменяемой по размеру и положению. Уникальная возможность регулировки отображения паттернов в зависимости от трендовой фильтрации.  Преимущества: 
Индикатор "VSA on the FLY" предназначен для быстрого отображения различных параметров Volume Profile / Market Profile. Исходные данные для работы индикатор берет из минутного таймфрейма. Индикатор устанавливается на любой таймфрейм и начинает отображать данные начиная от выбранной левой границы. Этой границей может быть начало дня, недели, торговой сессии, любого часа и т.д. Версия данного индикатора для MetaTrader 4 находится здесь . Доступны следующие входные параметры: Show VWAP . Ото
Crash 1000 Scalping Indicator for the Crash 1000 Deriv Synthetic Index. Introduction The Crash 1000 Scalping Indicator is a specialized tool designed for the Crash 1000 index on the Deriv Synthetic market. This indicator is particularly useful for scalping on the M1 timeframe, helping traders to identify precise entry and exit points for buy positions. It is designed to be non-repainting, providing clear signals with audible alerts and push notifications, and is compatible with mobile devices th
(Графики криптовалюты) Он приносит историю столько, сколько вы указали столбцов, и начинает напрямую отображать мгновенные данные. Дает возможность работать на любых таймфреймах. Позволяет работать с несколькими символами. Это приложение является фоновой службой. Он загружает историю всех символов, начинающихся с буквы «F», на экране обзора рынка и показывает данные о тиках. Автоматически передает торговые данные Binance Futures в MT5 в реальном времени. Запустите скри
Индикатор   Visual Volatility Clustering   кластеризирует рынок на основе волатильности. Индикатор не перерисовывает и дает точные данные, не использует цены закрытия. Использует цены открытия или цены максимумов или минимумов но предыдущего завершенного бара. Поэтому вся информация будет четкой и однозначной. Суть индикатора – разделить рынок цены на определенные участки по схожему типу волатильности. Это можно делать как угодно. В данном примере индикатор сконфигурирован на временной период W
Introducing "X Marks the Spot" – Your Ultimate MetaTrader 5 Indicator for Perfect Trades! Are you tired of the guesswork in trading? Ready to take your MetaTrader 5 experience to a whole new level? Look no further – "X Marks the Spot" is here to revolutionize your trading strategy! What is "X Marks the Spot"? "X Marks the Spot" is not just another indicator – it's your personal trading compass that works seamlessly on all timeframes . Whether you're a beginner or an experienced trader,
KT Volume Profile MT5
KEENBASE SOFTWARE SOLUTIONS
KT Volume Profile shows the volume accumulation data as a histogram on the y-axis providing an ability to find out the trading activity over specified time periods and price levels. Point of Control (POC) in a Volume Profile POC represents a price level that coincides with the highest traded volume within the whole volume profile histogram. POC is mostly used as a support/resistance or as an essential price level where market retest before going in a specific direction. Features Very easy
The indicator identifies critical support and resistance areas. It also can give alerts and notifications to your mobile. A lot of customization options are available: You can have different timeframe on your current chart. For example, if your current chart timeframe is H1, you can assign the indicator timeframe to M15.The indicator identifies critical support and resistance areas. It also can give alerts and notifications to your mobile. A lot of customizations are available. There is an opti
Вероятностный индикатор Этот индикатор анализирует движение цен за определенный период, чтобы получить важную информацию для анализа распределения вероятностей, такую как их среднее значение и стандартное отклонение. Получив такую информацию, он выполняет все необходимые расчеты и, наконец, вычисляет вероятность того, что текущая рыночная стоимость упадет. выше или ниже баров заданного периода. Поскольку этот индикатор эффективно использует силу вероятности, которая не лжет, это мощный индика
Trading panel for manual trading. Has a fairly wide functionality. Allows you to automatically calculate the order size, open both market and pending orders. It has a wide range of options for closing orders, it is possible to partially close orders, close orders after reaching a certain profit or loss, separately close profitable and unprofitable, buy and sell, as well as pending orders. The panel also contains a simple implementation of a grid of pending orders, reverse and lock functions, tr
Gioteen Volatility Index (GVI) - your ultimate solution to overcoming market unpredictability and maximizing trading opportunities. This revolutionary indicator helps you in lowering your losing trades due to choppy market movements. The GVI is designed to measure market volatility, providing you with valuable insights to identify the most favorable trading prospects. Its intuitive interface consists of a dynamic red line representing the volatility index, accompanied by blue line that indicate
С этим продуктом покупают
INSTRUCTIONS     RUS   -  ENG                    Рекомендуем использовать с индикатором - TPSpro  TREND PRO -  Version MT4 Важным ключевым элементом в трейдинге являются зоны или уровни, от которых принимаются решения о покупке или продаже торгового инструмента. Несмотря на попытки крупных игроков скрыть свое присутствие на рынке, они неизбежно оставляют следы. Наша задача заключалась в том, чтобы научиться находить эти следы и правильно их интерпретировать. Основные функции: Отображения акти
TPSpro TREND PRO   —  трендовый индикатор, который автоматически анализирует рынок и предоставляет информацию о тренде и каждой его смене а также дающий сигналы для входа в сделки без перерисовки! Индикатор использует каждую свечу, анализируя их отдельно. относя к разным импульсам – импульс вверх или вниз. Точные точки входа в сделки  для  валют, крипты, металлов, акций, индексов! Version MT4                ПОЛНОЕ ОПИСАНИЕ ИНДИКАТОРА          Рекомендуем использовать с  индикатором -  RFI LEVE
Прежде всего стоит подчеркнуть, что эта торговая система является индикатором без перерисовки, без повторной отрисовки и без задержки, что делает ее идеальной как для ручной, так и для роботизированной торговли. Онлайн курс, руководство и загрузка пресетов. «Smart Trend Trading System MT5» - это комплексное торговое решение, созданное для новичков и опытных трейдеров. Он объединяет более 10 премиальных индикаторов и предлагает более 7 надежных торговых стратегий, что делает его универсальным
Atbot
Zaha Feiz
4.91 (35)
AtBot: Как это работает и как его использовать ### Как это работает Индикатор "AtBot" для платформы MT5 генерирует сигналы на покупку и продажу, используя комбинацию инструментов технического анализа. Он интегрирует простую скользящую среднюю (SMA), экспоненциальную скользящую среднюю (EMA) и индекс средней истинной амплитуды (ATR) для выявления торговых возможностей. Кроме того, он может использовать свечи Heikin Ashi для повышения точности сигналов. Оставьте отзыв после покупки и получите спе
Прежде всего стоит подчеркнуть, что этот торговый индикатор не перерисовывается, не перерисовывает и не отставает, что делает его идеальным как для ручной, так и для роботизированной торговли. Руководство пользователя: настройки, вводы и стратегия. Атомный аналитик - это индикатор ценового действия PA, который использует силу и импульс цены, чтобы найти лучший край на рынке. Оборудованный расширенными фильтрами, которые помогают убирать шумы и ложные сигналы, и повышают торговый потенциал. Испо
Gold Stuff mt5
Vasiliy Strukov
4.92 (165)
Gold Stuff mt5 - трендовый индикатор, разработанный специально для золота, также может использоваться на любых финансовых инструментах. Индикатор не перерисовывается и не запаздывает. Рекомендуемый тайм-фрейм H1.  Свяжитесь со мной сразу после покупки для получения   персонального бонуса!   Вы можете получить бесплатную копию нашего индикатора Strong Support and Trend Scanner, пожалуйста, в личку. мне! Настройки и мануал  здесь ПАРАМЕТРЫ Draw Arrow -   вкл.выкл. отрисовку стрелок на графике. A
Получайте ежедневную информацию о рынке с подробностями и скриншотами через наш утренний брифинг здесь, на mql5 , и в Telegram ! FX Power MT5 NG - это новое поколение нашего популярного измерителя силы валют FX Power. Что же предлагает этот измеритель силы нового поколения? Все, что вы любили в оригинальном FX Power ПЛЮС Анализ силы GOLD/XAU Еще более точные результаты расчетов Индивидуально настраиваемые периоды анализа Настраиваемый предел расчета для еще более высокой производительности Спец
Quantum Trend Sniper
Bogdan Ion Puscasu
4.8 (49)
Представляем       Индикатор Quantum Trend Sniper   , инновационный индикатор MQL5, который меняет способ определения разворотов тренда и торговли ими! Разработан командой опытных трейдеров со стажем торговли более 13 лет,       Снайперский индикатор Quantum Trend       разработан, чтобы вывести ваше торговое путешествие на новые высоты благодаря инновационному способу определения разворотов тренда с чрезвычайно высокой точностью. ***Купите индикатор Quantum Trend Sniper и получите индикатор
Раскройте силу торговли трендами с помощью индикатора Trend Screener: вашего идеального решения для торговли трендами, основанного на нечеткой логике и мультивалютной системе! Повысьте уровень своей торговли по тренду с помощью Trend Screener, революционного индикатора тренда, основанного на нечеткой логике. Это мощный индикатор отслеживания тренда, который сочетает в себе более 13 инструментов и функций премиум-класса и 3 торговые стратегии, что делает его универсальным выбором для превращения
Прежде всего стоит подчеркнуть, что этот Торговый Инструмент является Неперерисовывающимся Нерепейнтинговым Индикатором, что делает его идеальным для профессиональной торговли. Онлайн-курс, руководство пользователя и демонстрация. Индикатор Концепций Умного Действия Цены - очень мощный инструмент как для новичков, так и для опытных трейдеров. Он объединяет более 20 полезных индикаторов в одном, комбинируя передовые торговые идеи, такие как анализ Inner Circle Trader и стратегии торговли конц
The AT Forex Indicator MT5 is a sophisticated trading tool designed to provide traders with a comprehensive analysis of multiple currency pairs. This powerful indicator simplifies the complex nature of the forex market, making it accessible for both novice and experienced traders. AT Forex Indicator uses advanced algorithms to detect trends, patterns and is an essential tool for traders aiming to enhance their forex trading performance. With its robust features, ease of use, and reliable signal
note: this indicator is for METATRADER4, if you want the version for METATRADER5 this is the link:  https://www.mql5.com/it/market/product/108106 TRENDMAESTRO ver 2.4 TRENDMAESTRO recognizes a new TREND in the bud, he never makes mistakes. The certainty of identifying a new TREND is priceless. DESCRIPTION TRENDMAESTRO identifies a new TREND in the bud, this indicator examines the volatility, volumes and momentum to identify the moment in which there is an explosion of one or more of these data a
Эта панель показывает последние доступные   гармонические паттерны   для выбранных символов, так что вы сэкономите время и будете более эффективны /   MT4 версия . Бесплатный индикатор:   Basic Harmonic Pattern Колонки индикатора Symbol:   отображаются выбранные символы Trend   :   бычий или медвежий Pattern   :   тип паттерна (Гартли, бабочка, летучая мышь, краб, акула, шифр или ABCD) Entry   :   цена входа SL:   цена стоп-лосса TP1:   цена первого тейк-профита TP2:   цена второго тейк-про
Топовый индикатор МТ5, дающий сигналы для входа в сделки без перерисовки! Идеальные точки входа в сделки для  валют, крипты, металлов, акций, индексов !  Смотрите  видео  (6:22) с примером отработки всего одного сигнала, окупившего индикатор. Версия индикатора для MT4 Преимущества индикатора Сигналы на вход без перерисовки Если сигнал появился, он никуда НЕ исчезает! В отличие от индикаторов с перерисовкой, которые ведут к потере депозита, потому что могут показать сигнал, а потом убрать его.
WHY IS OUR FXACCCURATE LS MT5 THE PROFITABLE ? PROTECT YOUR CAPITAL WITH RISK MANAGEMENT Gives entry, stop and target levels from time to time. It finds Trading opportunities by analyzing what the price is doing during established trends. POWERFUL INDICATOR FOR A RELIABLE STRATEGIES We have made these indicators with a lot of years of hard work. It is made at a very advanced level. Established trends provide dozens of trading opportunities, but most trend indicators completely ignore them!
Этот индикатор является уникальным, качественным и доступным инструментом для торговли, включающим в себя наши собственные разработки и новую формулу. В обновленной версии появилась возможность отображать зоны двух таймфреймов. Это означает, что вам будут доступны зоны не только на старшем ТФ, а сразу с двух таймфреймов - таймфрейма графика и старшего: отображение вложенных зон. Обновление обязательно понравится всем трейдерам, торгующим по зонам спроса и предложения. Важная информация Для мак
TPA True Price Action indicator reveals the true price action of the market makers through 100% non-repainting signals strictly at the close of a candle! TPA shows entries and re-entries, every time the bulls are definitely stronger than the bears and vice versa. Not to confuse with red/green candles. The shift of power gets confirmed at the earliest stage and is ONE exit strategy of several. There are available now two free parts of the TPA User Guide for our customers. The first "The Basics"
ICT, SMC, Smart Money Concept, Support and Resistance, Trend Analysis, Price Action, Market Structure, Order Blocks, Breaker Blocks, Momentum Shift, Strong Imbalance, HH/LL/HL/LH, Fair Value Gap, FVG, Premium & Discount Zones, Fibonacci Retracement, OTE, Buyside Liquidity, Sellside Liquidity, Liquidity Voids, Market Sessions,Market Time, NDOG, NWOG,Silver Bullet,ict template На финансовом рынке точный анализ рынка критически важен для инвесторов. Чтобы помочь инвесторам лучше понять тенденции
Auto Order Block with break of structure based on ICT and Smart Money Concepts (SMC) Futures Break of Structure ( BoS )             Order block ( OB )            Higher time frame Order block / Point of Interest ( POI )    shown on current chart           Fair value Gap ( FVG ) / Imbalance   -  MTF      ( Multi Time Frame )    HH/LL/HL/LH  -  MTF      ( Multi Time Frame )  Choch  MTF      ( Multi Time Frame )  Volume Imbalance     ,  MTF          vIMB Gap’s Power of 3 Equal High
ICT, SMC, SMART MONEY CONCEPTS, SMART MONEY, Smart Money Concept, Support and Resistance, Trend Analysis, Price Action, Market Structure, Order Blocks, BOS/CHoCH,   Breaker Blocks ,  Momentum Shift,   Supply&Demand Zone/Order Blocks , Strong Imbalance,   HH/LL/HL/LH,    Fair Value Gap, FVG,  Premium  &   Discount   Zones, Fibonacci Retracement, OTE, Buy Side Liquidity, Sell Side Liquidity, BSL/SSL Taken, Equal Highs & Lows, MTF Dashboard, Multiple Time Frame, BigBar, HTF OB, HTF Market Structure
IX Power MT5
Daniel Stein
4.17 (6)
IX Power , наконец, предлагает непревзойденную точность FX Power для нефорексных символов. Он точно определяет интенсивность краткосрочных, среднесрочных и долгосрочных трендов в ваших любимых индексах, акциях, товарах, ETF и даже криптовалютах. Вы можете   анализировать все, что   может предложить ваш терминал. Попробуйте и почувствуйте, как   значительно улучшается ваш тайминг   при торговле. Ключевые особенности IX Power 100% точные результаты расчетов без перерисовки - для всех торгов
** All Symbols x All Timeframes scan just by pressing scanner button ** *** Contact me  to send you instruction and add you in "123 scanner group" for sharing or seeing experiences with other users. After 17 years of experience in the markets and programming, Winner indicator is ready. I would like to share with you! Introduction The 123 Pattern Scanner indicator with a special enhanced algorithm is a very repetitive common pattern finder with a high success rate . Interestingly, this Winner in
Индикатор определения тренда, дополнит любую стратегию, а также может использоваться как самостоятельный инструмент.  ВАЖНО! Свяжитесь со мной сразу после покупки, чтобы получить инструкции и бонус!  Преимущества Прост в использовании, не перегружает график не нужной информацией; Возможность использования  как фильтр для любой стратегии; Имеет встроенные уровни динамических поддержек и сопротивлений, что может использоваться как для фиксации прибыли, так и для установки стоп-лоссов; Индикатор не
Step into the realm of Forex trading with confidence and precision using XQ, a cutting-edge Forex indicator designed to elevate your trading game to unprecedented heights. Whether you're a seasoned trader or just stepping into the world of currency exchange, XQ Forex Indicator empowers you with the insights and signals needed to make informed trading decisions. The signal conditions are a combination of three indicators, and XQ Forex Indicator only display  medium and long-term trends . The ind
FX Volume MT5
Daniel Stein
4.93 (14)
Получайте ежедневную информацию о рынке с подробностями и скриншотами в нашем утреннем брифинге здесь, на mql5 , и в Telegram ! FX Volume - это ПЕРВЫЙ и ЕДИНСТВЕННЫЙ индикатор объема, который дает РЕАЛЬНОЕ представление о настроении рынка с точки зрения брокера. Он дает потрясающее представление о том, как институциональные участники рынка, такие как брокеры, позиционируют себя на рынке Forex, гораздо быстрее, чем отчеты COT. Видеть эту информацию прямо на своем графике - это настоящий геймчей
Gartley Hunter Multi - Индикатор для поиска гармонических моделей одовременно на десятках торговых инструментов и на всех возможных ценовых диапазонах. Инструкция/Мануал ( Обязательно читайте перед приобретением ) | Версия для МТ4 Преимущества 1. Паттерны: Гартли, Бабочка, Акула, Краб. Летучая мышь, Альтернативная летучая мышь, Глубокий краб, Cypher 2. Одновременный поиск паттернов на десятках торговых инструментов и на всех возможных таймфреймах 3. Поиск паттернов всех возможных размеров. От
Эта панель обнаруживает и отображает на графике зоны   спроса   и   предложения , как в скальпинге, так и в долгосрочном режиме, в зависимости от вашей торговой стратегии для выбранных символов. Кроме того, сканерный режим панели помогает сразу проверить все нужные символы и не пропустить ни одной подходящей позиции /   MT4 версия Бесплатный индикатор:   Basic Supply Demand Особенности Позволяет просматривать торговые возможности по   нескольким валютным парам , давая вам четкое и ясное п
Stratos Pali Indicator is a revolutionary tool designed to enhance your trading strategy by accurately identifying market trends. This sophisticated indicator uses a unique algorithm to generate a complete histogram, which records when the trend is Long or Short. When a trend reversal occurs, an arrow appears, indicating the new direction of the trend. Important Information Revealed Leave a review and contact me via mql5 message to receive My Top 5 set files for Stratos Pali at no cost ! Do
Индикатор Price Action Finder Multi это индикатор точек входа, который ищет и отображает паттерны системы Price Action сразу на десятках торговых инструментов и на всех стандартных таймфреймах: (m1, m5, m15, m30, H1, H4, D1, Wk, Mn). Найденные паттерны индикатор помещает в таблицу в нижней части экрана. Кликая на названия паттерна в таблице вы можете перемещаться на график, где этот паттерн находится. Инструкция/Мануал ( Обязательно читайте перед приобретением ) | Версия для МТ4 Преимущества 1.
Matrix Arrow Indicator MT5
Juvenille Emperor Limited
5 (12)
Индикатор Matrix Arrow MT5   — это уникальный индикатор тренда 10 в 1, следующий за   100% неперерисовывающимся   индикатором с несколькими таймфреймами, который можно использовать на всех символах/инструментах:   форекс ,  товары ,   криптовалюты ,   индексы ,  акции . Индикатор Matrix Arrow MT5  будет определять текущую тенденцию на ранних этапах, собирая информацию и данные от до 10 стандартных индикаторов, а именно: Индекс среднего направленного движения (ADX) Индекс товарного канала (CCI)
Другие продукты этого автора
up-down indicator is no repaint and works all pairs and lower than weekly time frames charts. it is suitable also 1 m charts for all pairs. and hold long way to signal. dont gives too many signals. when red histogram cross trigger line that is up signal.and price probably will down when blue histogram cross trigger line that is down signal.and price probably will go up. when the signals not seen press + button on terminal . too see weekly chart because of low data on chart ,it needs to lower p
white arrows is a norepaint  trend indicator. it work all pairs and all timeframes..suitable for stocks and future trading. it is a counter trend indicator.that mean it gives sell signal when price increasing.and gives buy signal when price decreasing. it put white arrows on high and low points. it is suitable experienced trader and beginner also. cnt number has been set to 1000.it can be increase if there is enough bars on chart. minimum value is 500.
indicator is no repaint trend indicator. when red stars up to line that is probably end of long trades. when blue stars up to line that is probably end of down trades. indicator can use all pairs and lower than weekly charts, to use weekly chart need to at least 500 bars data on back.and lowering processing value 500. it is also suitable for 1m charts. indicator hold long way to go. there is not too many signals.
Thise indicator is up down v6  comes with tradingwiev pinescript. purchased people, after installed on terminal ,contact me on mql5  to get BONUS  TradingView pinescript. up-down indicator is no repaint and works all pairs and lower than weekly time frames charts. it is suitable also 1 m charts for all pairs. and hold long way to signal. dont gives too many signals. when red histogram cross trigger line that is up signal.and price probably will down when blue histogram cross trigger line that
volatility level indicator is a volatility oscillator to see trend reversal points. price trends has reverese when volatility inreased . this indicator show trend reversal points volatility. mostly same level up and down volatility is reversal points. red colour shows up points of volatilty.and probably trend will down. blue colour oscillator shows deep point of price when increased volatiliyty. on pictures horizontal lines on oscillator has drawed by hand.to see the before level and compare now
norepaint arrows indicator is a nrp indicator. never change signals or put signals back. when price up  blue arrow is sell ,when price down aqua arrows are buy signals. thise indicator can use all time frames and for all pairs.. Mostly use lower timeframes.  cnt value is 1000 bars. to see back signals ,cnt value can be increase if there is enough bars on charts. minimum value cnt is 500. dont use lower then 500. g value has been set to optimum value is 1. Increasing g value gives more signals.
norepaint buy sell indicator is norepaint indicator.and works all pairs and all timeframes. Indicator hold too long way to signals. And show major and minor cycles.and gives signals Minor cycles are indicating with x signs. Major cycles are indicating big arrows. So 5m chart and 15m chart more suitable For major cycles, 1 h and 4h chart suitable for minor cycles. using is wery simple ,it puts arrow on price probably buy sell arrows. thise indicator is suitable for beginner and experienced trader
up down stars indicator is no repaint indicator. it hold long way to signals. suitable all pairs and all timeframes. it needs at least 1000 bars on charts. 1 is critical level for signals. if red line reach 1 it gives red star to sell.. if blue line reach 1 it gives blue star to buy.. signals comes mostly exact time. sometimes lower timeframes it makes consecutive signals.
nrp vertex g indicator is no repaint vertex indicator. it works all time frame and all pairs. working princible is wery easy and can use beginners. when histogram up side and there is a white star on it that is buy signal.. and reverse signal sell comes when histogram below zero and white star on it.that is sell signal. indicator hold long time to signal.and it is not neccesary to stay on computer. minimum bar number is 500 bars on chart to work of it. and the cnt nr is minimum 500 can be. but p
up down v6 for mt5 is no repaint all timeframe and all pairs indicator. red histogram cros trigger that is up point,and put a red point on histogram. and blue histogram cros trigger that is deep point.and put blue point on histogram. this indicator need to sometimes zoom out .for thise pres + button. if newly comes signal is too high makes before invisible.red and blue points are there.to see the signals. indicator is no repaint and can use all time frame and all pairs. only need minimum 500 bar
on free demo press zoom out button to see back.. cnt number is bar numbers.you can change up to 3000 related to chart bars numbers. minimum value is 500. there is g value set to 10000. no need to change it. this indicator almost grail,no repaint and all pairs ,all timeframe indicator. there is red and blue histograms. if gold x sign comes on red histogram that is sell signal. if blue x sign comes on blue histogram that is buy signal. this indicator on thise version works all pairs.al timeframe
THISE INDICATOR NOT WORK ON FREE DEMO. there is a protocol to work it. target finder indicator is a forecast the find probably targets.up and down. to use thise indicator, there is a protocol,i explain below. first load indicator  you will see blue and red lines. on the left side look to the higher value of line ,and draw horizantal line on top it. and on the right side see the LEVEL NUMBER. Finding UP TARGET h=put that level number  m=1 b=1 pres ok. you will see on the screen ,on top right ,r
Trigger RSI is a no repaint trend indicator. it can use all pairs and all time frames. easy for use beginner and experienced tarders. it put aqua and gold point on histograms. if aqua point on the blue histogram that is buy signal. if gold point on the red histogram that is sell signal. cnt value has been set to default 1000. you can increase it to see back signals.if there is enough bars on charts. minimum value cnt is 500.
buy sell star indicator has a different algoritms then up down v6 and buy sell histogram indicators. so that i put this a another indicator on market. it is no repaint and all pairs and all time frame indicator. it need minimum 500 bars on charts. when  the white  x sign on the red histogram that is sell signals. when the white x sign on the blue  histogram that is sell signals. this indicator does not guarantie the win.price can make mowement on direction opposite the signals. this is multi tim
double line indicator is no repaint trend indicator. it can be use all pairs and all timeframes. it is wery ease to use.also beginner can use. it gives gold and aqua points on the double lines. aqua points is come when the prices is down. and gold points is come when the prices is on top. it can be used all time frames and all pairs. suitable for experienced and beginners traders.
indicator is no repaint trend indicator.for mt5 when white stars up to Red histogram that is probably end of long trades. when White stars up to Blue histogram that is probably end of down trades. indicator can use all pairs and lower than weekly charts, to use weekly chart need to at least 500 bars data on back.and lowering processing value 500. it is also suitable for 1m charts. indicator hold long way to go. there is not too many signals.
Фильтр:
Нет отзывов
Ответ на отзыв
Версия 1.2 2024.05.16
periot changed to 14