DYJ StochasticSignalSource
- Индикаторы
- Daying Cao
- Версия: 2.6
- Обновлено: 26 июня 2024
- Активации: 5
The DYJ StochasticSignalSource is displayed as two lines. The main line is called %K. The second line, called %D, is a Moving Average of %K. The %K line is usually displayed as a solid line and the %D line is usually displayed as a dotted line.
There are several ways to interpret a Stochastic Oscillator. four popular methods include:
- Buy when the Oscillator (either %K or %D) falls below a specific level (for example, 20) . Sell when the Oscillator rises above a specific level (for example, 80) .
- When the K and D lines are below(for example, 20),Buy when the %K line rises above the %D line. When the K and D lines are above (for example, 80),sell when the %K line falls below the %D line.
- Buy when the %K line rises above the %D line. sell when the %K line falls below the %D line.
- Buy when the Oscillator (either %K or %D) falls below a specific level (for example, 20) and then rises above that level. Sell when the Oscillator rises above a specific level (for example, 80) and then falls below that level.
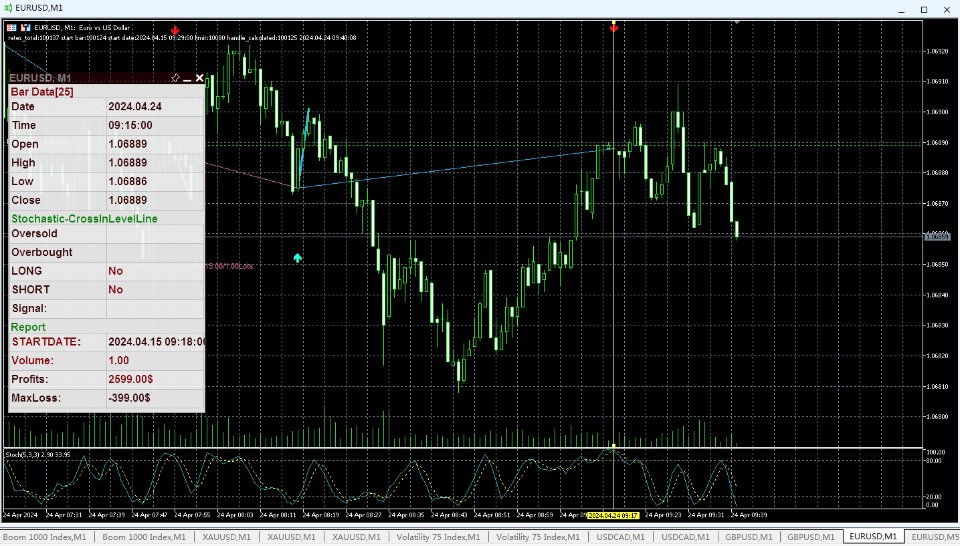
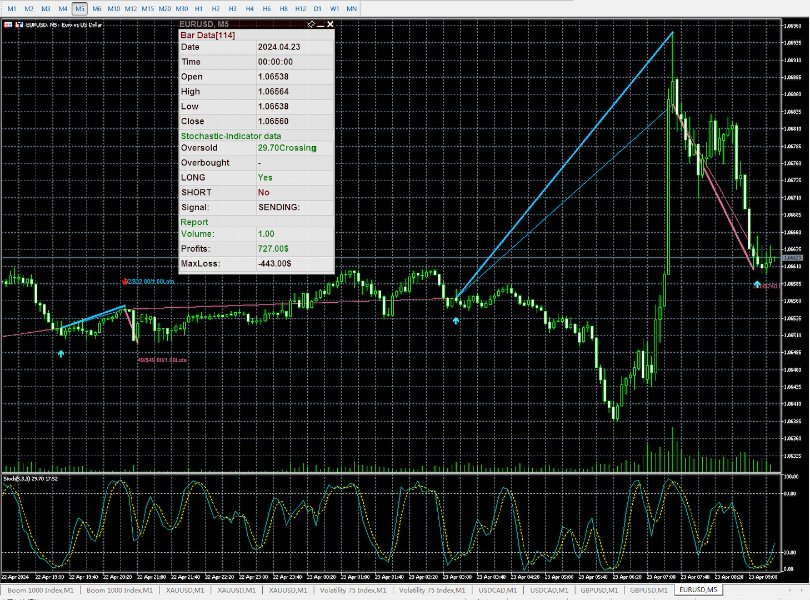
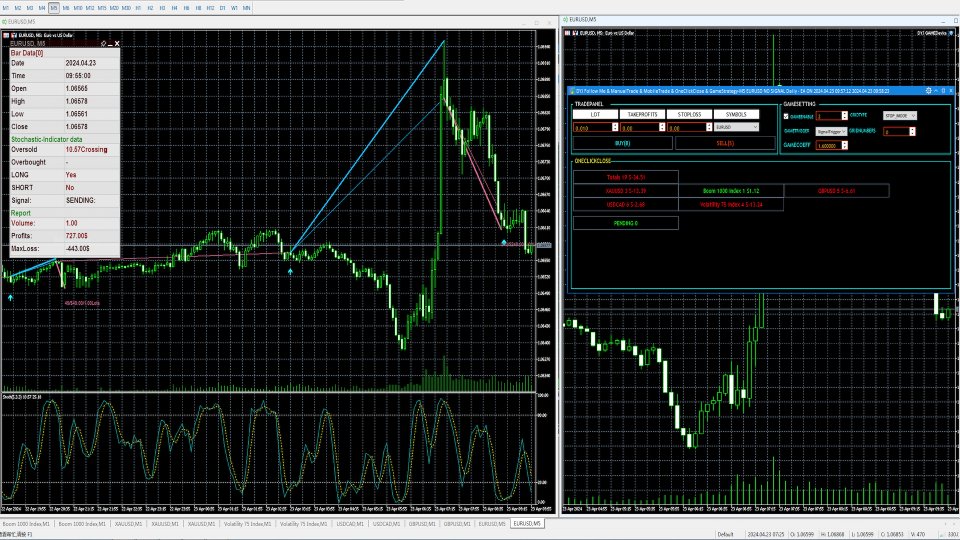
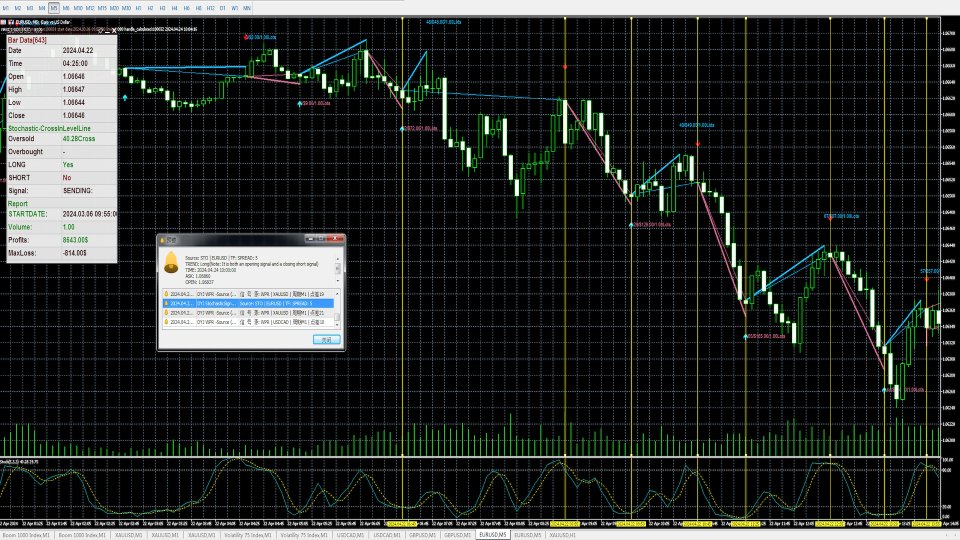
You can use the DYJ Mathematical model trader indicator trading analysis model to display the indicator's real trading opening and closing positions and calculate the overall profit and maximum floating loss!
In addition, the DYJ StochasticSignalSource stochastic oscillator also marks the entry point and exit point with colored arrows, and also counts the total profit and the maximum floating loss in real time based on these positions, which are important data for judging the trading probability.
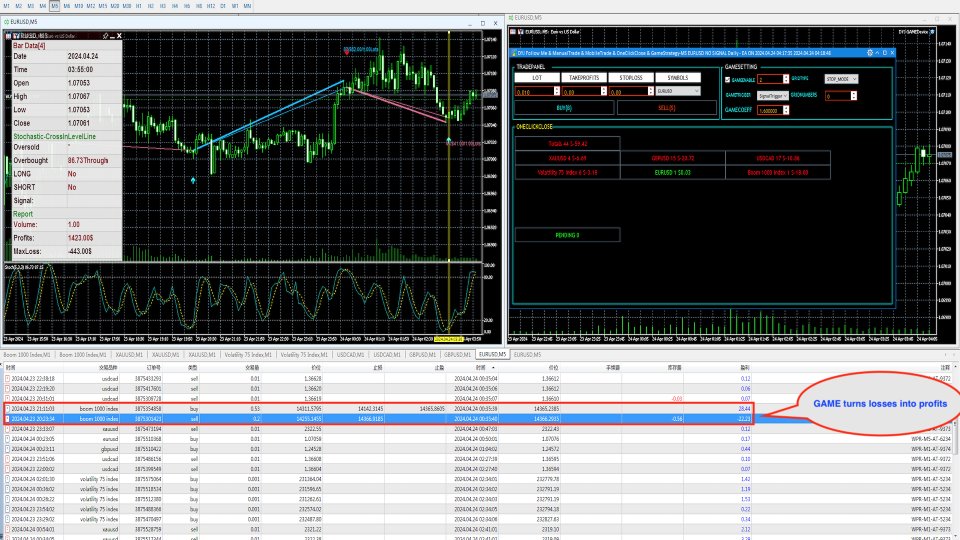
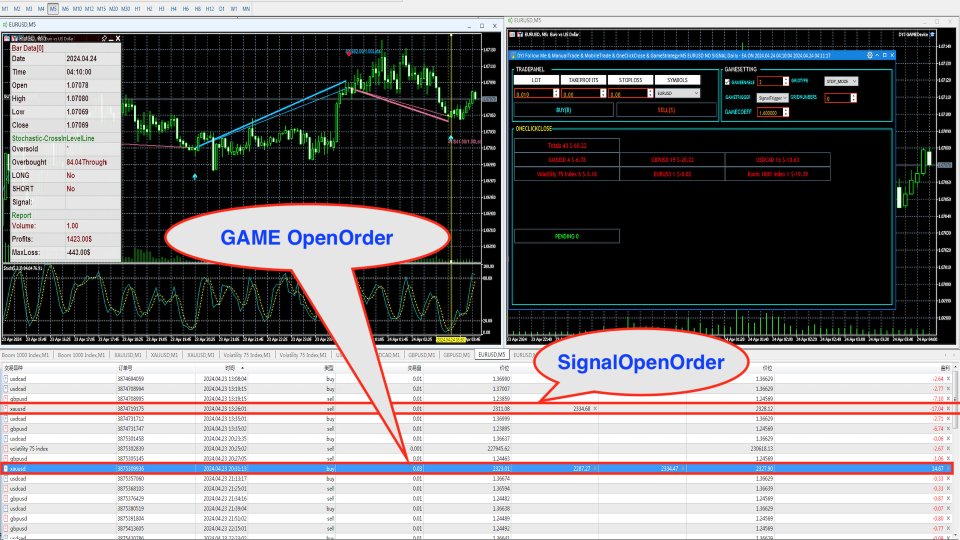
You use the following software DYJ GAMEDevice to receive the position opening and closing signals from the DYJ StochasticSignalSource stochastic oscillator signal source to realize automatic position opening and closing. DYJ GAMEDevice can turn losses into profits
Input parameters
[General]
- InpUseLanguage = English/Chinese
- signal_source_name = "STOCHASTIC"
[Indicator]
- Kperiod=5 -- Kperiod K
- Dperiod=3 -- Dperiod D
- slowing=3 -- Slowing
- ma_method = MODE_SMA -- MA Method
- price_field=STO_LOWHIGH -- PriceField
- InpOversoldArea = 20 -- stoch oversold zone
- InpOverboughtArea = 80 -- stoch overbought zone
- InpSimulatedVolume = 1 -- Lots
[EstimateSystem]
- InpOnlyOppositeClosedLine = false
- InpIsDisplayChartText = true
- InpIsDisplayProfitsLine = true
- MaxProfitsTextHigh = 40
- MaxProfitsTextLow = 20
- UpLineClr = DeepSkyBlue // Arrow Up Color
- DnLineClr = PaleVioletRed // Arrow Down Color
- alertsMessage = true
- alertsSound = true
- alertsEmail = false
- alertsPush = false
- InpIsMultipleLinesTextForAlertsMessage = true
- InpStartDate = "19700101" // InpStartDate:If it is 19700101, it represents the minimum date.
- InpEndDate = "19700101" // InpEndDate:If it is 19700101, it represents an infinite date.
- InpWindowsXSize = 1030
- InpWindowsYSize = 450
