MACD Crossover Lines
- Индикаторы
- Alexis Brian Luna
- Версия: 1.0
What is MACD?
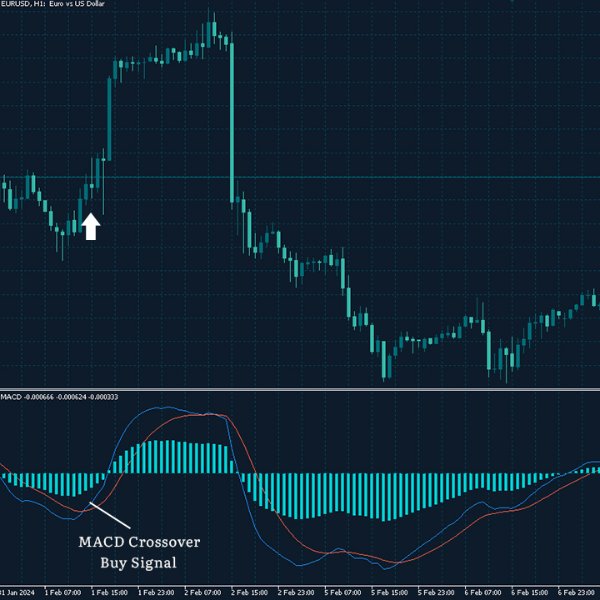
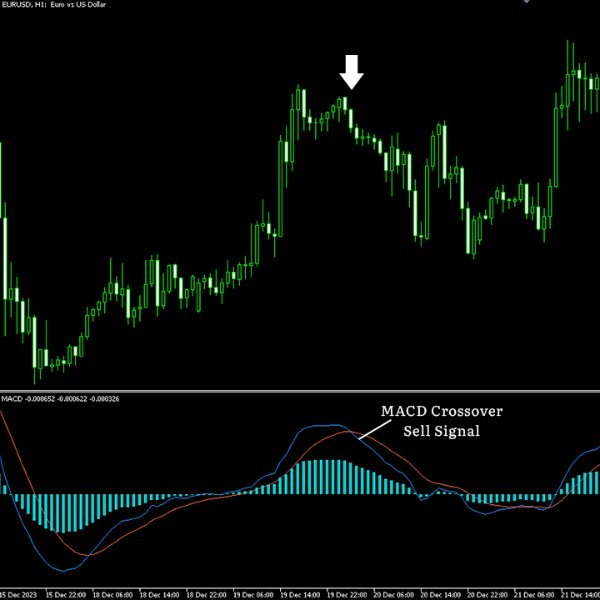
MACD is an acronym for Moving Average Convergence Divergence.This technical indicator is a tool that’s used to identify moving averages that are indicating a new trend, whether it’s bullish or bearish.
There is a common misconception when it comes to the lines of the MACD.
There are two lines:
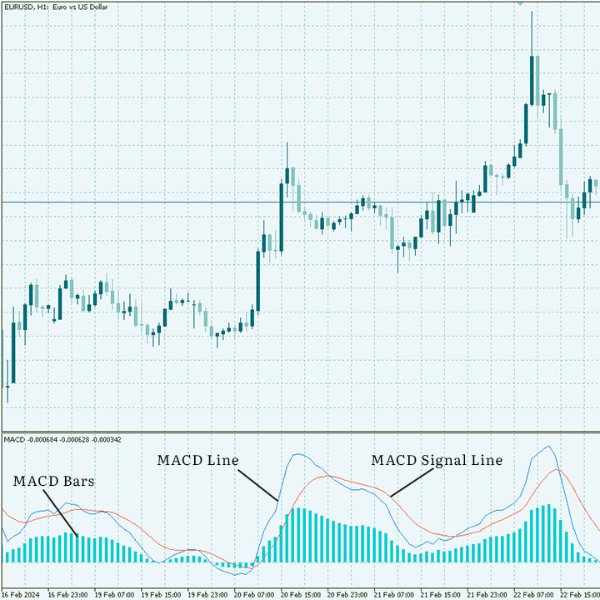
- The "MACD Line"
- The "Signal Line"
The two lines that are drawn are NOT moving averages of the price.
The MACD Line is the difference (or distance) between two moving averages. These two moving averages are usually exponential moving averages (EMAs).
When looking at the indicator, the MACD Line is considered the "faster" moving average.
For example; the MACD Line is the difference between the 12 and 26-period moving averages.
The Signal Line is the moving average of the MACD Line.
When looking at the indicator, the Signal Line is considered the "slower" moving average. The purpose of the Signal Line is to smooth out the sensitivity of the MACD Line.
The Histogram simply plots the difference between the MACD Line and Signal Line. It is a graphical representation of the distance between the two lines.
If you look at a chart with a MACD indicator, sometimes you can see that, as the two moving averages (MACD Line and Signal Line) separate, the histogram gets bigger.
This is called a MACD divergence because the faster moving average (MACD Line) is "diverging" or moving away from the slower moving average (Signal Line).
As the moving averages get closer to each other, the histogram gets smaller. This is called convergence because the faster moving average (MACD Line) is "converging" or getting closer to the slower moving average (Signal Line).
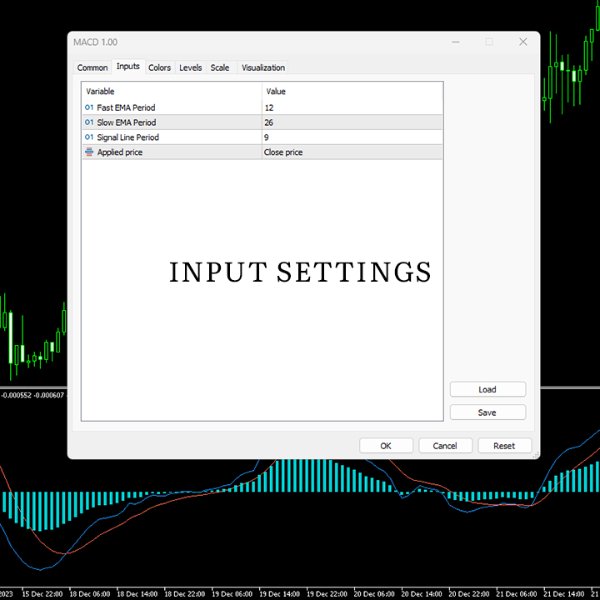
Input Settings:
- Fast EMA Period
- Slow EMA Period
- MACD Signal Line Period
- Applied Price

