• Обзор
  • Отзывы
  • Обсуждение (2)
  • Что нового

ICT Unicorn Model for MT4

The ICT Unicorn Model indicator highlights the presence of "unicorn" patterns on the user's chart which is derived from the lectures of "The Inner Circle Trader" (ICT).

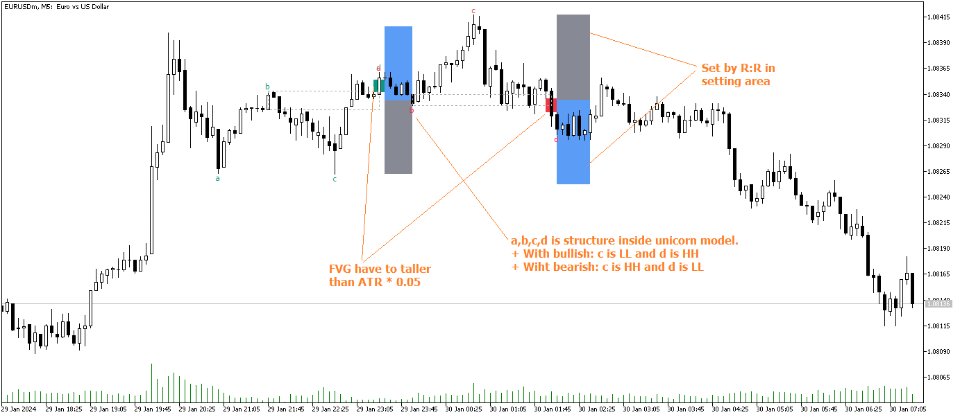
Detected patterns are followed by targets with a distance controlled by the user.

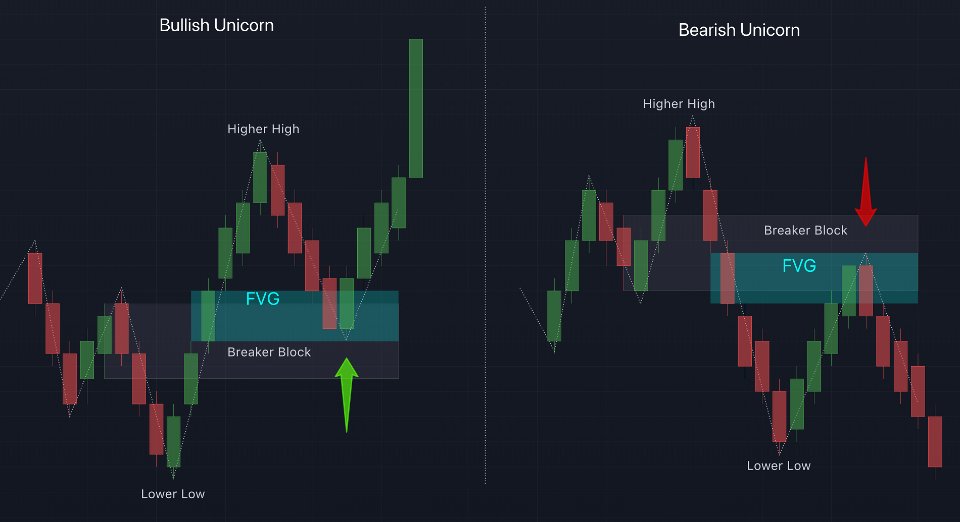
🔶 USAGE (image 2)

At its core, the ICT Unicorn Model relies on two popular concepts, Fair Value Gaps and Breaker Blocks. This combination highlights a future area of support/resistance.

A Bullish Unicorn Pattern consists out of:

  • A Lower Low (LL), followed by a Higher High (HH)
  • A Fair Value Gap (FVG), overlapping the established Breaker Block
  • A successful re-test of the FVG which confirms the pattern.
A Bearish Unicorn Pattern consists of:

  • A Higher High (HH), followed by a Lower Low (LL)
  • A Fair Value Gap (FVG), overlapping the established Breaker Block
  • A successful re-test of the FVG which confirms the pattern

The pattern detection depends on detected swings, which can be controlled by the Swing setting. Using higher values of this setting will return longer-term breaker blocks.

🔶 SETTINGS

🔹 Unicorn
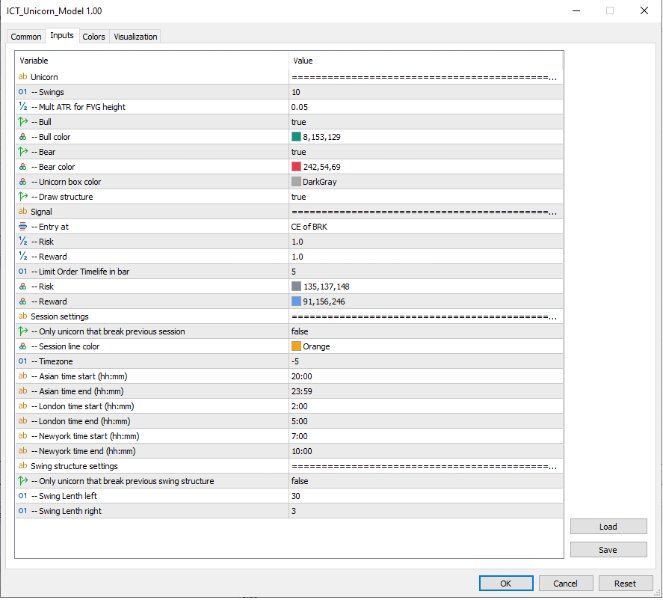
  • Swings: This sets the length of swings, used for the underlying ZigZag and Unicorn Patterns detection.
  • Mult ATR for FVG height: FVG is considered valid when its height is greater than the ATR multiplied by this value. Default is 0.05.
  • Bull: Enable/disable Bullish patterns, and set the color of FVG box.
  • Bear: Enable/disable Bearish patterns, and set the color of FVG box.
  • Draw structure: This option allow mark pivot point inside model as a,b,c,d: With bullish model,  c is LL and d is HH; With bearish model, c is HH and d is LL


🔹 Signal

  • Entry at: Choose how entry include:
    1. CE of BRK: 50% of breaker block
    2. Edge of BRK: entry at top of breaker block with bullish model and vice versal
    3. CE of FVG: 50% of fair value gap
    4. Edge of FVG: entry at top of fair value gap with bullish model and vice versal
  • Rish/Reward and its color settings.
  • Limit order timelife (in bar): set how many bar that risk and reward box keep drawing


🔹 Session settings

  • Only model that break previous session: When true, we just care about bullish model have C lower than low of previous session and vice versal. For example, we wait until close asian and just care about bullish model that break lowest of Asian.
  • Other settings include: Timezone, sessions time and color


🔹 Swing Structure settings

  • Only model that break previous swing structure: When true, we just care about bullish model have C lower than previous swing low and vice versal. 
  • Length of swing: include left-hand and right-hand length.

🔶 ALERTs

  1. When unicorn model detected
  2. When model was invalided by time (Depend on  Limit order timelife setting)
  3. When buy/sell signal (price cross entry)

You can setup notification with alert, email, MT5 mobile app or telegram.

🔶 BUFFER

For easy to create EA base on this indicator, we add buffer as following:

0: buff_buy_entry

1: buff_buy_stoploss

2: buff_buy_take profit

//---

3: buff_sell_ent

4: buff_sell_sl

5: buff_sell_tp

Default value =0. When have unicorn signal, the candle will have buffer value as price.






Рекомендуем также
Introduction to X3 Chart Pattern Scanner X3 Cherart Pattern Scanner is the non-repainting and non-lagging indicator detecting X3 chart patterns including Harmonic pattern, Elliott Wave pattern, X3 patterns, and Japanese Candlestick patterns. Historical patterns match with signal patterns. Hence, you can readily develop the solid trading strategy in your chart. More importantly, this superb pattern scanner can detect the optimal pattern of its kind. In addition, you can switch on and off individu
Reversal Pattern Pro
Boonyapagorn Rodvattanajinda
Reversal Patterns Pro Reversal Patterns Pro is a Price Action (PA) analytical tool that scans the reversal patterns.  - Finds and marks the most dependable Japanese candlestick patterns in real-time. - Supports all time frames (Best for Scalping) - Doesn't repaint making it an exceptional indicator for Expert Advisors. Input parameters : - Support & Resistance Mode ( true or false ) for enabling advanced filtering - Donchian Period - RSI Period - RSI Oversold Level - RSI Overbought Level - 
Индикатор определяет на графике важные пики и впадины (экстремумы). Данные точки могут служить для построения уровней поддержки/сопротивления и линий тренда а также любого другого графического анализа. Данные точки могут служить ориентирами для установки торговых ордеров. Индикатор не перерисовывается . Настройки: Size_History  - размер рассчитываемой истории. Num_Candles_Right  - количество свечей справа от пика или впадины. Num_Candles_Left  - количество свечей слева от пика или впа
Индикатор Martingal работает на всех валютных парах и на всех таймфреймах. Стрелками показывает оптимальные точки входов для будущего усреднения по Мартингейлу даже с нулевой экспонентой. Индикатор показывает сигнал на закрытие серии только в том случае, если все предыдущие сигналы можно закрыть в профите. После закрытия серии в профите нужно сразу открывать ордер в направлении сигнала. Таким образом сигнал на закрытие - это одновременно точка реверсного открытия в другую сторону нового ордера.
Введение Индикатор Harmonic Volatility стал первым техническим инструментом, использующим уровни Фибоначчи для анализа волатильности на рынке. Индикатор объединяет коэффициенты Фибоначчи (0.618, 0.382 и т.д.) с торговой волатильностью. Изначально индикатор Harmonic Volatility разрабатывался как способ преодолеть ограничение и слабые стороны угла Ганна, также известного как "Веер Ганна". Мы продемонстрировали, что индикатор Harmonic Volatility можно использовать на графике аналогично углу Ганна (
Auto AndrewFork
Noor Ghani Rahman
1 (1)
Auto Pitchfork Indicator The indicator calculate the Pitch fork for the previous Day (Selectable) with multiple Support and Resistance lines from the Median price which acts as Magnet for the Price that if price touch the above warning (1) or below warning (1) lines and not cross up or down then there is maximum possibilities that it will return to the Median Line, and thus maintain the Price Action in Cyclic Pattern to the Market Move. You are able to select how many warning lines you want to k
Приборная панель паттерна симметричного треугольника позволяет вам одновременно отслеживать несколько рынков и таймфреймов для паттернов симметричного треугольника, как это показано с помощью индикатора паттерна симметричного треугольника, доступного здесь: https://www.mql5.com/ru/market/product/68709/ Посетите приведенный выше индикатор, чтобы узнать больше о том, как формируются модели симметричных треугольников, и о простых стратегиях торговли ими. Приборная панель является самостоятельным
PZ Wedges
PZ TRADING SLU
3 (2)
Этот индикатор находит клинья , которые представляют собой паттерны продолжения, которые определяются сходящимися линиями тренда, окружающими период консолидации цен. Он сигнализирует о сделках, используя прорыв дончиана вместе с прорывом пласта. [ Руководство по установке | Руководство по обновлению | Устранение неполадок | FAQ | Все продукты ] Легко использовать Настраиваемые цвета и размеры Реализует сигналы прорыва Он реализует оповещения всех видов Оптимальное использование Чтобы увидеть
Indicator plots price cycle blocks and sends signals with smart volume confirmation. Price cycles and fractals are combined to determine the demand/supply blocks. The indicator can be used alone or combined with other Cycle Indicators Inputs: Period: Recommended value is between 35 and 55( Which are Set 1 and Set 2 periods of cycle sniper ) Engulfing: If true, you will be able to see the engulfing bar confirmation. Volume Filter: True (The  arrow comes with volume confirmation ) Videos with dif
Индикатор Fibolopes (от слова Envelopes) основывается на последовательности Фибоначчи. Входной параметр FiboNumPeriod отвечает за числа в целочисленной последовательности (0, 1, 1, 2, 3, 5, 8 13, 34, 55, 89...) Индикатор рассчитывает основную желтую пунктирную линию и 2 полосы в качестве положительного и отрицательного отклонения от нее. Индикатор высчитывает ZigZag (голубая линия), который в сочетании с Fibolopes формирует систему сигналов для открытия (Z пересекает Fibolopes) новой позиции и з
Introduction to Fibonacci Volatility Indicator Volatility indicator can help you to detect any statistical advantage for your trading. Especially, if you are trading with Price Action and Price Patterns, then we recommend to use the Volatility indicator together with your strategy. Especically, Fibonacci Volatility indicator combines the market volatiltiy with Fibonacci Analysis to provide you more advanced volatiltiy indicator. Main Features Fibonacci Volatility in Z score Configuration Mode Fi
Nepsetms45 - форекс индикатор для скальпинга, который показывает трейдеру точки разворота цены и текущее направление тренда. Точность сигналов индикаторов в среднем 87%. Это говорит о том, что если на графике индикатор нарисовал стрелку, то с вероятностью 87%, цена в ближайшее время пойдет в направлении стрелки как минимум на 20 пунктов или более. Так же индикатор с помощью линий на графике показывает направление тренда и силы движения. Nepsetms45 - это готовая торговая система для скальпинга вн
Monster Harmonics - индикатор гармонических моделей (harmonic patterns). Он распознает следующие модели: Гартли (Gartley), Летучая мышь (Bat), Краб (Crab), Бабочка (Butterfly), Монограмма (Cypher), Черный лебедь (Black Swan), Белый лебедь (White Swan), Акула (Shark) и AB=CD. Незаконченные модели также распознаются. Monster даже показывает потенциальную зону разворота (Potential Reversal Zone, PRZ). Пользователи могут добавлять свои паттерны. Кроме текущей модели, Monster также показывает все мод
VR Pivot
Vladimir Pastushak
VR Pivot - это индикатор ключевых разворотных точек пивотов (pivot). Точки Пивот – это специальный тип уровней поддержки (support) и сопротивления (resistance) , которые используются с целью определения наиболее сильных ценовых зон. Профессиональные трейдеры использую уровни пивотов для определения цен на которых существует большая вероятность разворота цены. Уровни рассчитываются по специальным математическим формулам, в расчет идут цены закрытия, открытия, максимума, минимума предыдущего време
All Symbols   AND  All Time frames Scan                                                                                                                 Document Introduction   The ABCD is a basic harmonic pattern. The ABCD pattern is a visual, geometric chart pattern comprised of three consecutive price swings. It looks like a diagonal lightning bolt and can indicate an upcoming trading opp
Forex Indicator  " Hanging Man pattern" for MT4 Indicator  " Hanging Man pattern "  is very powerful indicator   for Price Action trading :    No repaint, No delays; Indicator   detects bearish Hanging Man patterns  on chart:  Red arrow signal on chart (see pictures) P C, Mobile & Email alerts   are included Indicator   " Hanging Man pattern "  is excellent to   combine with Support/Resistance  Levels:  https://www.mql5.com/en/market/product/100903 // More great Expert Advisors and Indicators ar
Индикатор находит уровни максимального и минимального ценового объема (профиль рынка) на рабочей гистограмме для указанного количества баров.  Композитный профиль. Высота гистограммы полностью автоматическая и адаптируется к любому инструменту и таймфрейму. Используется авторский алгоритм и не повторяет известные аналоги. Высота двух гистограмм примерно равна средней высоте свечи. Умное оповещение (smart alert) поможет вам сообщить о цене, касающейся уровня объема. Концепция Smart Money. Low
Fibonacci calculator is used with Elliot Waves, it can generate remarkable results. A trader could use these levels or ratios to find high probability trades with very small stop loss. You may also use these ratios to find Elliott Waves extensions and to book profit near those levels. For Elliot Wave experts, Fibonacci calculator is a highly useful tool that can assist them in calculating Fibonacci extension and retracement levels for the market price. The indicator proves itself as a useful one
Very special indicator of Joe Dinapoli which is a derivative  of a Detrended Oscillator. Through a set of parametric equations, a predicting oscillator is created that forecasts, one period ahead of time, overbought and oversold conditions. The resulting predictor values are expressed as bands on the bar chart, both above and below the market. It may be mistaken as a Bollinger Band but has no resemblance to it whatsoever. The Predictor bands may be used in a variety of ways to aid in entering an
This is the Full Version, to get the free version please contact me. The free version works on “GBPCHF” charts. All symbols and time frames scanner. Harmonic Pattern Harmonic patterns are used in technical analysis that traders use to find trend reversals. They are considered one of the most accurate technical analysis tools, as they allow traders to predict the future price movement direction and the potential trend targets. Also, unlike many other technical tools, the number of false signal
Индикатор ищет подобную ценовую структуру, сравнивая с последней ценовой структурой. Размер паттерна (грубо говоря количество переломов зигзага) настраивается (всегда меньше на 1, чем введено - нулевой перелом не считается). Все найденные совпадения отмечаются прямоугольником. Так же к паттернам существует быстрая навигация с помощью кнопочек "Next patt" и "Prev patt". В индикатор вшиты два индикатора типа ЗигЗа г : стандартный зигзаг и пользовательский , моей разработки. Параметры настройки ста
harmonic patterns   Harmonic patterns can be used to spot new trading opportunities and pricing trends – but only if you know exactly what you are looking for. Harmonic patterns are formed by combining geometric shapes and Fibonacci levels. As a result, Fibonacci levels are the key concept of these patterns. Identifying harmonic patterns requires more practice than other market classical patterns. But by learning these patterns, you can recognize the future trend of the price chart. These patter
Концепция спроса и предложения с возвратом к среднему значению Концепция торговли по спросу и предложению полагается на несовпадение объемов покупок и продаж на финансовых рынках. Для обычных трейдеров зоны спроса и предложения служат точками разворота. При рассмотрении первоначальной концепции было обнаружено, что первоначальная торговля по спросу и предложению может выполняться лучше на периоде возврата к среднему значению, а не на периоде тренда. Для демонстрации этой концепции, чтобы какая-л
Channel Vertex is a price action pattern formed by price Chanel and a triangle pattern . Price channels basically indicates possible support and resistance zones around a price movement and retracement    or breakout at these levels can indicate possible trend continuation or reversal .  Majority of the times price fluctuations forms triangle patterns defined by 3 vertexes , these triangle patterns most times defines a trend continuation.  A triangle pattern is a trend continuation pattern tha
Индикатор который показывает на графике точки разворота цены. Индикатор с помощью RSI и других стандартных индикаторов определяет точки разворота цены и показывает их на графике стрелками. Индикатор не перерисовывает свои значения и в 95% случаев показывает точные сигналы. Этот индикатор работает на всех валютных парах и всех таймфреймах. Как торговать с этим индикатором (рекомендации): Мы рекомендуем открывать сделки в сторону появившейся стрелки. Если появляется синяя стрелка, открываем ор
PW Oscillator   - индикатор предназначенный для поиска локальных экстремумов, определения текущей тенденции. В расчетах индикатора используется авторская методика. С помощью индикатора можно определять места возможного разворота цены желательно в направлении тенденции, но также с достаточной точностью и против нее. Также с помощью индикатора можно определять текущую тенденцию. Индикатор подходит для любых валютных пар, но для адекватного отображения показания необходимо, чтобы было достаточно ис
Этот индикатор предвидит разворот цены, анализируя бычье и медвежье давление на рынке. Давление покупки - это сумма всех накопительных баров за определенное количество дней, умноженная на объем. Давление продажи - это сумма всех распределений за одинаковое количество баров, умноженная на объем. [ Руководство по установке | Руководство по обновлению | Устранение неполадок | FAQ | Все продукты ] Коэффициент индикатора дает вам меру давления покупателей в процентах от общей активности, значение ко
Технический индикатор рассчитывающий свои показания на объемах торгов. В виде гистограммы показывает накопление силы движения торгового инструмента. Имеет независимые системы расчета для бычьего и медвежьего направления. Работает на любых торговых инструментах и тайм-фреймах. Может дополнить любую торговую систему. Индикатор не перерисовывает своих значений, сигналы появляются на текущей свече. Прост в использовании и не загружает график, не  требует производить дополнительные расчеты параметр
Introduction This indicator detects volume spread patterns for buy and sell opportunity. The patterns include demand and supply patterns. You might use each pattern for trading. However, these patterns are best used to detect the demand zone (=accumulation area) and supply zone (=distribution area). Demand pattern indicates generally potential buying opportunity. Supply pattern indicates generally potential selling opportunity. These are the underlying patterns rather than direct price action. T
FREE
MACD Intraday Trend PRO - это индикатор, разработанный на основе адаптации оригинального MACD, созданного Джеральдом Аппелем в 1960-х годах. За годы торговли было замечено, что, изменяя параметры MACD с пропорциями Фибоначчи, мы достигаем лучшего представления непрерывности движений тренда, что позволяет более эффективно обнаруживать начало и конец ценового тренда. Благодаря своей эффективности в обнаружении ценовых тенденций, также можно очень четко идентифицировать расхождения вершин и ос
С этим продуктом покупают
В НАСТОЯЩЕЕ ВРЕМЯ СКИДКА 26% Лучшее решение для новичка или трейдера-эксперта! Этот индикатор является уникальным, высококачественным и доступным торговым инструментом, поскольку мы включили в него ряд собственных функций и новую формулу. С помощью всего лишь ОДНОГО графика вы можете определить силу валюты для 28 пар Форекс! Представьте, как улучшится ваша торговля, потому что вы сможете точно определить точку запуска нового тренда или возможность скальпирования? Руководство пользователя:
74% discount for the next 10 buyers (original price $605): 1 left Get a 50% bonus by buying (or even renting) any of our products. After buying (or renting), send a message for more information. 3 Indicators in 1 indicator Strategy based on price action Made specifically for the best forex currency pairs Can be used in the best time frame of the market at a very reasonable price This indicator is basically 3 different indicatos . But we have combined these 3 indicators in 1 indicator so th
Прежде всего стоит подчеркнуть, что этот торговый индикатор не перерисовывается, не перерисовывает и не отставает, что делает его идеальным как для ручной, так и для роботизированной торговли. Руководство пользователя: настройки, вводы и стратегия. Атомный аналитик - это индикатор ценового действия PA, который использует силу и импульс цены, чтобы найти лучший край на рынке. Оборудованный расширенными фильтрами, которые помогают убирать шумы и ложные сигналы, и повышают торговый потенциал. Испо
Важным ключевым элементом в трейдинге являются зоны или уровни, от которых принимаются решения о покупке или продаже торгового инструмента. Несмотря на попытки крупных игроков скрыть свое присутствие на рынке, они неизбежно оставляют следы. Наша задача заключалась в том, чтобы научиться находить эти следы и правильно их интерпретировать. Первые Импульсные Уровни (ПИУ)     -      Reversal First Impulse levels (RFI)   -  Version MT5                INSTRUCTIONS                 RUS                 E
TPSpro TRENDPRO   —  трендовый индикатор, который автоматически анализирует рынок и предоставляет информацию о тренде и каждой его смене а также дающий сигналы для входа в сделки без перерисовки! Индикатор использует каждую свечу, анализируя их отдельно. относя к разным импульсам – импульс вверх или вниз. Точные точки входа в сделки  для  валют, крипты, металлов, акций, индексов! -  Version MT5                   ПОЛНОЕ ОПИСАНИЕ          /        СЕТАПЫ ДЛЯ ТОРГОВЛИ                        Реком
Представляем       Индикатор Quantum Trend Sniper   , инновационный индикатор MQL5, который меняет способ определения разворотов тренда и торговли ими! Разработан командой опытных трейдеров со стажем торговли более 13 лет,       Снайперский индикатор Quantum Trend       разработан, чтобы вывести ваше торговое путешествие на новые высоты благодаря инновационному способу определения разворотов тренда с чрезвычайно высокой точностью. ***Купите индикатор Quantum Trend Sniper и получите индикатор
Инновационный индикатор, использующий эксклюзивный алгоритм для быстрого и точного определения тренда. Индикатор автоматически рассчитывает время открытия и закрытия позиций, а также подробную статистику работы индикатора на заданном отрезке истории, что позволяет выбрать наилучший торговый инструмент для торговли. Вы также можете подключить свои пользовательские стрелочные индикаторы к Scalper Inside Pro для проверки и расчета их статистики и прибыльности. Scalper Inside PRO инструкция и настро
Advanced Supply Demand
Bernhard Schweigert
4.92 (310)
Этот индикатор является уникальным, качественным и доступным инструментом для торговли, включающим в себя наши собственные разработки и новую формулу. В обновленной версии появилась возможность отображать зоны двух таймфреймов. Это означает, что вам будут доступны зоны не только на старшем ТФ, а сразу с двух таймфреймов - таймфрейма графика и старшего: отображение вложенных зон. Обновление обязательно понравится всем трейдерам, торгующим по зонам спроса и предложения. Важная информация Для мак
FX Volume
Daniel Stein
4.6 (35)
Получайте ежедневную информацию о рынке с подробностями и скриншотами в нашем утреннем брифинге здесь, на mql5 , и в Telegram ! FX Volume - это ПЕРВЫЙ и ЕДИНСТВЕННЫЙ индикатор объема, который дает РЕАЛЬНОЕ представление о настроении рынка с точки зрения брокера. Он дает потрясающее представление о том, как институциональные участники рынка, такие как брокеры, позиционируют себя на рынке Forex, гораздо быстрее, чем отчеты COT. Видеть эту информацию прямо на своем графике - это настоящий геймчей
Откройте для себя секрет успешной торговли форекс с нашим пользовательским индикатором MT4! Задумывались ли вы, как добиться успеха на рынке Forex, постоянно зарабатывая прибыль при минимизации риска? Вот ответ, который вы искали! Позвольте нам представить наш собственный индикатор MT4, который будет революционизировать ваш подход к торговле. Уникальная универсальность Наш индикатор специально разработан для пользователей, которые предпочитают формирования свечей Renko и Rangebar. Мы пони
Получайте ежедневную информацию о рынке с подробностями и скриншотами через наш утренний брифинг здесь, на mql5 , и в Telegram ! FX Power MT4 NG - это новое поколение нашего популярного измерителя силы валют FX Power. Что же предлагает этот измеритель силы нового поколения? Все, что вы любили в оригинальном FX Power ПЛЮС Анализ силы GOLD/XAU Еще более точные результаты расчетов Индивидуально настраиваемые периоды анализа Настраиваемый предел расчета для еще более высокой производительности Спец
Представляем       Quantum Breakout PRO   , новаторский индикатор MQL5, который меняет ваш способ торговли в зонах прорыва! Разработанная командой опытных трейдеров с опытом торговли более 13 лет,   Quantum Breakout PRO   предназначена для того, чтобы вывести ваше торговое путешествие на новые высоты благодаря своей инновационной и динамичной стратегии зон прорыва. Quantum Breakout Indicator покажет вам сигнальные стрелки на зонах прорыва с 5 целевыми зонами прибыли и предложением стоп-лос
Индикатор обнаруживает гармонические паттерны, которые строятся на графике с помощью ручных и автоматических методов. Руководство пользователя доступно по этой ссылке: Add Your review And contact us to get it Это бесплатная версия продукта. Вы можете использовать его для обнаружения паттернов Gartley и Nenstar: https://www.mql5.com/ru/market/product/30181 Примечания Если вы используете Windows 10, нажмите на иконку MetaTrader правой кнопкой мыши > "Совместимость" > "Переопределите режим масш
В настоящее время скидка 20%! Лучшее решение для новичка или трейдера-эксперта! Эта приборная панель работает на 28 валютных парах. Он основан на 2 наших основных индикаторах (Advanced Currency Strength 28 и Advanced Currency Impulse). Он дает отличный обзор всего рынка Forex. Он показывает значения Advanced Currency Strength, скорость движения валюты и сигналы для 28 пар Forex на всех (9) таймфреймах. Представьте, как улучшится ваша торговля, когда вы сможете наблюдать за всем рынком с пом
GOLD Impulse with Alert
Bernhard Schweigert
4.56 (9)
Этот индикатор является супер комбинацией двух наших продуктов Advanced Currency IMPULSE with ALERT  +   Currency Strength Exotics . Он работает на всех временных рамках и графически показывает импульс силы или слабости для 8 основных валют плюс один символ! Этот индикатор специализирован для отображения ускорения силы валюты для любых символов, таких как золото, экзотические пары, товары, индексы или фьючерсы. Первый в своем роде, любой символ может быть добавлен в 9-ю строку, чтобы пока
TrendMaestro
Stefano Frisetti
5 (2)
note: this indicator is for METATRADER4, if you want the version for METATRADER5 this is the link:  https://www.mql5.com/it/market/product/108106 TRENDMAESTRO ver 2.4 TRENDMAESTRO recognizes a new TREND in the bud, he never makes mistakes. The certainty of identifying a new TREND is priceless. DESCRIPTION TRENDMAESTRO identifies a new TREND in the bud, this indicator examines the volatility, volumes and momentum to identify the moment in which there is an explosion of one or more of these data a
PRO Renko System - это высокоточная система торговли на графиках RENKO. Система универсальна. Данная торговая система может применяться к различным торговым инструментам. Система эффективно нейтрализует так называемый рыночный шум, открывая доступ к точным разворотным сигналам. Индикатор прост в использовании и имеет лишь один параметр, отвечающий за генерацию сигналов. Вы легко можете адаптировать алгоритм к интересующему вас торговому инструменту и размеру ренко бара. Всем покупателям с удовол
Volatility Trend System - торговая система дающая сигналы для входов.  Система волатильности дает линейные и точечные сигналы в направлении тренда, а также сигналы выхода из него, без перерисовки и запаздываний. Трендовый индикатор следит за направлением среднесрочной тенденции, показывает направление и ее изменение. Сигнальный индикатор основан на изменении волатильности, показывает входы в рынок. Индикатор снабжен несколькими типами оповещений. Может применяться к различным торговым инструм
СЕЙЧАС СКИДКА 31% !!! Лучшее решение для новичка или трейдера-эксперта! Этот индикатор является уникальным, высококачественным и доступным торговым инструментом, поскольку мы включили в него ряд собственных функций и секретную формулу. Всего на ОДНОМ графике он выдает алерты по всем 28 валютным парам. Представьте, как улучшится ваша торговля, ведь вы сможете точно определить точку запуска нового тренда или возможность скальпирования! Построенный на новых базовых алгоритмах, он позволяет е
Automated Trendlines
Georgios Kalomoiropoulos
5 (16)
Линии тренда являются наиболее важным инструментом технического анализа в торговле на рынке Форекс. К сожалению, большинство трейдеров рисуют их неправильно. Индикатор Automated Trendlines — это профессиональный инструмент для серьезных трейдеров, который поможет вам визуализировать трендовое движение рынков. Есть два типа линий тренда: бычьи линии тренда и медвежьи линии тренда. В восходящем тренде линия тренда Форекс проводится через самые низкие точки колебания ценового движения. Сое
Чрезвычайно удобный индикатор, воистину делающий легким процесс заработка денег на бирже.   Основан   на разработанной автором   научно-строгой теории рынка, начало которой представлено   здесь .                   Полный алгоритм работы данного индикатора   представлен в статье .                  Индикатор   рассчитывает  наиболее вероятную траекторию движения цены и отображает это на графике. Из прогнозируемой траектории движения цены  индикатор  рассчитывает направление  позиции
Цикличный индикатор для торговли и прогнозирования направления рынка. Показывает цикличное поведение цены в виде осциллятора. Дает сигналы открытия сделок при отбое от верхних и нижних границ осциллятора. В виде гистограммы показывает сглаженную силу тренда. Дополнит любую стратегию торговли, от скальпинга до внутри-дневной. Индикатор не перерисовывается. Подходит для использования на всех символах/инструментах. Подходящие тайм-фреймы для краткосрочного трейдинга M5, M15, M30. Для дневной и бо
Представляем индикатор астрономии для MT4: Ваш незаменимый небесный товарищ в торговле Готовы ли вы поднять свой опыт торговли до небесных высот? Не ищите дальше, чем наш революционный индикатор астрономии для MT4. Этот инновационный инструмент выходит за рамки традиционных торговых индикаторов, используя сложные алгоритмы для предоставления вам беспрецедентных астрономических понимания и точных расчетов. Вселенская информация под рукой: Взгляните на обширную панель, раскрывающую сокровищницу ас
Пожалуйста, переведите наше английское описание для полного объяснения, так как здесь недостаточно символов. Позволяет объединить несколько индикаторов в один индикатор как визуально, так и с точки зрения оповещения. Индикаторы могут включать стандартные индикаторы, например RSI, CCI и т. Д., А также пользовательские индикаторы, даже те, которые куплены через Market, или где есть файл ex4. Обеспечивается раннее оповещение, например, когда 4 из 5 индикаторов выстроились в линию, и подтвержденное
Представляем ON Trade Waves Patterns Harmonic Elliot Wolfe, передовой индикатор, разработанный для обнаружения разнообразных рыночных паттернов с использованием как ручных, так и автоматизированных методов. Вот как это работает: Гармонические паттерны: Этот индикатор может определять гармонические паттерны, появляющиеся на вашем графике. Эти паттерны важны для трейдеров, практикующих теорию гармонической торговли, как это описано в книге Скотта Карни "Гармоническая Торговля том 1 и 2". Независи
WARNING: PRICE IS SUBJECT TO RISE AT ANY TIME. GET YOUR COPY TODAY TO AVOID MORE COST! Dear Traders I am so glad to introduce to you my other tool called the Forex Sniper Entries Indicator. This tool is designed to help serious traders and investors capture big moves in the currency price movements. The philosophy behind this tool is all about winning big and riding the price movement from its beginning until the maximum point. We want to capture those big moves in both down and up markets as mu
Способ применения Pair Trading Station Рекомендуется использовать Pair Trading Station на таймфрейме H1 с любой валютной парой. Чтобы получить сигналы на покупку и продажу, следуйте указанным ниже инструкциям по применению Pair Trading Station в терминале MetaTrader. При загрузке Pair Trading Station на график индикатор оценит доступные исторические данные на вашей платформе MetaTrader для каждой валютной пары. В самой начале на графике отобразятся исторические данные, доступные для каждой валют
Этот индикатор разработан для интеграции с теорией Эллиотта и предоставляет два различных способа работы: Автоматический режим: В этом режиме индикатор работает автономно, обнаруживая все пять мотивационных волн на графике в соответствии с теорией Эллиотта. Он предсказывает и идентифицирует потенциальные зоны разворота. Кроме того, он способен генерировать предупреждения и уведомления для оповещения трейдеров о значимых событиях. Эта автоматизированная функциональность упрощает процесс идентифик
MetaTrend M4
Vahidreza Heidar Gholami
5 (1)
Meta Trend Indicator is an efficient way to forecast and detect the trend in any market. It reveals the trend, support and resistance levels, volatility and the maximum potential target, all in one indicator. To adapt to the price and to decrease consecutive trend failures, the internal trend detector algorithm studies the market and dynamically chooses the right values for the internal parameters. This indicator is a perfect trend filter for any strategy or expert advisor. Features Super Adapti
Gold Trend – хороший биржевой технический индикатор. Алгоритм индикатора анализирует движение цены актива и отражает волатильность и потенциальные зоны для входа. Самые лучшие сигналы индикатора: Для SELL = красная гистограмма + красный указатель SHORT + желтая сигнальная стрелка в этом же направлении. Для BUY = синяя гистограмма + синий указатель LONG + аква сигнальная стрелка в этом же направлении. Преимущества индикатора: И ндикатора выдает сигналы с высокой точностью. Подтвержденный сигн
Другие продукты этого автора
OVERVIEW A Lorentzian Distance Classifier (LDC) is a Machine Learning classification algorithm capable of categorizing historical data from a multi-dimensional feature space. This indicator demonstrates how Lorentzian Classification can also be used to predict the direction of future price movements when used as the distance metric for a novel implementation of an Approximate Nearest Neighbors (ANN) algorithm. This indicator provide signal as buffer, so very easy for create EA from this in
This indicator provides the ability to recognize the SMC pattern, essentially a condensed version of the Wyckoff model. Once the pattern is confirmed by RTO, it represents a significant investment opportunity.    There are numerous indicators related to SMC beyond the market, but this is the first indicator to leverage patterns to identify specific actions of BigBoy to  navigate the market. Upgrade 2024-03-08: Add TP by RR feature. The SMC (Smart Money Concept)   pattern   is a market analysis m
This indicator builds upon the previously posted Nadaraya-Watson Estimator. Here we have created an envelope indicator based on kernel smoothing with integrated alerts from crosses between the price and envelope extremities. Unlike the Nadaraya-Watson Estimator, this indicator follows a contrarian methodology. Please note that the indicator is subject to repainting. The triangle labels are designed so that the indicator remains useful in real-time applications. Settings Window Size: Dete
The Inversion Fair Value Gaps (IFVG) indicator is based on the inversion FVG concept by ICT and provides support and resistance zones based on mitigated Fair Value Gaps (FVGs). Image 1   USAGE Once mitigation of an FVG occurs, we detect the zone as an "Inverted FVG". This would now be looked upon for potential support or resistance. Mitigation occurs when the price closes above or below the FVG area in the opposite direction of its bias. (Image 2) Inverted Bullish FVGs Turn into P
This all-in-one indicator displays real-time market structure (internal & swing BOS / CHoCH), order blocks, premium & discount zones, equal highs & lows, and much more...allowing traders to automatically mark up their charts with widely used price action methodologies. Following the release of our Fair Value Gap script, we received numerous requests from our community to release more features in the same category. "Smart Money Concepts" (SMC) is a fairly new yet widely used term amongst price a
Overview The   Volume SuperTrend AI   is an advanced technical indicator used to predict trends in price movements by utilizing a combination of traditional SuperTrend calculation and AI techniques, particularly the k-nearest neighbors (KNN) algorithm. The Volume SuperTrend AI is designed to provide traders with insights into potential market trends, using both volume-weighted moving averages (VWMA) and the k-nearest neighbors (KNN) algorithm. By combining these approaches, the indicat
The Bheurekso Pattern Indicator for MT5 helps traders automatically identify candlestick pattern that formed on the chart base on some japanese candle pattern and other indicator to improve accurate. This indicator scans all candles, recognizes and then displays any candle patterns formed on the chart. The candle displayed can be Bullish or Bearish Engulfing, Bullish or Bearish Harami, and so on. There are some free version now but almost that is repaint and lack off alert function. With this ve
The Breaker Blocks with Signals indicator aims to highlight a complete methodology based on breaker blocks. Breakout signals between the price and breaker blocks are highlighted and premium/discount swing levels are included to provide potential take profit/stop loss levels. This script also includes alerts for each signal highlighted.   SETTINGS   Breaker Blocks Length: Sensitivity of the detected swings used to construct breaker blocks. Higher values will return longer te
This indicator presents an alternative approach to identify Market Structure. The logic used is derived from learning material created by   DaveTeaches (on X) When quantifying Market Structure, it is common to use fractal highs and lows to identify "significant" swing pivots. When price closes through these pivots, we may identify a Market Structure Shift (MSS) for reversals or a Break of Structure (BOS) for continuations. The main difference with this "protected" logic is in how we determine
This indicator shows when user set sessions are active and returns various tools + metrics using the closing price within active sessions as an input. Users have the option to change up to 4 session times. The indicator will increasingly lack accuracy when the chart timeframe is higher than 1 hour. Settings Sessions Enable Session: Allows to enable or disable all associated elements with a specific user set session. Session Time: Opening and closing times of the user set session
Introducing the Reversal and Breakout Signals   This innovative tool is crafted to enhance your chart analysis by identifying potential reversal and breakout opportunities directly on your charts. It's designed with both novice and experienced traders in mind, providing intuitive visual cues for better decision-making. Let's dive into the key features and how it operates: ###   Key Features:   Dynamic Period Settings:   Customize the sensitivity of the indicator with use
Introduction "Smart money" is money invested by knowledgeable individuals at the right time, and this investment can yield the highest returns. The concept we focus on in this indicator is whether the market is in an uptrend or downtrend. The market briefly takes a weak and reversal trend with "Minor BoS" without being able to break the major pivot. In the next step, it returns to its main trend with a strong bullish move and continues its trend with a "Major BoS". The "order bloc
This is a Forex Scalping Trading Sytem based on the Bollinger Bands.  Pairs:Major Time frame: 1M or higher. Spread max:0,0001.  Indicators (just suggestion) Bollinger bands (20, 2); ADX (14 period); RSI   (7 period ). Y ou should only trade this system between 2am to 5am EST, 8am to 12am EST and 7.30pm to 10pm EST. Do not scalp 30 minutes before a orange or red news  report and not for a hour afterwards.   Setup: is for price to move above the lower or lower Bollinger Bands, RSI raise above the
FREE
The Buyside & Sellside Liquidity indicator aims to detect & highlight the first and arguably most important concept within the ICT trading methodology,   Liquidity   levels. SETTINGS Liquidity Levels Detection Length: Lookback period Margin: Sets margin/sensitivity for a liquidity level detection Liquidity Zones Buyside Liquidity Zones: Enables display of the buyside liquidity zones. Margin: Sets margin/sensitivity for the liquidity zone boundaries. Color: Color option
This all-in-one indicator displays real-time market structure (internal & swing BOS / CHoCH), order blocks, premium & discount zones, equal highs & lows, and much more...allowing traders to automatically mark up their charts with widely used price action methodologies. Following the release of our Fair Value Gap script, we received numerous requests from our community to release more features in the same category. //------------------------------------// Version 1.x has missing functions + PDAr
Consolidation is when price is moving inside a clear trading range. When prices are consolidated it shows the market maker placing orders on both sides of the market. This is mainly due to manipulate the un informed money. This indicator automatically identifies consolidation zones and plots them on the chart. The method of determining consolidation zones is based on pivot points and ATR, ensuring precise identification. The indicator also sends alert notifications to users when a new consolida
This is addition of  Effective SV squeeze momentum  that add bolliger band and Keltner channel to chart window.  Squeeze momentum introduced by “John Carter”, the squeeze indicator for MT5 represents a volatility-based tool. Regardless, we can also consider the squeeze indicator as a momentum indicator, as many traders use it to identify the direction and strength of price moves. In fact, the Tradingview  squeeze indicator shows when a financial instrument is willing to change from a trending ma
FREE
All about Smart Money Concepts Strategy: Market struture: internal or swing BOS, CHoCH; Orderblock; Liquity equal; Fair Value Gap with Consequent encroachment, Balanced price range; Level with Previous month, week, day level or in day level (PMH, PWH, PDH, HOD); BuySell Stops Liquidity (BSL, SSL); Liquidity Void Long Wicks; Premium and Discount; Candle pattern ... "Smart Money Concepts" ( SMC ) is a fairly new yet widely used term amongst price action traders looking to more accurately navigate
The indicator returning pivot point based trendlines with highlighted breakouts . Trendline caculated by pivot point and other clue are ATR, Stdev. The indicator also includes integrated alerts for  trendlines  breakouts and foward message to Telegram channel or group if you want. Settings ·          Lookback bar: Default 200 is number of bar caculate when init indicator. ·          Length:  Pivot points  period ·          Slope Calculation Method: Determines how this lope is calculated. We supp
The indicator   returning pivot point based trendlines with highlighted breakouts . Trendline caculated by pivot point and other clue are ATR, Stdev.   The indicator also includes integrated alerts for  trendlines  breakouts   and foward message to Telegram channel or group if you want. Settings ·            Lookback bar: Default 200 is number of bar caculate when init indicator. ·            Length:  Pivot points  period ·            Slope Calculation Method: Determines how this lope is calcula
All about Smart Money Concepts Strategy: Market struture: internal or swing BOS, CHoCH; Orderblock; Liquity equal; Fair Value Gap with Consequent encroachment, Balanced price range; Level with Previous month, week, day level or in day level (PMH, PWH, PDH, HOD); BuySell Stops Liquidity (BSL, SSL); Liquidity Void Long Wicks; Premium and Discount; Candle pattern ... "Smart Money Concepts" ( SMC ) is a fairly new yet widely used term amongst price action traders looking to more accurately navigate
The Breaker Blocks with Signals indicator aims to highlight a complete methodology based on breaker blocks. Breakout signals between the price and breaker blocks are highlighted and premium/discount swing levels are included to provide potential take profit/stop loss levels. This script also includes alerts for each signal highlighted.   SETTINGS   Breaker Blocks Length: Sensitivity of the detected swings used to construct breaker blocks. Higher values will return longer te
There are many linear regression indicators out there, most of them draw lines or channels, but this one actually draws a chart. The beauty of the indicator like Heiken Ashi is it removes a lot of market noise. 4 (OHLC) arrays are filled with Linear Regression(LR) values of each price for the LR period (default=14). The period of the Linear Regression is adjustable dependant on the market conditions. The SMA (default=14) also has period adjustment. Candles are generated with Green for 'Up' cand
ICT Concepts
Minh Truong Pham
5 (2)
The ICT Concepts indicator regroups core concepts highlighted by trader and educator "The Inner Circle Trader" (ICT) into an all-in-one toolkit. Features include Market Structure (MSS & BOS), Order Blocks, Imbalances, Buyside/Sellside Liquidity, Displacements, ICT Killzones, and New Week/Day Opening Gaps. It’s one kind of Smart money concepts. USAGE: Please read this document  !    DETAILS Market Structure Market structure labels are constructed from price breaking a prior extreme point. T
The ICT Concepts indicator regroups core concepts highlighted by trader and educator "The Inner Circle Trader" (ICT) into an all-in-one toolkit. Features include Market Structure (MSS & BOS), Order Blocks, Imbalances, Buyside/Sellside Liquidity, Displacements, ICT Killzones, and New Week/Day Opening Gaps. It’s one kind of Smart money concepts.   USAGE:   Please read this   document  !      DETAILS Market Structure Market structure labels are constructed from price breaking a prior extreme
The ICT Silver Bullet indicator is inspired from the lectures of "The Inner Circle Trader" (ICT) and highlights the Silver Bullet (SB) window which is a specific 1-hour interval where a Fair Value Gap (FVG) pattern can be formed. A detail document about ICT Silver Bullet here . There are 3 different Silver Bullet windows (New York local time): The London Open Silver Bullet (3 AM — 4 AM ~ 03:00 — 04:00) The AM Session Silver Bullet (10 AM — 11 AM ~ 10:00 — 11:00) The PM Session Silver Bullet
A problem when indicator call webrequest is "The WebRequest() function is synchronous, which means its breaks the program execution and waits for the response from the requested server. Since the delays in receiving a response can be large, the function is not available for calls from indicators, because indicators run in a common thread shared by all indicators and charts on one symbol. Indicator performance delay on one of the charts of a symbol may stop updating of all charts of the same symb
FREE
An Implied Fair Value Gap (IFVG) is a three candles imbalance formation conceptualized by ICT that is based on detecting a larger candle body & then measuring the average between the two adjacent candle shadows. This indicator automatically detects this imbalance formation on your charts and can be extended by a user set number of bars. The IFVG average can also be extended until a new respective IFVG is detected, serving as a support/resistance line. Alerts for the detection of bull
OVERVIEW K-means is a clustering algorithm commonly used in machine learning to group data points into distinct clusters based on their similarities. While K-means is not typically used directly for identifying support and resistance levels in financial markets, it can serve as a tool in a broader analysis approach. Support and resistance levels are price levels in financial markets where the price tends to react or reverse. Support is a level where the price tends to stop falling
The FollowLine indicator is a trend following indicator. The blue/red lines are activated when the price closes above the upper Bollinger band or below the lower one. Once the trigger of the trend direction is made, the FollowLine will be placed at High or Low (depending of the trend). An ATR filter can be selected to place the line at a more distance level than the normal mode settled at candles Highs/Lows. Some features: + Trend detech + Reversal signal + Alert teminar / mobile app
Фильтр:
Нет отзывов
Ответ на отзыв
Версия 1.4 2024.02.16
add buffer for historical candle
Версия 1.3 2024.02.15
Add buffer as following:

0: buff_buy_entry
1: buff_buy_stoploss
2: buff_buy_take profit
//---
3: buff_sell_ent
4: buff_sell_sl
5: buff_sell_tp

Default value =0. When have unicorn signal, the candle will have buffer value as price.