The adrenalin rush
- Индикаторы
- Allistair Kabelo Mandow
- Версия: 1.2
- Активации: 5
Key Features
A key concept of technical analysis is that when a resistance or support level is broken, its role is reversed. If the price falls below a support level, that level will become resistant. If the price rises above a resistance level, it will often become support.
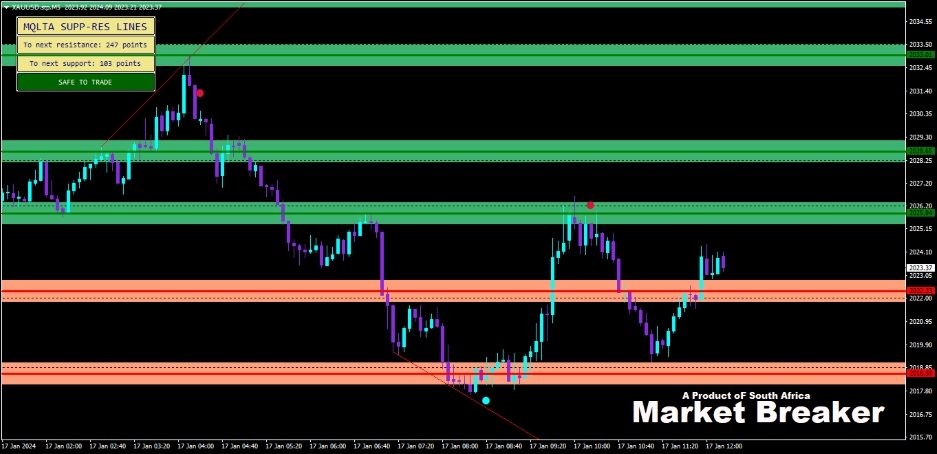
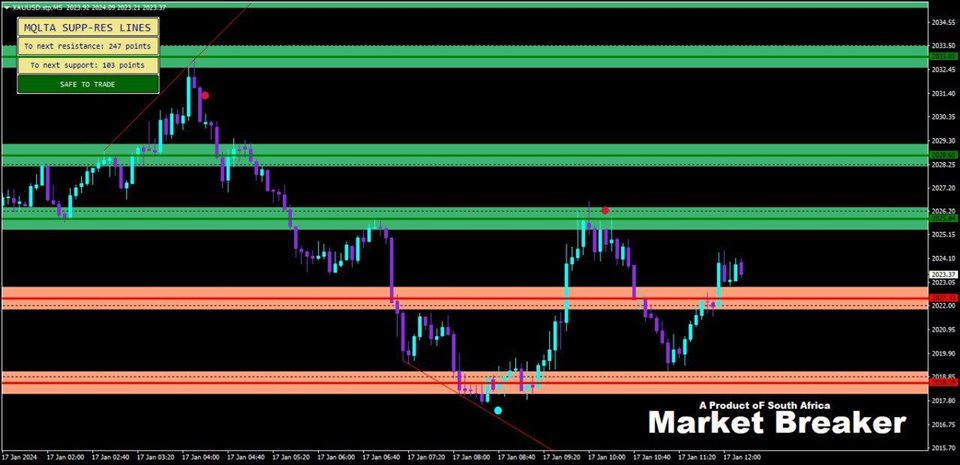
Horizontal support and resistance levels are the most basic type of these levels. They're simply identified by a horizontal line:
- Green Level in the chart, is Resistance Level.
- Red Level in the chart, is a Support Level.
Our Support and resistance are used to identify key levels where the trend in price has a greater probability of halting and possibly changing direction. It can be a specific price or price area. Interpretation of the degree of significance of a level depends on a trader's time frame.
Documentations ( Instructions )
All the PR Support and Resistance indicator, documentations (Instructions) are available in OUR PRIVATE GROUPS AND VIIP CHANNEL DROP A PRIVATE MESSAGE
Advantage of our Price action Support and Resistance
- Working with all pairs (Forex, Crypto, Indices, and commodities)
- Working with all timeframes. (Recommended time frame: H1 and H4 timeframes)
- Alert generator. (Pop-up alert, Push Notification Alerts...etc)
- 100% Indicator
Attention! All our paid products can be found only and on exclusivity here, on the official MQL5 website.
Contact
If you have some questions or if you need help, contact me via Private Message.
Author
ALLSTAIR MANDOW, fintech software engineer and founder of PYTHONFX.
