• Обзор
  • Отзывы
  • Обсуждение
  • Что нового

ChartGetTools

All in one Indicator. Multiple market analysis tools. Non-Repaint Oscillator signals, Trend lines, Price channel, Fibonacci levels, Support and Resistance, Regression, Pivot levels, Candle Strength and Oversold/Overbought line detector. Includes buttons to hide or show. Advanced algorithms to detect important reversal points and draw trend lines or shapes automatically in appropriate areas. A simple and professional chart display, user friendly and easier to understand for faster and accurately decisions.

Sends warning messages to all alert features available in Metatrader 4. With the option to activate or deactivate.

Recommended timeframe: M5 to H4.

Instrument/symbols: any


Advantages:

  1. Each feature can be hidden or displayed, making it possible to use just one or several features and collaborate with your own strategy.
  2. Each feature has its own settings independently, except the circle of arrows. So, you are free to adjust it according to your trading strategy.
  3. Maximum License Activations.
  4. Non-Repaint arrows.
  5. Responsive button and Candle Strength bars display
  6. Auto color adjustment based on the market direction.


Parameters

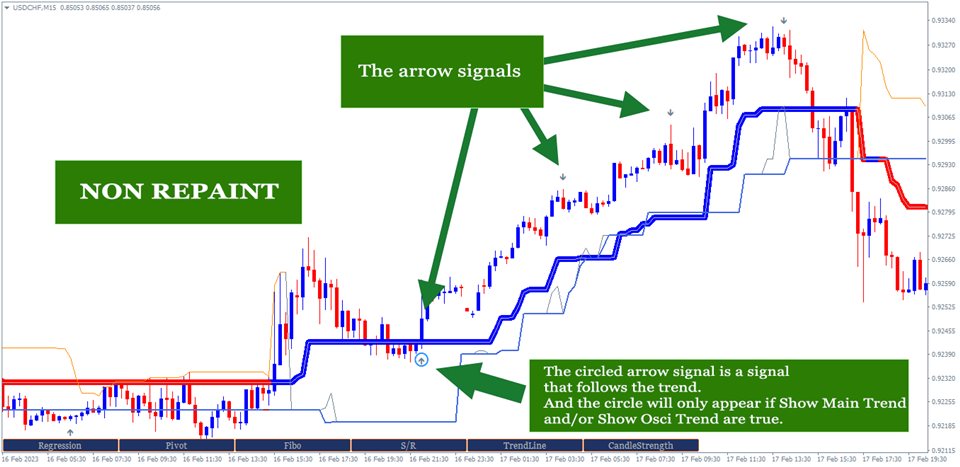
  1. Show Main Trend. Option true/false to show/hide the Main trend. The Main trend can be seen on the screenshot. Highly recommended to set it to be true except you have your own plan/reason or you want to use certain part of its features to complete your existing strategy. 
  2. Main Trend Period. The Period of Bars to calculate the main trend.
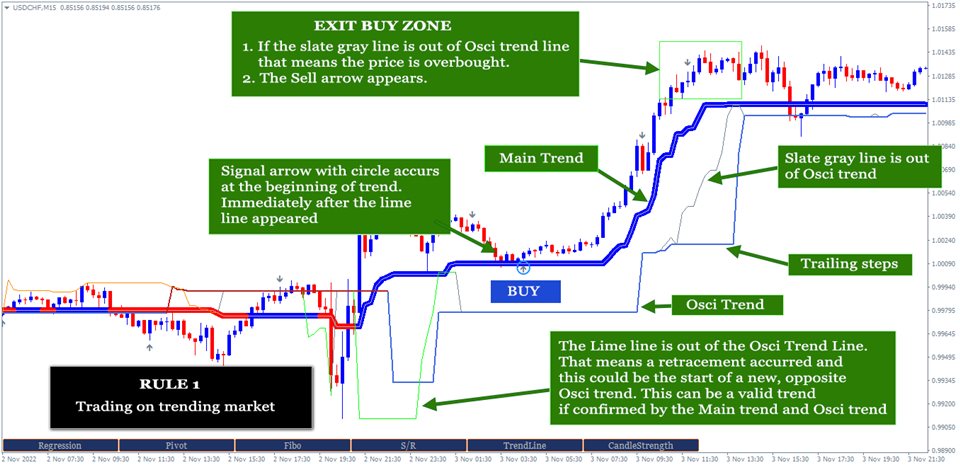
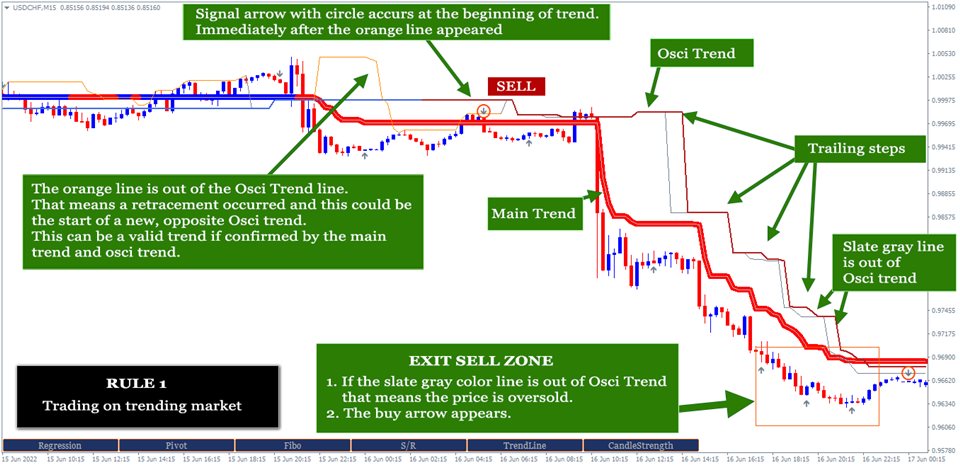
  3. Show Osci Trend. Option true/false to show/hide the Osci trend. The Osci trend can be seen on the screenshot. It is a second trend that can detect the trend early. And this trend is also followed by the 3 other sub trends. Their colors are Orange, SlateGray and Lime. Orange color appears at the beginning of downtrend, Lime at the beginning of uptrend and SlateGray appears as sign of oversold or overbought.  Highly recommended to set it to be true except you have your own plan/reason or you want to use certain part of its features to complete your existing strategy. The circle of arrows will not appear if Show Main Trend: false and Show Osci trend: false.
  4. Osci Trend Period. The Period of Bars to calculate Osci trend.
  5. Show Signal Arrows. Option to show/hide the signal arrows. Non repaint, non-lagging arrows as a trigger of trading exit/entry. Arrows with circle are the trend following arrows that can be used for entry and the ones without circle are for exit with the rules can be seen on the screenshot.
  6. Signal Period. The period of signal. Recommended minimum value 5 and maximum 30.
  7. Use Maximum Bars. Option to use the number of bars to calculate trend and signals. Recommended to set it by default if you get low performance in your MT4.
  8. Maximum Bar. Define the number of bars here if point 7 above is true. The default value 500.
  9. Show Analysis buttons. Option true/false to show/hide tool buttons at the bottom of chart.
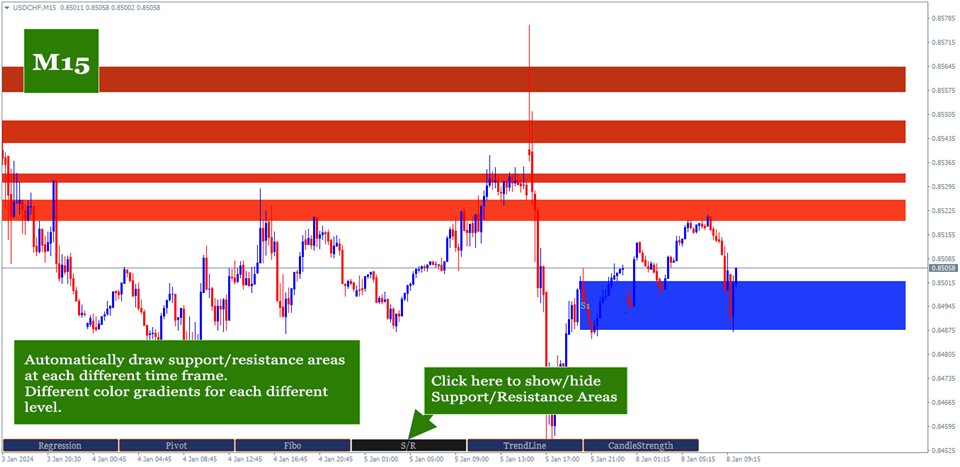
  10. Support/Resistance Period.  The indicator will look for reversal points at every number of bars specified here until up to 1000 bars back. And it will draw Support/Resistance area based on the data.
  11. Support/Resistance Strength.  This value is the minimum number of reversal points - highest high and lowest low - in the past that the indicator must count to display Support/Resistance area. The idea is that the higher the number, the higher the probability of a reversal in the future. If the entered value is not found in the existing history, the indicator will not display Support/Resistance areaSo, the lower the value entered, the more Support/Resistance areas will possibly be displayed but with lower strength and vice versa.
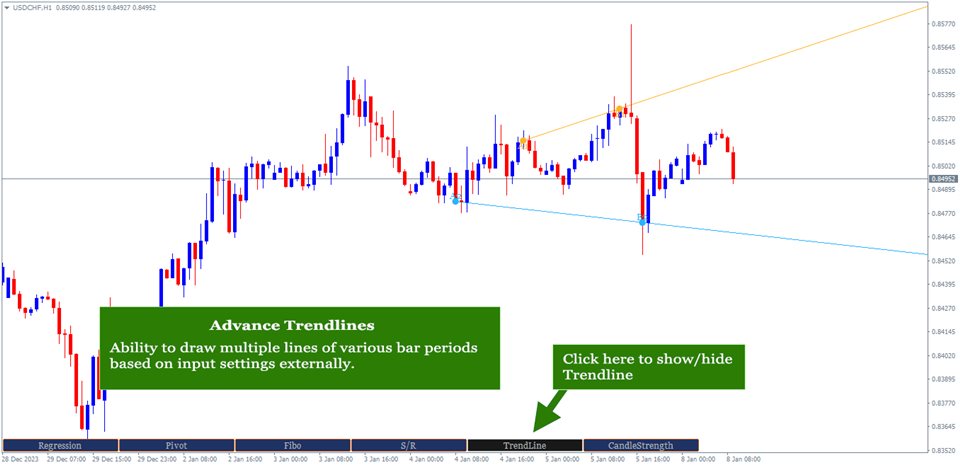
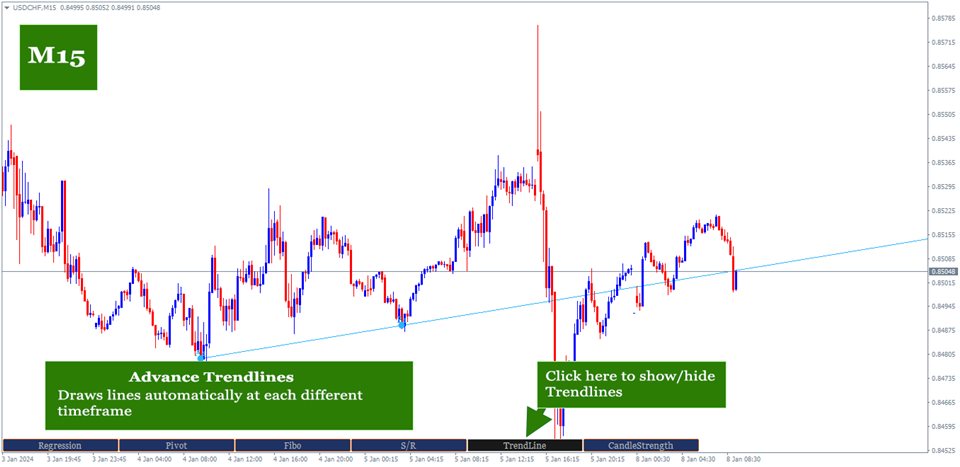
  12. Bars to search TrendLines.  This is the maximum number of bars that the indicator must count to display a trendline. Within the range of bar values specified here, the indicator will look for the most relevant points and the most frequent price reversals to draw trend lines.
  13. TrendLines Period.  This is similar to point 8 above. But this is to determine the trend line.  The indicator will look for reversal points at every number of bars specified here until up to the number of 'Bars to search TrendLines'  specified in point 12 above.
  14. Max. Lines Deviation It is the maximum distance between the last close price and upper/lower trendlines. The indicator will only display the lines inside the range. 
  15. Max. Trendlines/Side.  The indicator can display more than one line per 'up/down' side based on the values specified in points 12 and 13 above. With the condition that trend line is found based on the input above. Maximum value of this input is 30 for performance reason.
  16. Bars Multiplier. It is the multiplier of the value of ' Bars to search TrendLines' (point 12). This value will be used only if ' Max. Trendlines/Side' specified in point 15 is more than 1. The formula is Bars to search TrendLines x line index x Bars Multiplier. Example:  Bars to search TrendLines= 300, Max. Trendlines/Side= 4 and Bars Multiplier= 2 then the indicator will draw the trend lines with such conditions:
    1. The first 2 lines (upper & lower) are drawn from the calculation of the last 600 bars. 300 x 1 x 2
    2. The second 2 lines (upper & lower) are drawn from the calculation of the last 1200 bars.  300 x 2 x 2
    3. The third 2 lines (upper & lower) are drawn from the calculation of the last 1800 bars.  300 x 3 x 2
    4. The fourth 2 lines (upper & lower) are drawn from the calculation of the last 2400 bars.  300 x 4 x 2
    5. And so on, if 'Max. Trendlines/Side' is added more in value.
  17. Trendlines width.  The width of trend lines. The trend line thickness.
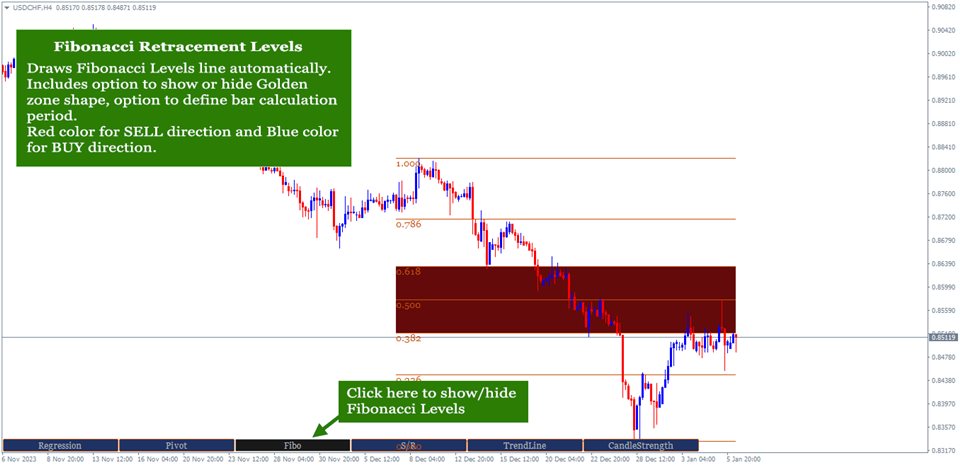
  18. Fibo Period.  Number of bars to calculate the Fibonacci Retracement Levels.
  19. Shape Fibo Golden Ratio.  Option to draw background color in the Golden Ratio area for Fibonacci Retracement Levels.
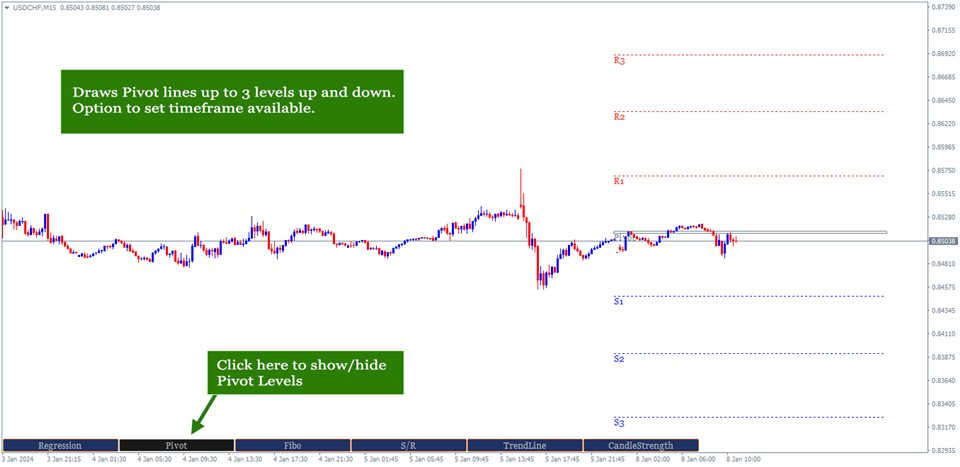
  20. Pivot Levels Timeframe.  Option Timeframe to draw Pivot Levels. The Levels are drawn from the data of the last candle close of the timeframe specified here. Recommended timeframe D1 to trade on timeframe M5 to H1 and W1 to trade on H1 or H4.
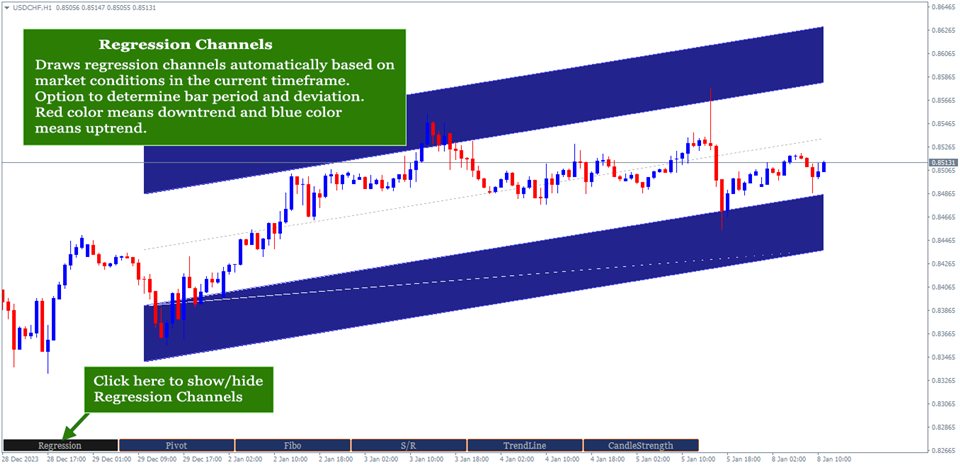
  21. Regression Period.  The period of bars to calculate the regression channel. 
  22. Regression Deviation.  The deviation of regression channel.
  23. Follow Trend. Option true/false to send alert message only if the arrow is following direction of the current Main trend.
  24. Follow Osci Trend.  Option true/false to send alert message only if the arrow is following direction of the current Osci trend.
  25. PopUp Alert. Option true/false to display alert message on the chart.
  26. Mobile Notification Alert.  Option true/false to send alert message to MT4 mobile application.
  27. Email Alert. Option true/false to alert message to the email. The email setup is required in the MT4 platform.


Entry Rules:

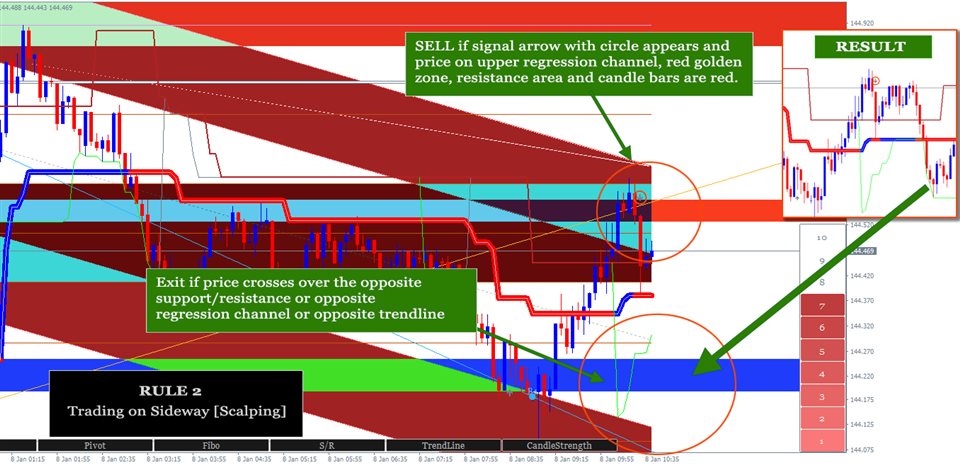
Consists of two rules: trading entry on a trending and trading entry on a sideway/ranging market, this is usually to take a small profit (scalping) when price is going up and down. Both have the same general rules, which are as follows:

  1. Follow the arrow with the circle. This arrow with the circle automatically follows the trend direction with the note if Show Main Trend: true and/or Show Osci Trend: true. 
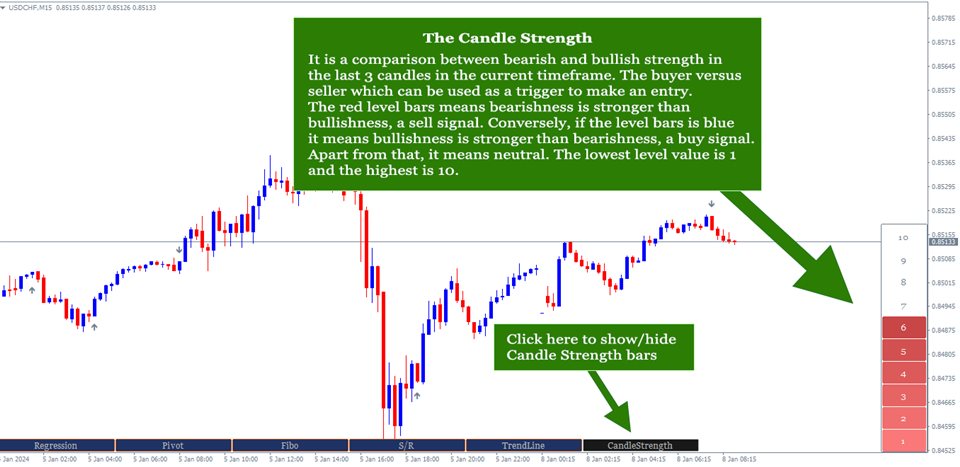
  2. Follow the direction of Candle Strength. Blue bars mean Buy and red bars mean Sell. Higher value of bars is better.
  3. At least one of these conditions matches. Price on the regression channel or price on the golden zone area.

The rules for trending market:

  1. The general 3 rules above are met.
  2. Several previous candles moved stronger with long candles in the direction of the trend followed by candles that started to weaken,
  3. Price is in the beginning of trend signed by lime/orange line is out of Osci trend. See the screenshot for more details.
  4. Price closely around the Main trend line and Osci trend line.
  5. The more these conditions match the better. Price on the regression channel, price on the golden zone area, price on the support/resistance area or price touches the upper/lower trend line.

The rules for sideways/ranging market:

  1. The general 3 rules above are met.
  2. The more these conditions match the better. Price on the regression channel, price on the golden zone area, price on the support/resistance area or price touches the upper/lower trend line.


Exit Rules:

How to exit depends on the type of entry mentioned above. Exit for trading on trending and exit for trading on sideways.

For trending trade, exit the market if one of the following conditions is met:

  1. The Slate Gray line is out of Osci Trend line and the opposite signal arrow is triggered.
  2. More than three opposite arrows have appeared after the entry time and the price touches the opposite support/resistance area or opposite regression channel.
  3. The opposite entry signal as mentioned on the Entry Rules above occurs.
For Sideway trade: immediately exit the market if the price touches the opposite support/resistance area or opposite regression channel or the opposite arrow appear.

Please note that the above entry/exit rules only apply if the indicator parameters are set by default or at least there are no significant changes. Otherwise, you can improvise based on your own knowledge, experience, strategy and trading style using the features available on the ChartGetTools indicator. It is all in one indicator and you can deactivate certain feature, if necessary, e.g. display a trend only or signal only, etc.

The trading example video:  https://youtu.be/FX3mP5kfRV8

If you have any question, please don't hesitate to contact me.


Рекомендуем также
BPS Panel Breakout Pro Scalper Solution Panel This indicator is part of the   RPTrade Pro Solutions  systems. BPS Panel   is a daily trend indicator using Price Action, Dynamic Support and Resistances. It's designed to be used by anyone, even the absolute beginner in trading can use it. NEVER repaints . Indications are given   from close to close . Designed to   be used alone , no other indicators are required. Gives you the trend and potential Take Profit at the beginning of the day. How
The Trendline Trade Panel was created to make it easier to train forex trading skills in backtester and at the same time make it easier to live trade using trendlines with the push of a button. This ea is perfect for beginners who want to learn to trade manually because all of its features are equipped with basic tools for trading forex. Other uses for Trendline Trade Panel: + Can be used to perform recovering loss positions made by other EA or positions that open manually. Fill in magic number
Индикатор строит графический анализ на основании теории Фибоначчи. Фибо-Веер служит для анализа импульсов и коррекций движения. Разворотные линии   (2 линии у основания веера фибоначчи)   служат для анализа направления движений. Индикатор отображает 4 целевых линии в каждом направлении.   Индикатор   учитывает волатильность на рынке. Если цена выше разворотных линий, имеет смысл рассматривать покупки, если ниже, то  продажи.   Открывать позиции можно после пробоя, отбоя или тестировани
SRP (Strong Retracement/Reversal Points) - это точный и уникальный индикатор уровней поддержки и сопротивления. Он отображает ближайшие значимые уровни, на которых ожидается коррекция/разворот цены. Если все уровни пробиваются с одной стороны, индикатор их пересчитывает и рисует новые уровни поддержки и сопротивления. Эти уровни могут оставаться действительными в течение нескольких дней, в зависимости от рынка. Основные возможности Его можно использовать на всех таймфреймах младше дневного. От
Суть данного индикатора - анализ и предсказание котировок с помощью преобразования Фурье. Индикатор раскладывает ряд цен на гармоники и вычисляет их продукт на следующих барах. Индикатор выводит на истории ценовые метки, обозначающие размах цен в прошлом, а также ценовые метки с предполагаемым движением в будущем. Также прогнозируемое решение о покупке или продаже и размер take profit указывается в текстовой метке в окне индикатора. Индикатор использует в качестве "движка" для расчетов другой ин
I make this indicator to help you for setting effective stoploss and getting more signals from following trends. This indicator helps to tell the trends and sideway, when 2 lines stand above of blue cloud, it means uptrend. When 2 lines stand above red cloud, it means down trend, the other else, it means sideway market. For taking order, you have to wait the arrows. You also need to see the cloud position, if the cloud's res, you have to wait the yellow arrow for selling order. If the cloud's bl
Owl smart levels
Sergey Ermolov
4.34 (35)
Версия MT5  | Как установить?  | FAQ Индикатор Owl Smart Levels   – это полноценная торговая система внутри одного индикатора, которая включает в себя такие популярные инструменты анализа рынка как усовершенствованные   фракталы Билла Вильямса , Valable ZigZag, который строит   правильную волновую структуру   рынка, а также  уровни Фибоначчи,   которые   отмечают точные уровни входа в рынок и места взятия прибыли. Подробное описание стратегии Инструкция по работе с индикатором Советник-помошник
Alpha Trend sign - это мой давний и очень популярный торговый инструмент, который проверяет нашу торговую систему и четко сигнализирует о транзакциях, которые не дрейфуют.   Основные функции:   • В зависимости от того, показывает ли рынок активную область, показатели могут быть очень интуитивными, чтобы определить, является ли текущая конъюнктура трендовой или шоковой.   И в соответствии с индикатором стрелка врезается на рынок, зеленая стрела подсказывает купить, красная стрела подсказыв
The Th3Eng PipFinite indicator is based on a very excellent analysis of the right trend direction with perfect custom algorithms. It show the true direction and the best point to start trading. With StopLoss point and Three Take Profit points. Also it show the right pivot of the price and small points to order to replace the dynamic support and resistance channel, Which surrounds the price. And Finally it draws a very helpful Box on the left side on the chart includes (take profits and Stop loss
The trend is your friend! This is what this indicator is all about. Follow this famous saying and be safe. Characteristics: Buy/Sell signals fixed on the close of a bar. Works on all symbols and all timeframes. Clear visual market trend laser line, Buy/Sell signal arrows, market strength meter, TP1 & TP2 boxes. Visual signals when to enter, when to exit the market. No repainting. Compatible with Flexible EA for trading automation. (Ask for a free set file optimized to perform 2010-2018) Para
Индикатор Wing Patterns ищет на графике множество различных видов моделей, используя структуру XABCD. Термин Wing Pattern используется для обозначения всех типов моделей, основанных на общей структуре XABCD, которая строится в альтернативной форме по крайним точкам High/Low. Другими словами, предположим, что точка X отложена на точке минимума графика. Точка A строится на следующей максимальной точке в пределах определенного количества баров. Это определенное количество баров называется уровнем г
If you are good at trading at levels This indicator is all you need levels to manage your trades Market is usually follow current trend when break out some levels or reverse Trade at the Institutional traders level with the best supply and demand zone indicator available in MT4 and MT5 The Secret Profit Levels Signals indicator for MT4 is a complete trading system that provides traders with the entry price and 2 take profit levels. Technical analysts use support and resistance levels to iden
Индикатор показывает потенциальный направление тренда по циклично-волновой зависимости. Таким образом, все лучи пересечения будут оптимальными лучами, в направлении которых ожидается движение цены с учетом периода индикатора. Лучи можно использовать как направление потенциального движения рынка. Но не надо забывать, что подход должен быть комплексным, сигналы индикатора требуют дополнительной информации для входа в рынок.
Это трендовый индикатор без перерисовки Разработан вместо стратегии бля бинарках опционов (по цвету свечи мартингейл) Так же хорошо работает в торговле на рынке форекс Когда открывать сделки ( бинарные опционы ) Сигнал появится в месте с свечой сигналит на текущую свечу  Открывать сделку стоит на одну свечу текущего таймфрейма рекомендуется м1 и М5 При появлении синей точки открываем сделку вверх При появлении красной точки открываем сделку в низ. Как открывать сделки на Форекс. При полу
"Тренд - друг трейдера" . Это одна из самых известных пословиц в трейдинге, потому что правильное определение тренда может помочь заработать. Однако проще сказать о торговле по тренду, чем сделать, потому что многие индикаторы основаны на развороте цены, а не на анализе тренда. Они не очень эффективны при определении периодов тренда или в определении того, сохранится ли этот тренд. Мы разработали индикатор Trendiness Index , чтобы попытаться решить эту проблему. Индикатор определяет силу и напра
UniversalIndicator - универсальный индикатор. Отличный помощник для начинающих и профессиональных трейдеров. В алгоритме индикатора используются вероятностные и статистические методы анализа цены торгового инструмента. Индикатор устанавливается обычным образом. Преимущества индикатора работает на любом временном периоде работает с любым торговым инструментом имеет высокую вероятность положительного прогноза не перерисовывается Параметры индикатора LengthForecast  =30 - количество прогнозируемых
Индикатор Trend Map создан для обнаружения тенденций движения цены и позволяет быстро определить не только направление тренда, но и понять уровни взаимодействия покупателей и продавцов. Он не имеет настроек и поэтому может быть воспринят так, как он сигнализирует. Он содержит всего три линии, каждая из которых предназначена для однозначного восприятия текущего момента. Линия 2 характеризует глобальную направленность движения цены. Если мы видим, что две другие линии выше этой линии, то можно го
Fibonacci indicator based on fractal.This software can automatically draw the golden section proportional line of two trend lines, and mark all the recent high and low prices.And the percentage value of volatility is a multi-cycle, multi-currency oscillation indicator.It is very effective for traders to find support and resistance lines and find entry and exit points near them.
For sure, this indicator has become very popular amongst traders. Through coding this indicator will give you the most accurate levels possible for your trading analysis. We have also added in the ability for you to receive alerts when the price breaks above or below a Support or Resistance lines! HOW TO USE The red rectangles represent your resistance/supply zone. The green rectangles represent your support/demand zone.  BONUS FEATURES We coded this indicator with the ability to switch between
Индикатор LineMagnit для MT4 - высокоточный индикатор, который строит уровни поддержки и сопротивления, притягивающие к себе цену по принципу магнита. Это позволяет трейдеру легко определить наиболее вероятные точки входа и выхода из рынка, а также определить направление сил в рынке так как уровни строятся на основе вливаний капитала в инструмент. Индикатор LineMagnit   оснащен интуитивно понятным графическим интерфейсом, который позволяет быстро находить и анализировать уровни поддержки и сопро
Алгоритм форекс-индикатора Arriator позволяет быстро определить текущую тенденцию на рынке. Индикатор Elephant сопровождает длительные тренды и может применяться без ограничений по инструментам или таймфреймам. Этот индикатор не только помогает прогнозировать будущие значения, но и генерирует сигналы на покупку и продажу. Он отслеживает рыночные тренды, игнорируя резкие колебания и рыночный шум вокруг средней цены. Индикатор реализует разновидность технического анализа, основанную на идее циклич
Next level of trend trading here. Possibility 75%, the indicator analyzes the current market to determine short (small dot), middle (circle with a dot inside) and long (cross with a circle and a dot inside) trends.  Wingdings characters of  Aqua color represents the beginning of the UP trend. Wingdings characters of  Orange color represents the beginning of the DOWN trend. Possibility 75% Indicator will improve your trading in the world of forex, commodities, cryptocurrencies and indices.
П рофессиональная версия индикатора ZigZag для визуализации структуры ценовых движений по фракталам. Лишен пропусков и недостатков стандартной версии MT4. Для определения фракталов использует Price action и уникальный алгоритм фильтрации. Подходит для любых видов торговли. Идеально подходит для торговли по паттерну WM стратегия "Снайпер"!!! Особенности Отмечает места разворота цены при образовании нового фрактала с заданными параметрами. Подходит для всех видов торговли, на любых рынках. Лишен
Spartan Mr Beast
Luis Mariano Vazquez Marcos
El Asesor de Experto "Spartan Mr Beast" es una herramienta avanzada y robusta diseñada para traders que buscan capitalizar las oportunidades del mercado aprovechando los rechazos de precios. Este asesor se especializa en identificar y explotar los momentos en los que el mercado muestra una resistencia o soporte significativo, sugiriendo posibles reversiones o cambios de tendencia. Características Principales: Detección de Rechazos de Mercado : "Spartan Mr Beast" utiliza algoritmos de última gene
PABT Pattern Indicator - это классическая реализация одного из сигнальных паттернов.  Логика индикатора заключается в том, что он определяет ситуации в которых максимум и минимум сигнального бара находится в пределах максимума и минимума предыдущего бара, тем самым показывает разворот тренда. Для сигнала на покупку сигнальный бар закрывается выше цены открытия, для сигнала на продажу сигнальный бар закрывается ниже цены открытия, предыдущий бар соответственно противоположного сигнальному типа. В
Forex Indicator "Support Resistance Levels" for MT4 Indicator " Support Resistance Levels" is very useful auxiliary indicator for trading 'Support' and 'Resistance' are important zones on chart respected by price Support level is where the price regularly stops falling and bounces back up Resistance level is where the price normally stops rising and dips back down I ndicator " Support Resistance Levels" shows the recent levels: Resistance  levels - red lines.  S upport  levels - blue lines
Индикатор представляет собой видоизмененный индикатор Fibonacci-SS https://www.mql5.com/ru/market/product/10136 . Отличается поведение при размещения отложенных ордеров и линии TP. Автоматическое размещение линий Фибрначчи от максимума до минимума видимых баров: Автоматические отложенные ордера (Buy/Sell) Taking Profit 1, Taking Profit 2 как точки разворота и Taking Profit 3 для улучшения возможной прибыли. Лучшее соотношение риска и прибыли. Простой и мощный индикатор Этот индикатор, наряду с
Данный индикатор является бесспорным лидером среди индикаторов. И для этого утверждения есть веская причина. Индикатор строит очень качественный канал в котором формирует сигналы на вход! Что является идеальной стратегией для трейдера, поскольку трейдер всегда колеблется при выборе стратегии для работы. То есть данный индикатор позволит вам решить дилемму выбора работы по тренду или в канал, поскольку совмещает эти две основные концепции. Работа с индикатором очень проста - вы просто реагируете
Fibonacci retracements can be used to draw support lines, identify resistance levels, place stop-loss orders and set target prices. The Advanced Automatic Fibonacci retracements draws automatically all the levels. You have a lot of options to choose. For exemple you can use the tracements of another time frame (MTF) in the current chart, you can also choose between the closest level or less close to draw the retracements. You can also add 2 levels of your choice. You can add levels extensions o
Support and Resistance is a very important reference for trading.  This indicator provides customized support and resistance levels, automatic draw line and play music functions.  In addition to the custom RS, the default RS includes Pivot Point, Fibonacci, integer Price, MA, Bollinger Bands. Pivot Point is a resistance and support system. It has been widely used at froex,stocks, futures, treasury bonds and indexes. It is an effective support resistance analysis system. Fibonacci also known as t
С этим продуктом покупают
FX Volume
Daniel Stein
4.58 (33)
Получайте ежедневную информацию о рынке с подробностями и скриншотами в нашем утреннем брифинге здесь, на mql5 , и в Telegram ! FX Volume - это ПЕРВЫЙ и ЕДИНСТВЕННЫЙ индикатор объема, который дает РЕАЛЬНОЕ представление о настроении рынка с точки зрения брокера. Он дает потрясающее представление о том, как институциональные участники рынка, такие как брокеры, позиционируют себя на рынке Forex, гораздо быстрее, чем отчеты COT. Видеть эту информацию прямо на своем графике - это настоящий геймчей
Trend Screener
STE S.S.COMPANY
4.81 (88)
Индикатор тренда, революционное уникальное решение для торговли и фильтрации тренда со всеми важными функциями тренда, встроенными в один инструмент! Это 100% неперерисовывающийся мультитаймфреймный и мультивалютный индикатор, который можно использовать на всех инструментах/инструментах: форекс, товары, криптовалюты, индексы, акции. ПРЕДЛОЖЕНИЕ ОГРАНИЧЕННОГО ВРЕМЕНИ: Индикатор скринера поддержки и сопротивления доступен всего за 50$ и бессрочно. (Изначальная цена 250$) (предложение продлено) Tre
Инновационный индикатор, использующий эксклюзивный алгоритм для быстрого и точного определения тренда. Индикатор автоматически рассчитывает время открытия и закрытия позиций, а также подробную статистику работы индикатора на заданном отрезке истории, что позволяет выбрать наилучший торговый инструмент для торговли. Вы также можете подключить свои пользовательские стрелочные индикаторы к Scalper Inside Pro для проверки и расчета их статистики и прибыльности. Scalper Inside PRO (версии 6.5 и выше)
The Stochastic Basket Currency Strenght  brings the Stochastic indicator to a new level.  Expanding the boundaries of TimeFrames and mono-currency analysis, the SBCS take the movements of each currency that composes the cross and confront them in the whole basket of 7 crosses.  The indicator works with any combination of AUD, CAD, CHF, EUR, GBP, JPY, NZD, USD pairs and with full automation takes in account every stochastic value (main line) for the selected Time Frame.  After that, the indicator
TPSproTREND PrO
Roman Podpora
4.79 (19)
TPSpro TREND PRO   —  трендовый индикатор, который автоматически анализирует рынок и предоставляет информацию о тренде и каждой его смене а также дающий сигналы для входа в сделки без перерисовки! Индикатор использует каждую свечу, анализируя их отдельно. относя к разным импульсам – импульс вверх или вниз. Точные точки входа в сделки  для  валют, крипты, металлов, акций, индексов! Version MT5           ПОЛНОЕ ОПИСАНИЕ ИНДИКАТОРА           Рекомендуем использовать с  индикатором -  RFI LEVELS
Reversal-Arrow: Определите точки разворота с точностью и надежностью Reversal-Arrow — это продвинутый индикатор, созданный для помощи трейдерам всех уровней в определении потенциальных точек разворота тренда. Индикатор предоставляет четкие и визуальные сигналы, чтобы помочь вам лучше понимать рыночный контекст, снижая неопределенность и облегчая процесс принятия решений. Reversal-Arrow оптимизирован специально для пар XAUUSD и XAUEUR на таймфреймах 1 минута, 5 минут и 15 минут, где он показывает
Важным ключевым элементом в трейдинге являются зоны или уровни, от которых принимаются решения о покупке или продаже торгового инструмента. Несмотря на попытки крупных игроков скрыть свое присутствие на рынке, они неизбежно оставляют следы. Наша задача заключалась в том, чтобы научиться находить эти следы и правильно их интерпретировать. INSTRUCTIONS     RUS   -    ENG                    Рекомендуем использовать с индикатором -   TPSpro  TREND PRO -  Version MT5 Основные функции: Отображения ак
Dynamic Forex28 Navigator — инструмент для торговли на рынке Форекс нового поколения. В НАСТОЯЩЕЕ ВРЕМЯ СКИДКА 49%. Dynamic Forex28 Navigator — это эволюция наших популярных индикаторов, объединяющая мощь трех в одном: Advanced Currency Strength28 Indicator (695 отзывов) + Advanced Currency IMPULSE with ALERT (520 отзывов) + CS28 Combo Signals (бонус). Подробности об индикаторе https://www.mql5.com/en/blogs/post/758844 Что предлагает индикатор Strength нового поколения?  Все, что вам нрав
В НАСТОЯЩЕЕ ВРЕМЯ СКИДКА 20%! Лучшее решение для новичка или трейдера-эксперта! Этот индикатор специализирован для отображения силы валюты для любых символов, таких как экзотические пары, товары, индексы или фьючерсы. Впервые в своем роде, любой символ может быть добавлен в 9-ю строку, чтобы показать истинную силу валюты золота, серебра, нефти, DAX, US30, MXN, TRY, CNH и т.д. Это уникальный, высококачественный и доступный торговый инструмент, потому что мы включили в него ряд собственных функци
Gold Channel is a volatility-based indicator, developed with a specific timing algorithm for the XAUUSD pair, which consists of finding possible corrections in the market. This indicator shows two outer lines, an inner line (retracement line) and an arrow sign, where the theory of the channel is to help identify overbought and oversold conditions in the market. The market price will generally fall between the boundaries of the channel. If prices touch or move outside the channel it is a tra
В настоящее время скидка 20%! Лучшее решение для новичка или трейдера-эксперта! Эта приборная панель работает на 28 валютных парах. Он основан на 2 наших основных индикаторах (Advanced Currency Strength 28 и Advanced Currency Impulse). Он дает отличный обзор всего рынка Forex. Он показывает значения Advanced Currency Strength, скорость движения валюты и сигналы для 28 пар Forex на всех (9) таймфреймах. Представьте, как улучшится ваша торговля, когда вы сможете наблюдать за всем рынком с пом
Ultimate Gold Advisor для MetaTrader 4 Ultimate Gold Advisor — это продвинутый технологический инструмент, созданный для оптимизации торгового процесса на MetaTrader 4. Разработанный для удовлетворения потребностей опытных трейдеров, этот индикатор сочетает точность, сложный анализ и многофункциональность, предоставляя поддержку для принятия обоснованных торговых решений. Идеально подходит для торговли золотом, но также применим к широкому спектру активов. Ultimate Gold Advisor может помочь вам
Данный индикатор основан на математике великого трейдера W.D.Ganna.  С помощью его мы с легкостью найдете сильные уровни анализируя свинг для поиска оптимальной точки входа. Индикатор работает на всех инструментах и всех тайм фреймах. Индикатор полностью ручной и оснащен кнопками управления. Все что вам нужно это нажать на кнопку NEW, появится отрезок, данный отрезок вы размещаете на любое движение, свинг или даже 1 свечу, которую хотите проанализировать. Разместив отрезок нажимаете кнопку ОК. П
В настоящее время скидка 20%! Эта приборная панель - очень мощное программное обеспечение, работающее на нескольких символах и до 9 таймфреймов. Он основан на нашем основном индикаторе (Лучшие отзывы: Advanced Supply Demand ).   Приборная панель дает отличный обзор. Она показывает:  Отфильтрованные значения спроса и предложения, включая рейтинг силы зон, расстояния между пунктами в зонах и внутри зон, Выделяются вложенные зоны, Выдает 4 вида предупреждений для выбранных символов на всех (9)
Enigmera
Ivan Stefanov
5 (3)
ЭНИГМЕРА: ядро рынка https://www.enigmera.com Введение Этот индикатор и торговая система представляют собой удивительный подход к финансовым рынкам. ENIGMERA использует фрактальные циклы для точного расчета уровней поддержки и сопротивления. Он показывает подлинную фазу накопления и дает направление и цели.  Система, которая работает независимо от того, находимся ли мы в тренде или в коррекции.  Как она работает? ENIGMERA состоит из трех линий: линии поддержки/сопротивления, линии цели и ли
ПОЖАЛУЙСТА, ПРОЧТИТЕ ИНФОРМАЦИЮ НИЖЕ ПЕРЕД ПОКУПКОЙ! Apollo Pips PLUS SP – уникальный продукт! ЭТО ДЛЯ ТЕХ, КТО ХОЧЕТ ПОЛУЧИТЬ МОЙ НОВЫЙ ИНДИКАТОР «APOLLO PIPS» + БОНУС «SUPER PACK» С ДОСТУПОМ КО ВСЕМ МОИМ ТОРГОВЫМ ИНДИКАТОРАМ! Покупая продукт Apollo Pips PLUS SP, вы фактически приобретаете абсолютно новую версию моего индикатора Apollo Pips. Эта версия индикатора имеет улучшенный алгоритм и простой в использовании параметр, который дает вам возможность использовать индикатор на любом рынке и в
Step into the realm of Forex trading with confidence and precision using XQ, a cutting-edge Forex indicator designed to elevate your trading game to unprecedented heights. Whether you're a seasoned trader or just stepping into the world of currency exchange,   XQ Forex Indicator   empowers you with the insights and signals needed to make informed trading decisions. The signal conditions are a combination of three indicators, and XQ Forex Indicator only display  medium and long-term trends . The
TrendMaestro
Stefano Frisetti
5 (3)
note: this indicator is for METATRADER4, if you want the version for METATRADER5 this is the link:  https://www.mql5.com/it/market/product/108106 TRENDMAESTRO ver 2.4 TRENDMAESTRO recognizes a new TREND in the bud, he never makes mistakes. The certainty of identifying a new TREND is priceless. DESCRIPTION TRENDMAESTRO identifies a new TREND in the bud, this indicator examines the volatility, volumes and momentum to identify the moment in which there is an explosion of one or more of these data a
ACB Breakout Arrows
KEENBASE SOFTWARE SOLUTIONS
4.15 (34)
The ACB Breakout Arrows indicator provides a crucial entry signal in the market by detecting a special breakout pattern. The indicator constantly scans the chart for a settling momentum in one direction and provide the accurate entry signal right before the major move.  Get multi-symbol and multi-timeframe scanner from here - Scanner for ACB Breakout Arrows MT4 Key features Stoploss and Take Profit levels are provided by the indicator. Comes with a MTF Scanner dashboard which tracks the brea
Currently Price 20% OFF ( for unlimited use )   BONUS  AUX VIP Club 2024 : Include  EA Airbag  and  Load Data History  to enhance the performance of this tool to its maximum potential  Click Here to Download Files   ( for users only )   Hello World! Introducing.. SMCpro VIP tool and Indicator for MetaTrader 4, designed to revolutionize your trading experience with the ICT Smart Money Concept. This system is meticulously crafted to empower traders with advanced insights and precision in
(В настоящее время скидка 30%) Прежде чем читать описание этого индикатора, я просто хочу познакомить вас со следующей концепцией. ДВИЖУЩАЯСЯ СРЕДНЯЯ ЛИНИЯ - Типичная скользящая средняя, ​​основанная только на одном графике. ЛИНИЯ НАПРАВЛЕНИЯ ВАЛЮТЫ- Скользящее среднее определенной пары, в которой сила основана на 28 парах. Можно сказать как НАСТОЯЩАЯ ДВИЖУЩАЯСЯ СРЕДНЯЯ ЛИНИЯ. Скользящая средняя действительно является одним из самых популярных индикаторов, который использует поч
Представляем ON Trade Waves Patterns Harmonic Elliot Wolfe, передовой индикатор, разработанный для обнаружения разнообразных рыночных паттернов с использованием как ручных, так и автоматизированных методов. Вот как это работает: Гармонические паттерны: Этот индикатор может определять гармонические паттерны, появляющиеся на вашем графике. Эти паттерны важны для трейдеров, практикующих теорию гармонической торговли, как это описано в книге Скотта Карни "Гармоническая Торговля том 1 и 2". Независи
Bomb Bank Signal
Igor Pereira Calil
5 (1)
Сигнал банка-бомбы: индикатор вашей уверенности в MetaTrader 4 Bomb Bank Signal — мощный индикатор для MetaTrader 4, предназначенный для выявления наиболее актуальных тенденций финансового рынка. Если вы ищете инструмент, который точно предугадывает движения, Bomb Bank — ваш союзник. Как это работает: Этот индикатор сочетает в себе три различных метода — анализ объема, закрытие свечей и симметричный тренд — для обнаружения и сигнализации о возможностях покупки и продажи. Банк-бомба похож
This indicator is designed for those familiar with smart money concepts, specifically accumulation and distribution. It tracks subtle moves by institutional traders, not always aligned with traditional strategies. Ensure it fits your trading style by testing thoroughly before purchasing. Sneaky Buster is designed to help retail traders identify smart money moves. Traditional indicators often miss these subtle maneuvers, which inspired the creation of this tool. It effectively detects price cons
TPA True Price Action indicator reveals the true price action of the market makers through 100% non-repainting signals (except early signals mode) strictly at the close of a candle! TPA shows entries and re-entries, every time the bulls are definitely stronger than the bears and vice versa. Not to confuse with red/green candles. The shift of power gets confirmed at the earliest stage and is ONE exit strategy of several. There are available now two free parts of the TPA User Guide for our custo
Cycle Sniper
Elmira Memish
4.39 (36)
NEW YEAR SALE PRICE FOR LIMITED TIME!!! Please contact us after your purchase and we will send you the complimentary indicators to complete the system Cycle Sniper is not a holy grail but when you use it in a system which is explained in the videos, you will feel the difference. If you are not willing to focus on the charts designed with Cycle Sniper and other free tools we provide, we recommend not buying this indicator. We recommend watching the videos about the indiactor and system before pu
PZ Day Trading
PZ TRADING SLU
3.67 (3)
Этот индикатор обнаруживает разворот цены зигзагообразно, используя только анализ ценового действия и канал Дончиана. Он был специально разработан для краткосрочной торговли, без перекраски или перекраски вообще. Это фантастический инструмент для проницательных трейдеров, стремящихся увеличить сроки своих операций. [ Руководство по установке | Руководство по обновлению | Устранение неполадок | FAQ | Все продукты ] Удивительно легко торговать Это обеспечивает ценность на каждом таймфрейме Ре
ECM Elite Channel is a volatility-based indicator, developed with a specific time algorithm, which consists of finding possible corrections in the market. This indicator shows two outer lines, an inner line (retracement line) and an arrow sign, where the channel theory is to help identify overbought and oversold conditions in the market. The market price will generally fall between the boundaries of the channel. If prices touch or move outside the channel, it's a trading opportunity. The
Представляем       Quantum Breakout PRO   , новаторский индикатор MQL5, который меняет ваш способ торговли в зонах прорыва! Разработанная командой опытных трейдеров с опытом торговли более 13 лет,   Quantum Breakout PRO   предназначена для того, чтобы вывести ваше торговое путешествие на новые высоты благодаря своей инновационной и динамичной стратегии зон прорыва. Quantum Breakout Indicator покажет вам сигнальные стрелки на зонах прорыва с 5 целевыми зонами прибыли и предложением стоп-лос
Reversal Sniper is designed to find the extreme reversals of the price. Indicator collects data of Cycle Sniper Indicator. NOTE: REVERSAL SNIPER Indicator is made for Cycle Sniper Users as an additional tool.  However, it can be used by the traders who look for finding out strong reversal levels. Indicator works on all timeframes and all instruments. Reversal  Sniper  Checks: Harmonic Patterns RSI Zig Zag and Harmonic Swings Cycle Sniper Indicator's Buy / Sell Signals The complex algo i
Другие продукты этого автора
It identifies the pivot, support, and resistance price levels of the selected timeframe and then draws lines onto the chart. FEATURES: Option to specify the Timeframe Period in the PivotSR calculation. Option to display the PivotSR of the last candle, of every candle, or of the current candle. Options for displaying labels, line thickness, and line color. PivotSR can be interpreted as reversal levels or past price reactions that can be used as the basis for current price analysis. Some traders b
FREE
It works based on the Stochastic Indicator algorithm. Very useful for trading with high-low or OverSold/Overbought swing strategies. StochSignal will show a buy arrow if the two lines have crossed in the OverSold area and sell arrows if the two lines have crossed in the Overbought area. You can put the Stochastic Indicator on the chart with the same parameters as this StochSignal Indicator to understand more clearly how it works. This indicator is equipped with the following parameters: Inputs d
FREE
It is an expert advisor that scans the last patterns on defined symbols and timeframes . Multi Symbols /pairs , Multi timeframes .  There are 2 ways to specify symbols : Automatically scan all symbols available on the market watch (true/false) Type any symbols ,separated by comma.   There are also 2 ways to specify timeframes : Automatically scan all timeframes available on mt4 (true/false) Type any timeframes,separated by comma.   Unlimited symbols available in an account and unlimited timefr
It is a custom non-repaint indicator to identify trade opportunities in swing action as prices move within an upper and lower band. Inspired by the Keltner Channel, the most popular channel Indicator introduced by Chester Keltner. It is different with a Bollinger Bands. It represents volatility using the high and low prices, while Bollinger's studies rely on the standard deviation. The algorithm for this indicator is also available in the EntryMaximator EA. Including the option to use it or not.
FREE
Provides instant signals on the chart in panel form. Equipped with signal description and trading analysis tools such as drawing auto trendlines, support/resistance area, regression channel, Fibonacci levels, Pivot levels and current signal price, signal time, signal expiry and stoploss recommendation. Also sending alert messages to all available mt4 alert tool. A detailed description panel provides information about where the signal comes from and what indicators are behind the signal. Includin
Профессиональный торговый индикатор с возможностью двойного входа. Ценные Гладкие Линии Канала в отдельном окне, Линии Тренда как в главном окне, так и отдельное окно и стрелки входа. Подходит для скальпинга на младших таймфреймах. Также он может работать и давать сигналы на старших таймфреймах для более длительных торговых периодов. НАСТРОЙКИ ИНДИКАТОРА: 1. Сигнальный режим. Есть 2 варианта: Стандартный и Компактный. Если выбрано значение по умолчанию, в главном окне будут отображаться 3 р
Provides Regression Channel on the current chart. Combined by Trend of Moving Averages and Multi timeframes Oscillator Indicators: CCI, RSI, Stochastic, and MACD with specific working logic . It could make us easier to identify swing high-low as an entry point, the retracement area while following the current trend. Consists of 2 types of signal, main and secondary. The main signal will draw very clearly triangle and lines on the chart with the word " BUY" or 'SELL'. and the secondary is the sta
MACD Scanner provides the multi symbols and multi-timeframes of MACD signals. It is useful for trader to find the trading idea quickly and easily. User-friendly, visually clean, colorful, and readable. Dynamic dashboard display that can be adjusted thru the external input settings. Total Timeframes and Total symbols as well as the desired total rows/panel, so it can maximize the efficiency of using the chart space. The Highlight Stars on the certain matrix boxes line based on the selected Scan M
GOLDEN RETRACEMENT POWER indicator draws fibonacci levels automatically. Defines the golden entry buy/sell area, support and resistant lines , signals arrows and strength 'Power Bars Level' based on price action . Some indicators also work behind the chart: Stochastic,RSI,MFI,DeMarker and WPR . Fibonacci retracements are a popular form of technical analysis used by traders in order to predict future potential prices in the financial markets. If used correctly, Fibonacci retracements and ratios c
Non-repaint indicator    to identify trade opportunities in swing action as prices move within an upper and lower band. Inspired by the Keltner Channel, the most popular channel Indicator introduced by Chester Keltner. It is different with a Bollinger Bands. It represents volatility using the high and low prices, while Bollinger's studies rely on the standard deviation. Customized by adding the trends exactly in the middle line, arrows when price cross over the outer lines and Fibonacci Levels L
Индикатор основан на множестве EMA. Идея состоит в легком отображении нескольких экспоненциальных скользящих средних на одном гнрафике, без необходимости добавлять их по отдельности. В индикатор также встроена линия тренда: она синяя при растущем тренде и красная при падающем тренде. Цвета линий можно поменять в настройках индикатора. В индикаторе 2 внешних параметра. Это параметры периода и сдвига. При их изменении (период и/или сдвиг), остальные параметры подстраиваются автоматически. Подходит
This is the countdown of the last candle Indicator. How much time remains in the current candle of your chart CTime display exactly how many hours, minutes and seconds remain before the current candle closes, and a new one opens. This allows you to be on the ball as soon as the next candle appears It could be useful for a trader who trades with candles as the main attention Available option to change the text color to suit the chart background. This Indicator is related to the system here .
FREE
Индикатор Range Multi Alligators отображает информацию о максимуме и минимуме канала диапазона, а также о тренде, который рисуется в центре канала в виде гистограммы красного и синего цвета. Линии канала диапазона позволяют определять уровни стоп-лосс и тейк-профит. Это трендовый индикатор на основе использования нескольких "Аллигаторов". Запустите индикатор на графике и настройте один или все параметры, при этом все линии будут перемещаться синхронно. Описание настраиваемых параметров Period
Индикатор стохастических свечей Он преобразует стохастический индикатор из отдельного окна в окно графика, рисуя раскрашенные перекупленные свечи. Красный перекуплен, а синий перепродан по умолчанию. Позже вы можете изменить цвет в настройке внешнего индикатора. Это индикатор мульти таймфрейма, который означает, что он может показывать результат появления с другого таймфрейма. Например: если вы установите таймфрейм H1, он будет отображаться свечи с таймфрейма H1 на любой таймфрейм Это будет
Autobot Retracement Code (ARC) A robot trading that works based on retracement strategy while following the market trend.It has  made average profits up to 25% /month that is relatively a High Return of Investment.Real Account proof. Fully automation. Auto Lot sizing, Auto TakeProfit Calculation, Auto StopLoss Calculation. Currently Running on Real account , it has more than 100% growth / 5 months. NEW UPDATE RELEASED, VERSION 3.0  FEATURES on Version 3: FIFO rules Auto LotSize Auto StopLoss
Order Management EA (OME). The software will manage your trades based on 2 options: Magic Number or Order Comment. Both the Trades from the other EA or from Manual Trading. Drawing Stop Loss/Take Profit, Close All the positions, manages Multiple Orders, determining grid range and entry signals automatically.  Sending Martingale Orders, if necessary, that can be turn off/on. Including 2 options lot calculation: Multiplication or Addition.  You install OME in your account, you place order, and it
Strategy – Bollinger Band, Moving Average and Price Actions. Bollinger Bands to identify High-Low Price, Moving Average to identify Trend and Price Action is to synchronize both of them.  SardaFx 4.1 has average holding time 24 hours (1 day) on timeframe H1. It is not a Martingale EA or Averaging EA. The work is simple, BUY and Exit or SELL and Exit. No recurring BUY and or SELL in the same time and the same symbol except you adjust Max BUY/SELL  more than 1,default setting is 1 BUY and 1 SELL.
Some informations on the chart with the single attachment. RangeBorder Buy Sell (RBBS) Non Repaint Indicator will provide trend line, buy sell arrows,reversal arrows, range channel, order exit area,high average price line and low average price line.All arrows and lines don't repaint and not lagging. Once candle closed it won't  repaint. Reading Indicator: 1. Small Stars , Indicates oversold and overbought with certain logic and price may reverse when this small star triggers. Useful to identif
Oversold and Overbought Candles, Trendlines, and BUY-SELL arrows in the single Indicator. Built from 8 default MT4 Indicators. Stochastic,RSI,SAR,CCI,RVI,DeMarker,WPR and MA. It is " NON REPAINT " indicator. All buffers do not repaint.  Double Trendline buffers that can also be used to identify sideway market and support resistance area.  Any timeframes and any currency pairs. Parameters: Show Trend . TRUE/FALSE to show trendlines on the chart Follow Trend. If TRUE , Dapitrend will show on
TrendWavePattern  an another way to trade with a harmonic pattern, a maestro classic pattern . I made some improvements and combinations with my own strategy. Trend direction, buy-sell signal ,hi-low area and pivot line. These will be helpful for trader to read the current market condition. So it is not blindly following the pattern itself but also following other informations from the market. Readable chart appearance . Designed to be user friendly even you are a new trader. BUY-SELL zone, Ta
This is MT4 version of StochScanner It scans Stochastic from Multi Symbols and Multi Timeframes and displayed on the dashboard on a single chart. . 4 scanning modes: 1. Mode OverBought/OverSold Indicator scans Overbought and OverSold . OverBought : current stochastic is above level 80 and OverSold : current stochastic is below level 20 2. Mode Signal It means if the previous stochastic is on OverBought or OverSold ( either Main Line and Signal Line ) and the current Main Line cross over the curr
Lemurian Trader is a multi symbols  EA/robot. User can input symbols in the external parameter separated by comma. Only need to place on the single chart, no need to open multiple chart,no limited symbols as long the symbol is available on the market watch. Sweeping signals from timeframe M15 to H4 on each symbol to find the best high/low price while it also keeps to follow the trend. Lower TF M15 as a signal and higher(M30,H1,H4) to indentify trend and high low. It means whatever timeframe we p
RSI Scanner Plus Indicator scans RSI values in multiple symbols and timeframes. Plus trend line buffer on the chart.  Features: -Trend Line :  We add trend line on the chart in the hope it help you to see current trend on the chart while following oversold and overbought  from RSI. This is additional feature in the indicator. We consider that following the trend is very important in trading. -Changeable Panel Display :  Change the value of Max.Symbols/Panel and  the indicator will adjust the d
TrendScanner XTra scans market trends from Multi Symbols and Multi Timeframes with extra additional Entry Point Signals arrow on the current chart. Features: -Entry Point SIgnals :  This is additional feature in the indicator. No repaint arrows. The Trading system in the single indicator. MTF Trend informations and Entry Signals. In order to make it easier for trader to get trading moments from a single chart and  deciding entry time.  -Changeable Panel Display :  Change the value of Max.Symbo
PullbackMatrix provides the key information of the trading transactions when it finds the right market moment based on its built-in logic algorithm. The high accuracy signals including Trading Symbol, Entry Price, Entry Time, TakeProfit, Stoploss, and more. And that's all will be available instantly in your chart panel, drawing the position lines and also sending signal notification to email, mobile phone, and screen popup. More important is that also saves signals into a .csv file which is usef
It could help to calculate Risk-Reward easily before placing a BUY-SELL position. TradeSizeCalculator is a Multi-Tasking Calculator. It will calculate the others when we define the value in one of the columns. Stoploss, risk percentage, risk-money, lot size, take-profit , reward-money, and reward-ratio. Depending on which value is changed. All values in the columns are editable. Also, we can get those calculation results by drag-drop the stop-loss/take-profit line. Parameter: The inputs below ar
It has 3 capabilities at once and can be adjusted according to needs. Full Auto, Semi-Auto, or Warning Signals only. You can choose it by setting the parameters provided. Built to help Traders work much easier than doing it manually. Sharpen the accuracy of market analysis performed by a Trader by only executing in certain price areas and adjustable signal parameters. Features Ability to manage trading management, including automatically determining stop loss/take profit, calculating lot size ba
GU Spot is a One Shot One Kill EA. A  Scalping EA   for GBPUSD .   No Martingale, No Averaging, No Grid or other high-risk strategies.  Working with up to the best 100 trading signals algorithm from various Trading Systems. The combination of Price Action, High Low, Trend, Range Levels, Pullback /  Retracement and Reversal. This is Fully Automatic Trading Robot . High Accuracy Entry Signals and protected by a proper Money Management. A tight Stop Loss with SL:TP ratio 1:3 by default, Trailing an
SignalPinner is a trend line Indicator which can detect market trends early by including three types of signal arrows. Non repaint and trend following. Signals on the strong trend, signals in the beginning of trend and signals with multiple market analysis algorithm as the main signals. Supported by alert notification message to keep you getting signals while on the go. Symbols: Any Timeframes: Any Features Histogram buffers as a sign the trend is started. It can help the trader knowing the ma
Фильтр:
Нет отзывов
Ответ на отзыв
Версия 1.3 2024.01.29
1. Improvements to the trendline algorithm.
2. Changes to the default input values of the trendline parameter.
3. Changes to the color gradient on the trendlines with the aim of making it easier to distinguish and identify lines
Версия 1.2 2024.01.24
1. Adding input setting to limit number of bars to calculate trend and signals for better performance.
2. Adding input setting to adjust maximum upper/lower range of trendlines.
3. The improvement for trendlines algorithm,
4. The improvement for supply/demand algorithm.
5. Change the default parameter for trendline