Liquidity Pro
- Индикаторы
- Tariq Mahmood
- Версия: 2.0
- Обновлено: 7 июня 2024
- Активации: 5
Liquidity Pro
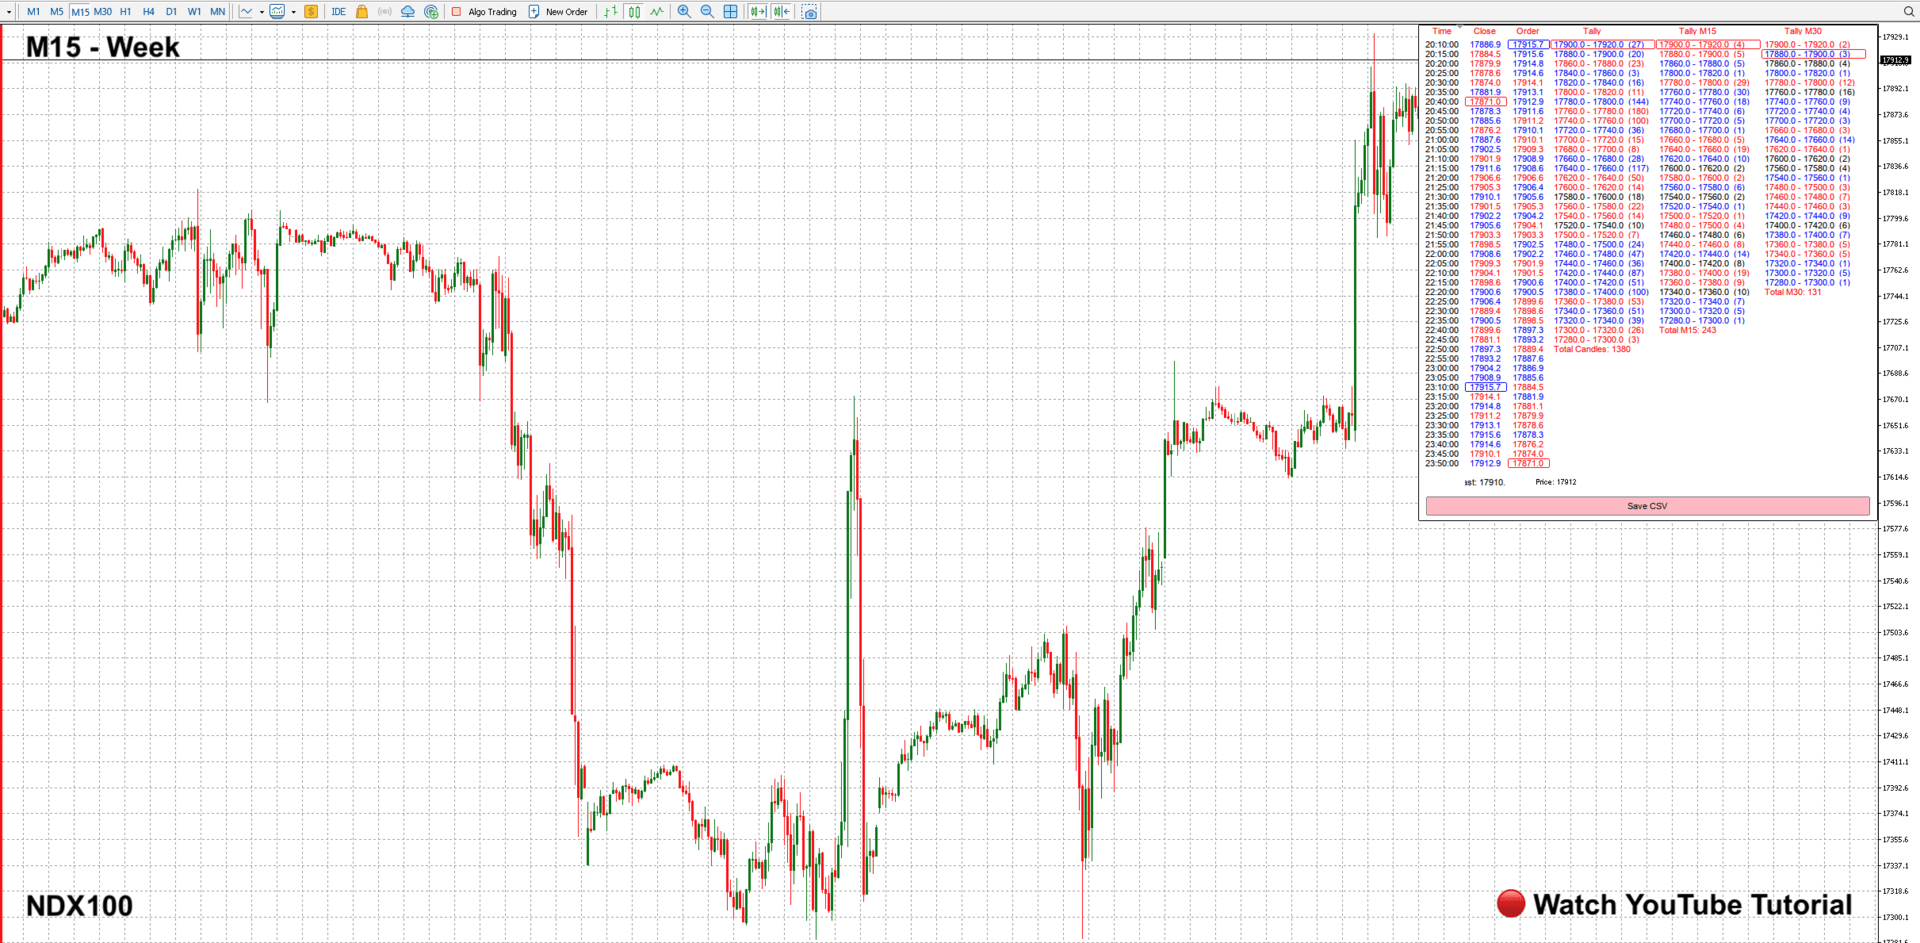
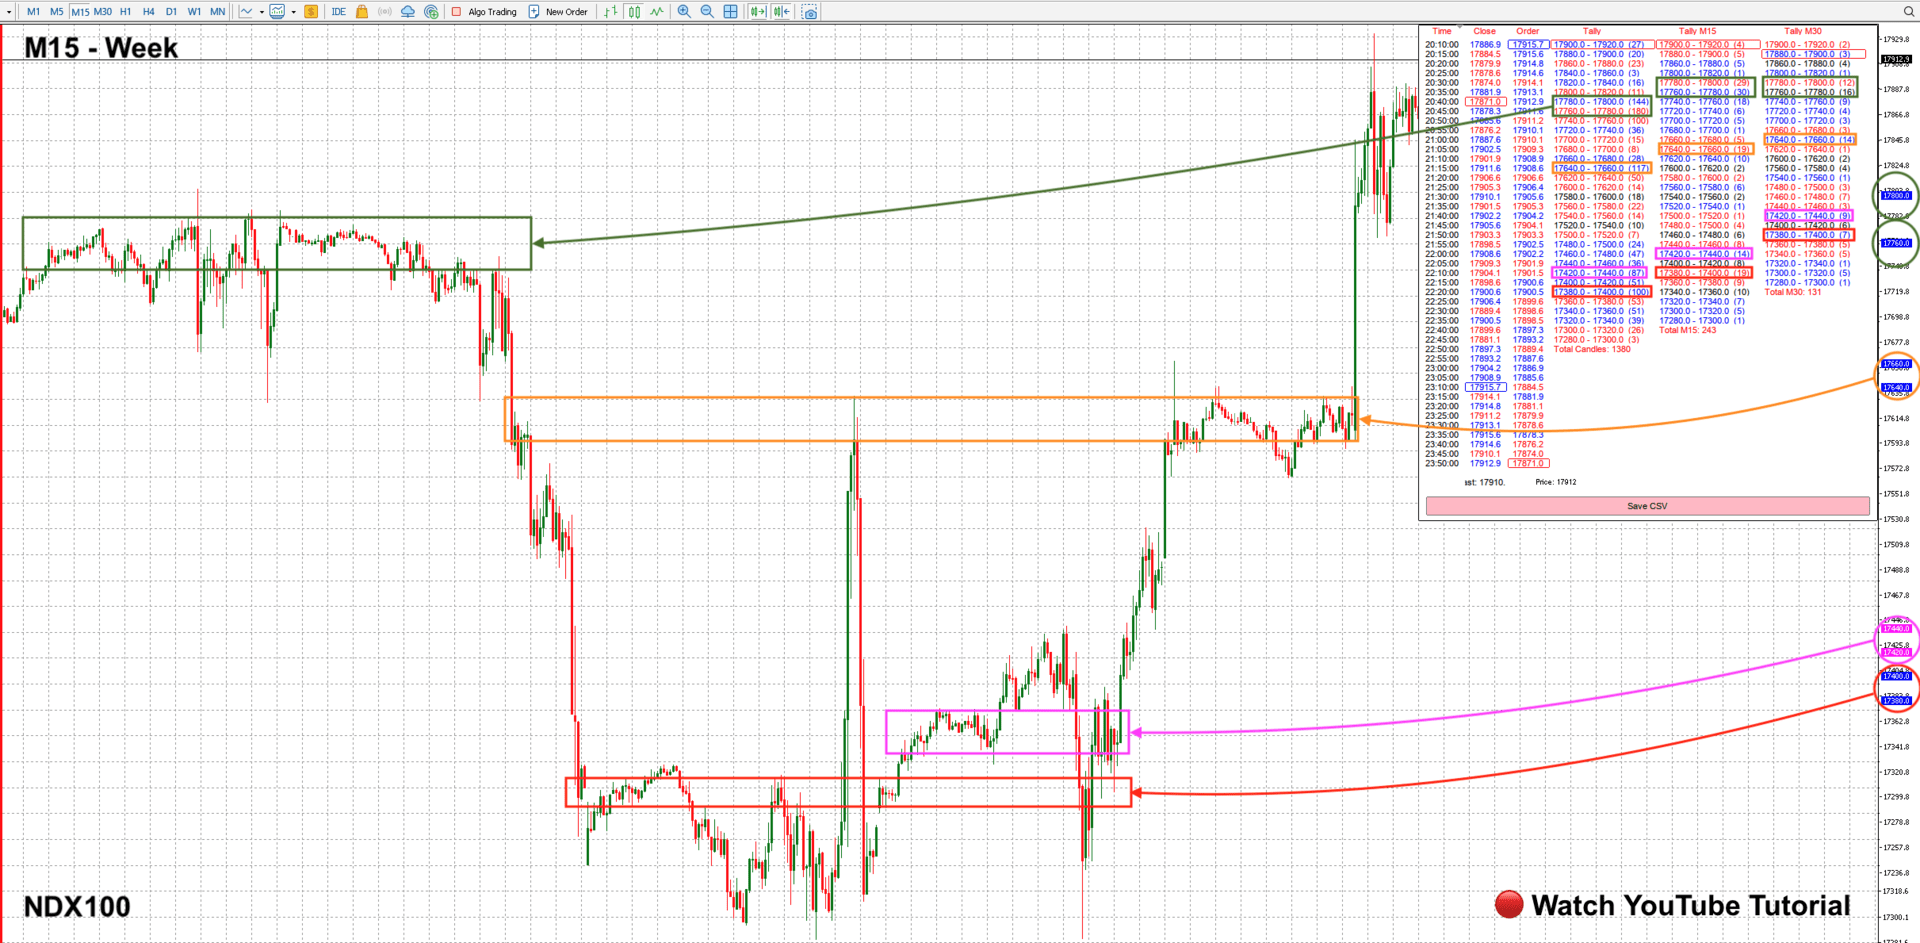
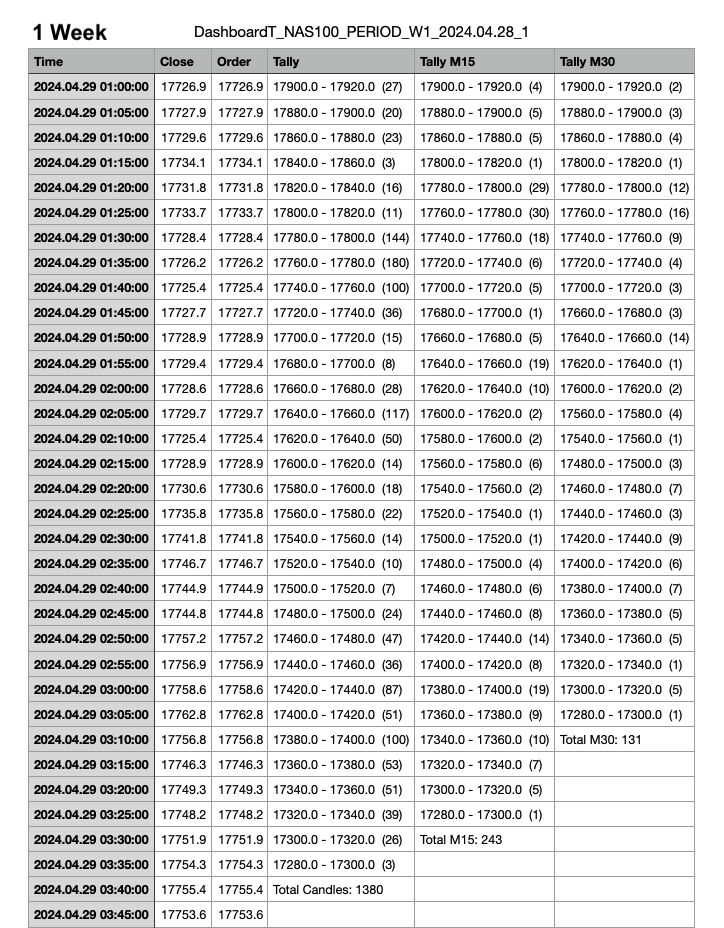
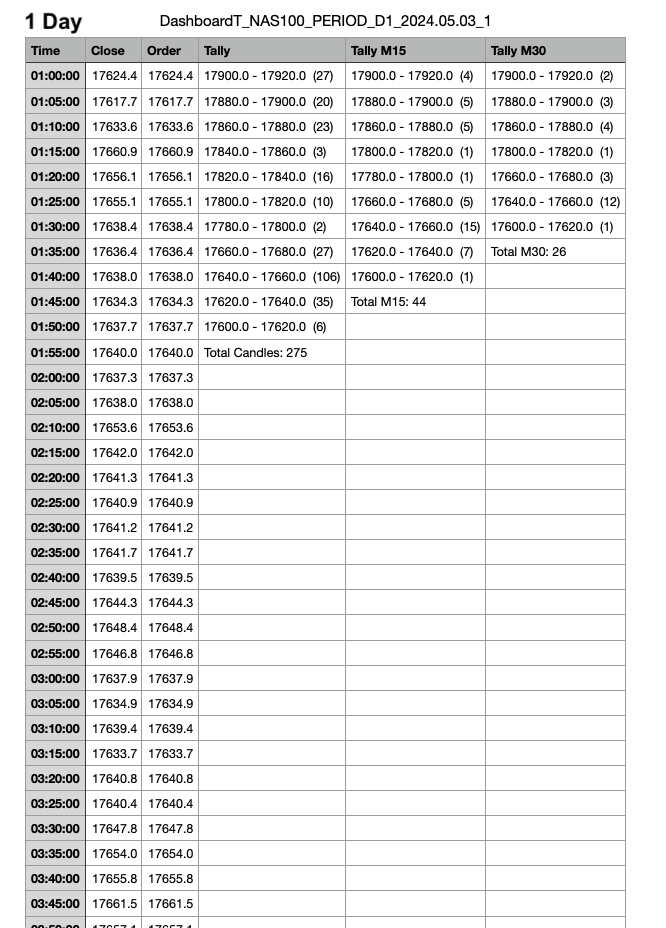
The Liquidity Pro pin points liquidity zones in any financial instrument, including currency pairs, cryptocurrencies, commodities, equities and indices. The Liquidity Pro shows previous and current liquidity zones, down to the present minute, providing essential information about your chosen trading pair, when conducting chart analysis or initiating trades.
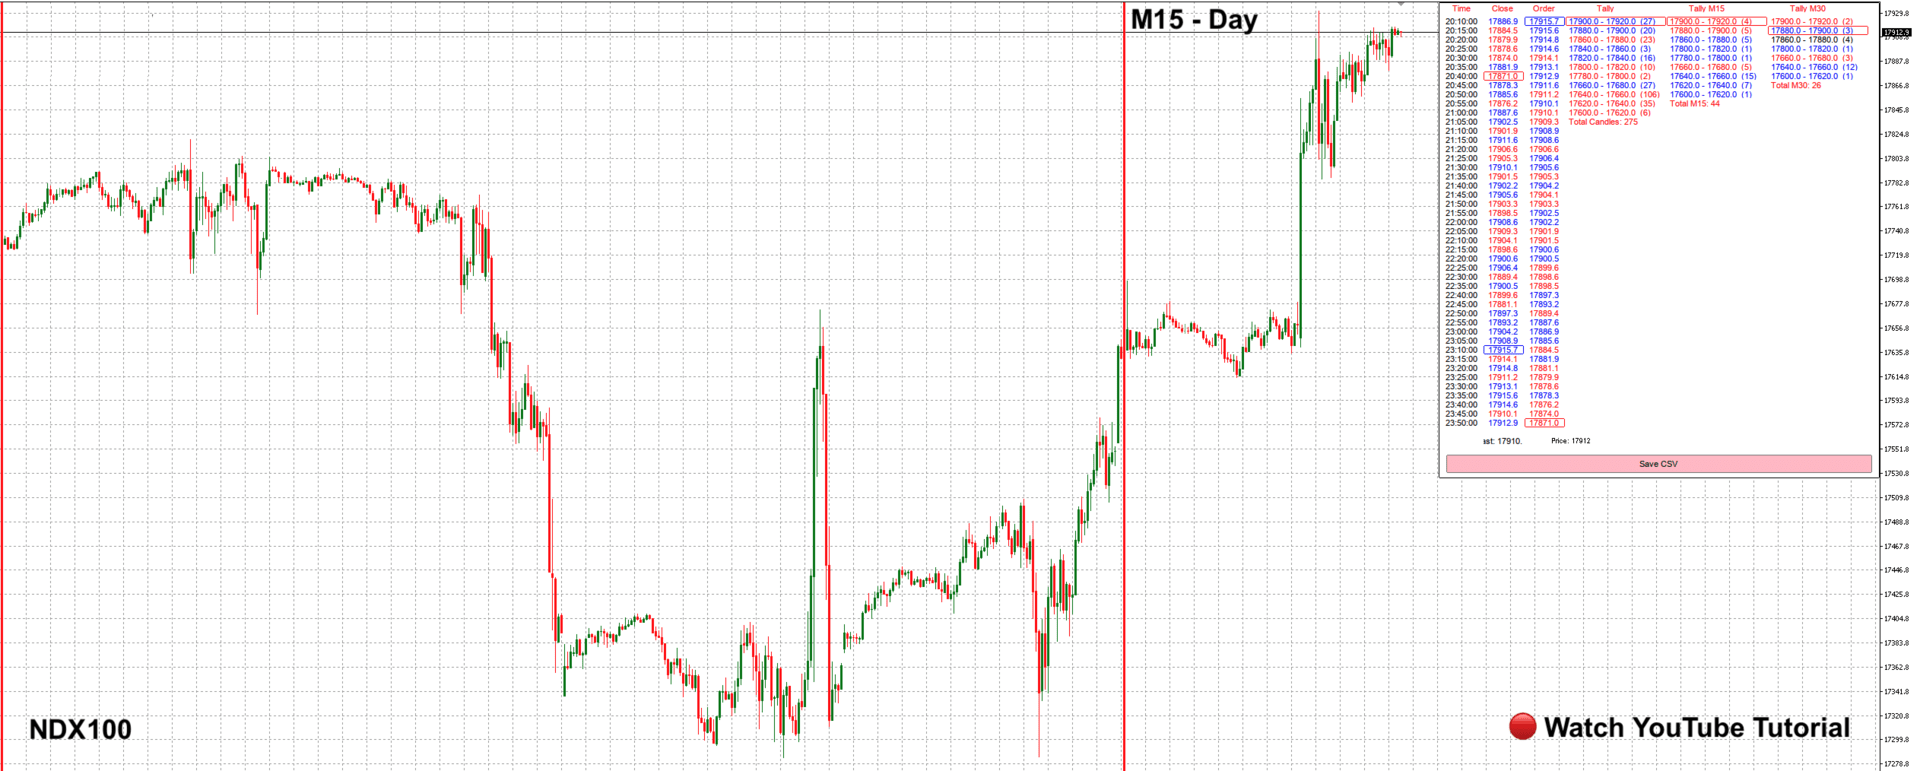
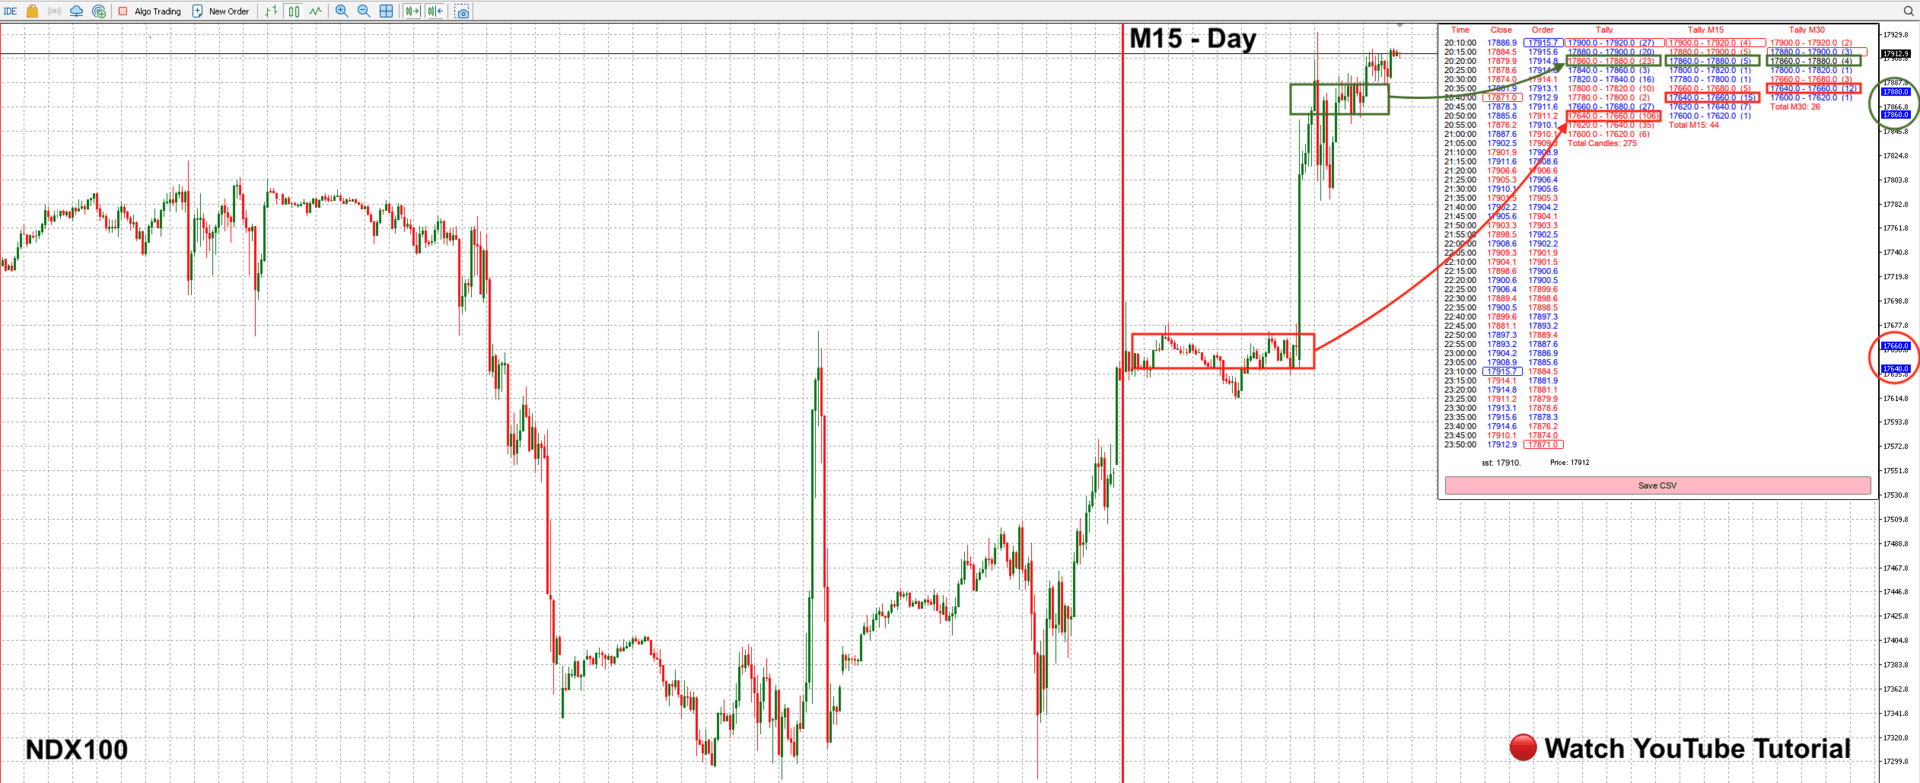
The Liquidity Pro allows you to observe where price consolidates, retraces, resists, or settles within support areas. It pinpoints areas where market participants are likely to react to price movements, providing real-time insights into market dynamics. Additionally, the Liquidity Finder offers a visual representation as the price approaches potential liquidity zones, enabling users to make quick and informed decisions. Additionally this indicator provides traders with detailed information about each candle's close time and price within their respective time frame.
One standout feature of this indicator is its ability to detect both bullish and bearish momentum at the close of each candle. It visually indicates wether the momentum is bullish or bearish at the conclusion of the last candle, irrespective of the chosen time frame. Further more it organises candle close price in sequential order, offering a visual representation of the trading pairs momentum.
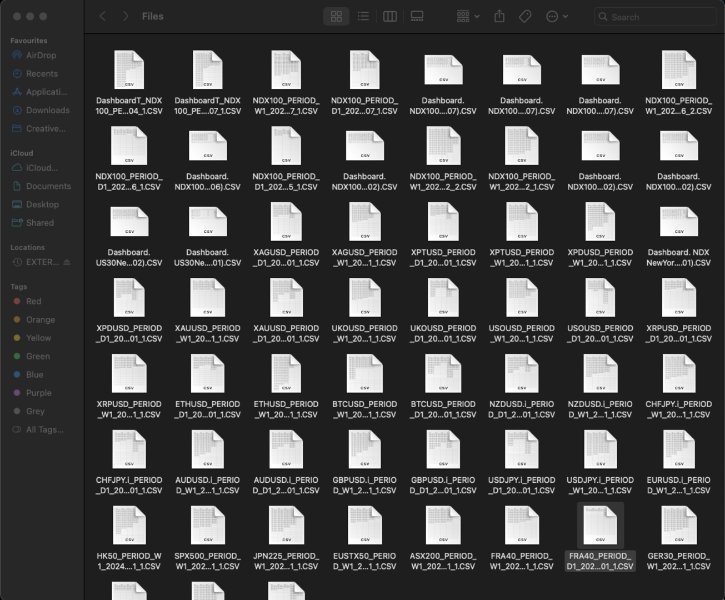
The Liquidity Pro stores the entire day's activity as a CSV file within an internal folder on MT5, making historical data easily accessible for future analysis. Please refer to our attached YouTube video for valuable insights into the functionality and detailed breakdown of how the Liquidity Pro presents essential information, assisting traders view charts with clarity.
What is liquidity?
Liquidity refers to when traders are actively buying or selling at a particular price level, causing the price to remain relatively stable over a certain period. High liquidity indicates a substantial presence of both buyers and sellers actively participating in currency trading, resulting in narrow bid-ask spreads and stable market prices. On the contrary, low liquidity may lead to broader spreads and heightened price volatility due to a reduced number of market participants.
Key Features
- Review price action for the current week, last week and last month.
- Track price action for the entire month down to the present second.
- Areas of liquidity are represented by a higher numerical value.
- Displays distribution of prices across different levels to identify areas of concentrated trading activity.
- View dynamic price action from M5, M15 and M30 time frames.
- View each candle close price in sequential order in real time, irrespective of the chosen time frame.
- All tally's update on the close of the candle, within the chosen time frame.
- Dynamic highlighting system indicates when the price is approaching a liquidity zone.
- Dynamic highlighting system indicates highest and lowest candle close.
- Quickly visualize bullish or bearish momentum at different price levels from market open, through colour representation of numerical values.
- Save daily trading activity in a CSV file for future reference or chart analysis.
- Offers an intuitive interface for easy interpretation and analysis of incoming data.
- Visual representation of price movement such as spikes, divergences or trends.
- Can be used in conjunction with other technical indicators for comprehensive market analysis.
- Enables users to analyze historical price action to identify past areas of liquidity and trends for chart analysis.
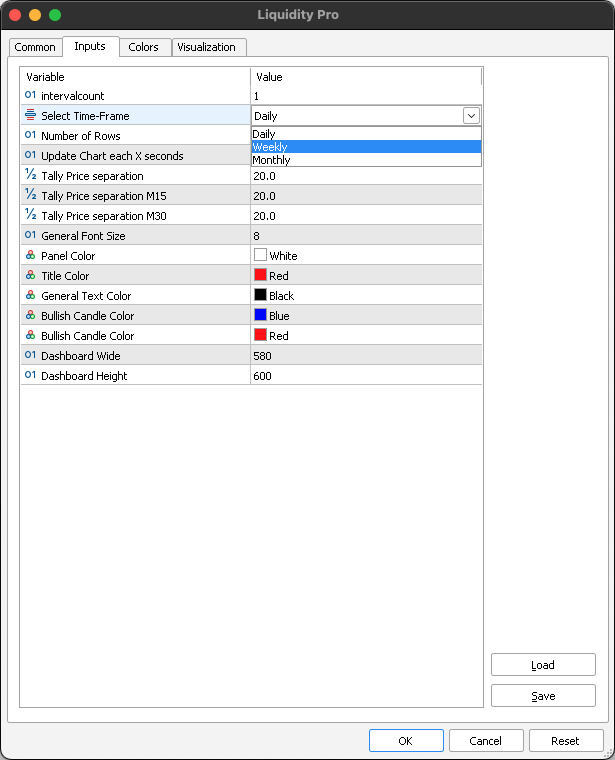
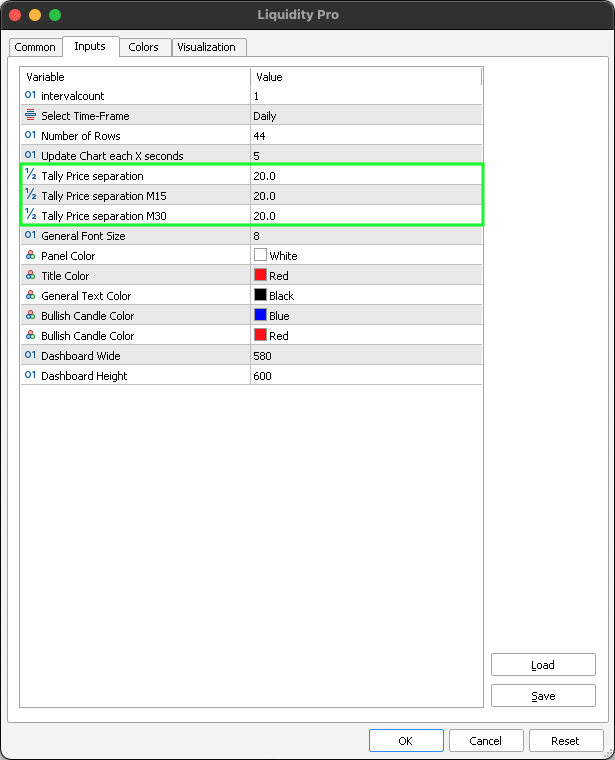
- Allows users to personalize settings such as font colour, session selection, and time periods.
Pricing
We have set a premium price for our MT5 indicators, reflecting over two years of development, rigorous backtesting, and diligent bug fixing to ensure optimal functionality. Our confidence in the precision and accuracy of our indicators is such that we regularly showcase them in real-time market conditions through daily content on our social media channels.
Our belief in trading simplicity, adhering to the principle of buying low and selling high, is echoed in our indicators' clear display of potential entry and exit points. We consistently provide daily content demonstrating our indicators in action. Additionally, we offer traders the opportunity to rent our indicators for $66 per month. This allows traders to test the indicator for one month with their chosen trading pair before committing to a yearly subscription.
We are committed to monitoring user feedback closely and making necessary improvements to our indicators should any bugs arise, ensuring that traders have access to the most effective tools for their trading endeavours.
MT4 Version Available: Yes
Currency Pairs: Any
Timeframe: Any
Brokers: Any
Account Type: Any
Prop Firms: Yes
Multi-Currency Indicator: Yes
Compatibility: Liquidity Pro works with currency pairs, indicies, equities, commodities and cryptocurrencies
BLOG: View settings for your selected trading pair CLICK HERE
NOTE: If you need help with settings or have any questions, please feel free to leave a comment in the comment section below. You can also visit our blog where you can leave a comment, and we'll respond promptly.
Numeric Value Colour Indication
- Blue Numerical Values - Bullish Momentum: Indicates a surplus of buyers and shortage of sellers, pushing the price up from the corresponding price level
- Red Numerical Values - Bearish Momentum: Indicates a surplus sellers and shortage of buyers, pushing the price down from the corresponding price level
- Black Numerics - Neutral Momentum: Indicates an equal amount of buyers and sellers at the corresponding price level
Note: Any trading decision made should be based on independent analysis and a thorough understanding of fundamentals, rather than solely relying on tally counts or the colour of numerical values.
Tally Time-Frames
- Tally M5: A higher numeric value indicates greater liquidity at a specific price level, while a lower numeric value suggests limited or no liquidity, allowing the price to move through this level easily without encountering significant resistance from buyers or sellers. The colour of the numerical value signifies the number of buyers or sellers present at that price level. This information typically updates at the close of each 5-minute candle.
- Tally M15: A higher numeric value indicates greater liquidity at a specific price level, while a lower numeric value suggests limited or no liquidity, allowing the price to move through this level easily without encountering significant resistance from buyers or sellers. The colour of the numerical value signifies the number of buyers or sellers present at that price level. This information typically updates at the close of each 15-minute candle.
- Tally M30: A higher numeric value indicates greater liquidity at a specific price level, while a lower numeric value suggests limited or no liquidity, allowing the price to move through this level easily without encountering significant resistance from buyers or sellers. The colour of the numerical value signifies the number of buyers or sellers present at that price level. This information typically updates at the close of each 30-minute candle.
Extras
- Time: Shows the timestamp of the latest candle closure, within the chart's chosen time frame.
- Close: Shows the latest candle close price, within the chart's chosen time frame and highlights both the highest and lowest candle close price.
- Order: Arranges the closing prices of the candles in sequential order, within the chart's chosen time frame and highlights both the highest and lowest candle close price.
- Save CSV: Save entire day's activity as a CSV file within an internal folder on MT5.
Disclaimer
We would like to emphasize that the information provided by seller and its affiliates, including its premium software subscribers, is not intended as financial advice and should not be construed as such. The content and opinions shared in our social media content and premium software subscription are for general informational purposes only, and they do not offer specific advice or recommendations for individuals or entities.
The seller and its affiliates do not endorse or recommend any securities, and our content is not an offer or solicitation to buy or sell any securities. The information provided in our social media content and premium software subscription may not be exhaustive and is subject to change without notice.
It's important to note that our social media content, research, information, and disclosures do not guarantee financial success or profitability. They provide insights into our investment strategies and how we manage our private capital in the financial markets.
Given the inherent risks of financial markets and the fact that past performance does not guarantee future results, we cannot assure specific outcomes or returns. Investing in financial markets carries the risk of loss.
Therefore, we advise conducting your own research and seeking professional advice before making any investment decisions. The information and opinions presented in our social media content and premium software subscription are meant for general informational purposes only and do not constitute specific advice or recommendations for any individual or entity.
By purchasing any premium software subscription, you acknowledge and accept that the seller and its affiliates are not liable for any investment decisions made based on information provided through social media content or premium subscription software.