• Обзор
  • Отзывы (1)
  • Обсуждение
  • Что нового

ChartGetSignal

1

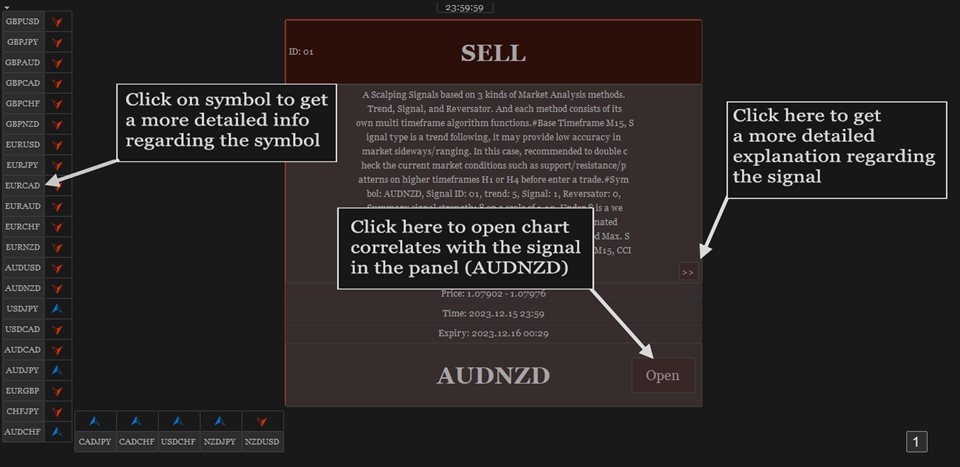
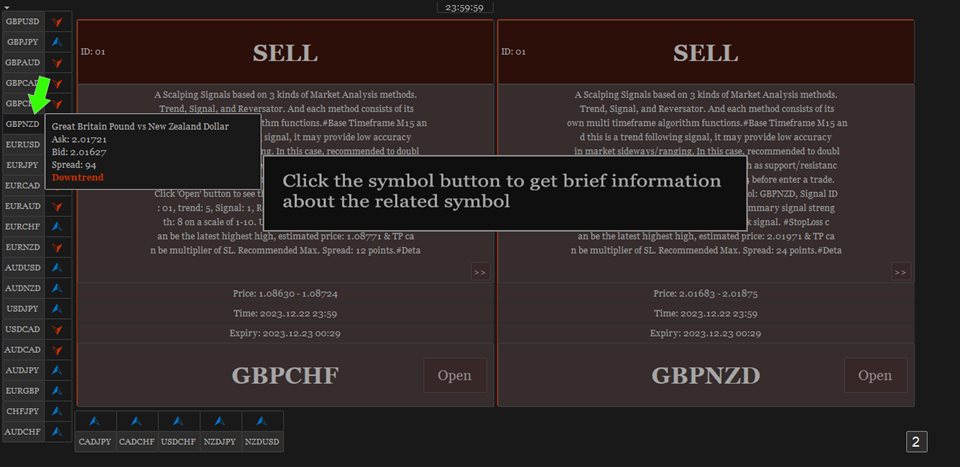
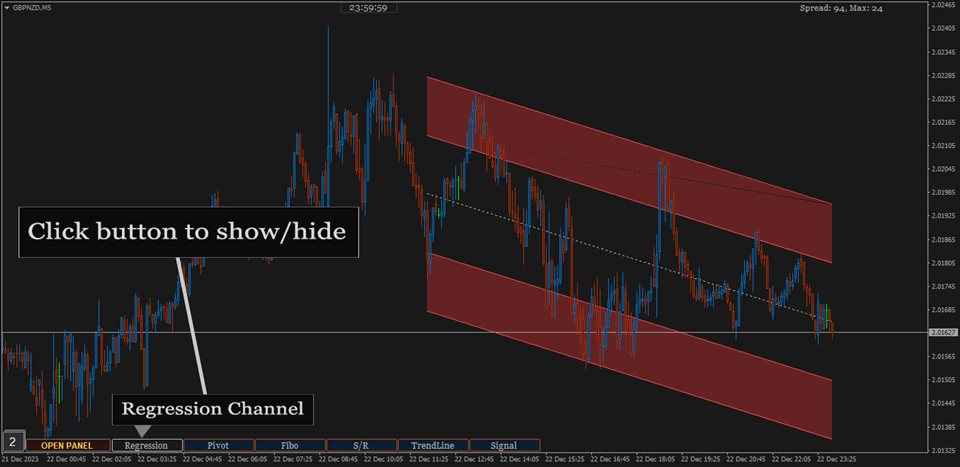
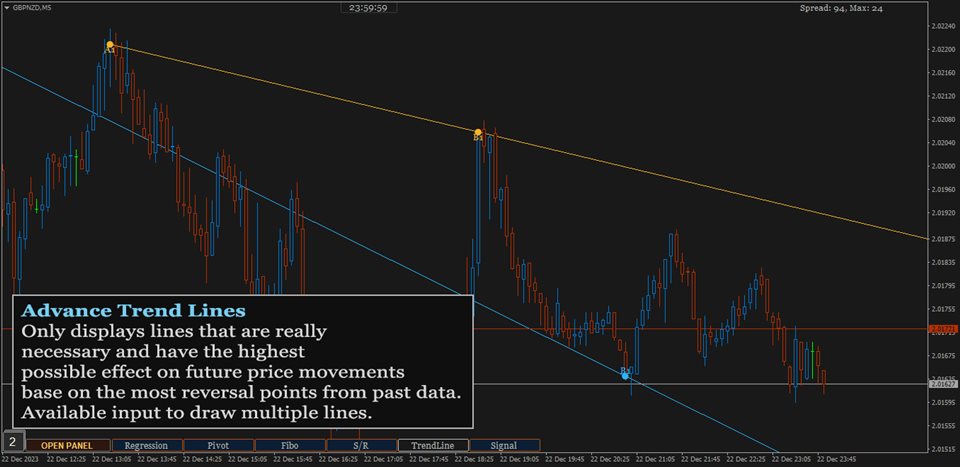
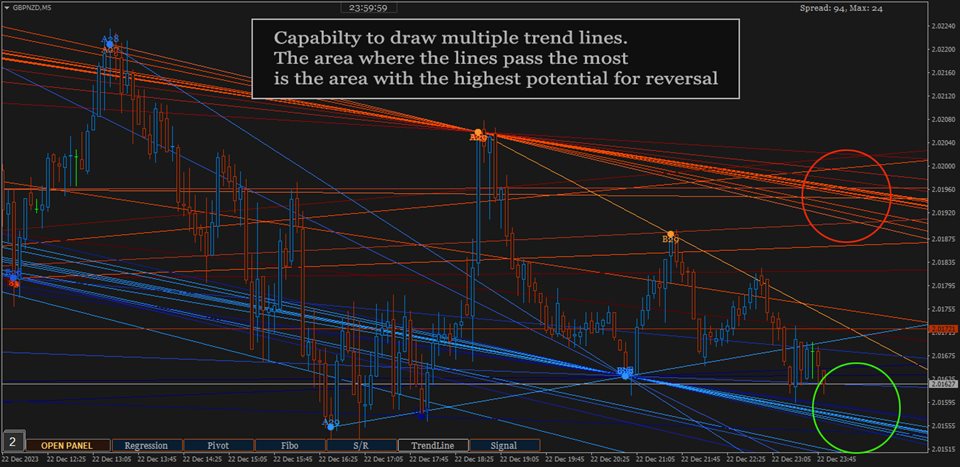
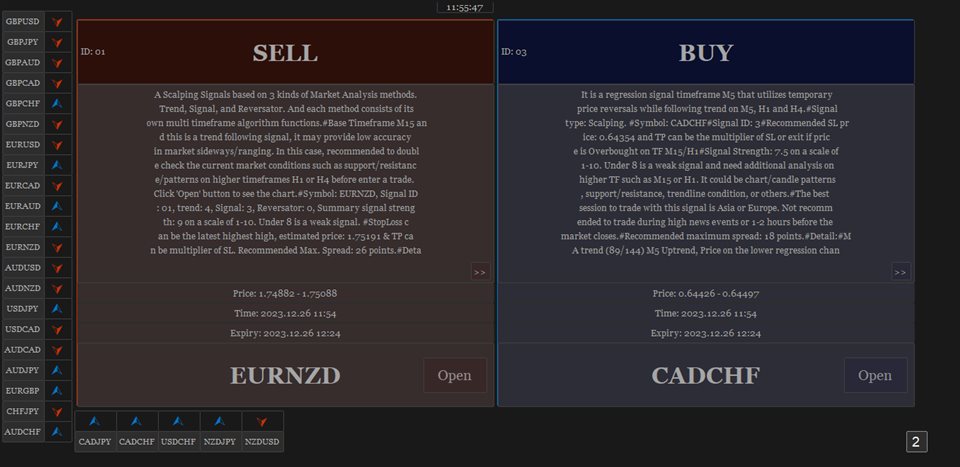
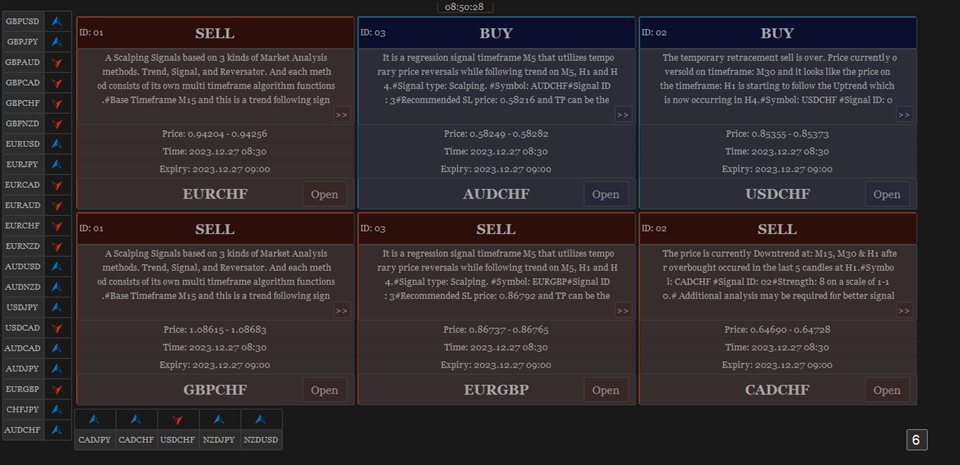
Provides instant signals on the chart in panel form. Equipped with signal description and trading analysis tools such as drawing auto trendlines, support/resistance area, regression channel, Fibonacci levels, Pivot levels and current signal price, signal time, signal expiry and stoploss recommendation. Also sending alert messages to all available mt4 alert tool.

A detailed description panel provides information about where the signal comes from and what indicators are behind the signal. Including the suggestion that need to be considered before carrying out market execution. So that trader can draw conclusions and take necessary actions.

The Open Chart button to switch alternately between chart and panel, making it easier for trader to analyze chart directly based on signals currently available on the panel. The signals can be from various symbols, according to the desired input in the external parameter. Any symbols available in the market watch including forex, metal, indices, crypto, oil and futures.


The strategy behind the signals:

This is an important part of ChartGetSignal Indicator. It will display a signal on the panel when market conditions match the algorithm embedded in the indicator. Followed by an alert if enabled. The algorithms include Fibonacci retracement, regression, price action and custom trends. And several supporting indicators: MA, SAR, MACD, Stochastic, RSI, CCI and RVI. We combine them based on strategies that we consider having the highest potential to provide the next market direction. Including combining signals between timeframes to get confirmation from different period levels. The first step of the indicator is to detect the current trend from several required timeframes and then the second, finding a signal that matches the direction of the trend. Signals can come from price crossovers of several indicators and various timeframes, price action, crossovers at high-low prices or regression areas, the price is in the golden Fibonacci retracement area and is followed by a price that is oversold/overbought at a certain time frame and several other techniques to trigger signals. It is a complementary cross-strategy, cross-timeframe and cross-symbol signal scanner. Whichever signal is found first will be displayed on the panel and ChartGetSIgnal Indicator can display more than a signal at the same time on the chart.


How to trade:

We include a brief explanation of the signal on the panel with the aim of letting you know what is happening behind the signal. So, you make the right decision. You don't have to always follow existing signals because the market is very dynamic and requires improvisation at any time to suit current market conditions.

  1. It is highly recommended to read the explanation on the panel before executing the trade because here we provide some information regarding the signal such as a stoploss recommendation which describes the time range of the signal, the strategy inside the signal, spread and also suggestion that may need to be considered before taking a trading action.
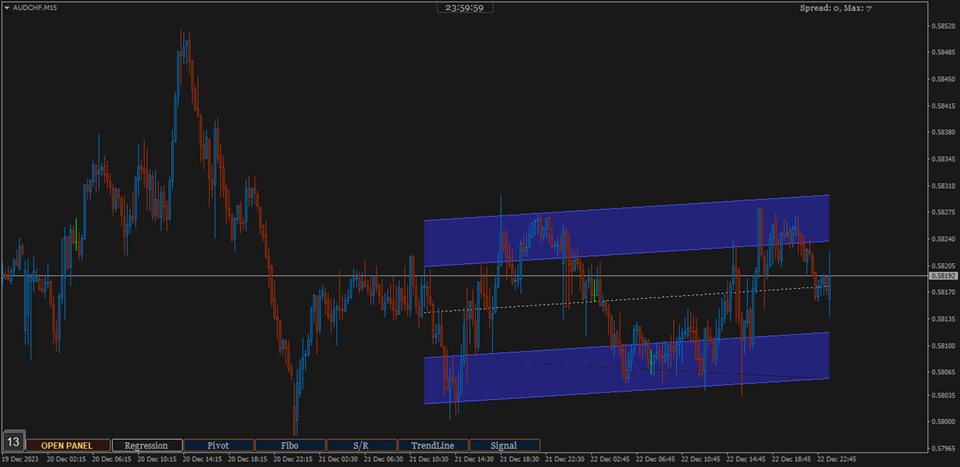
  2. Open the chart to perform additional analysis. Click the 'Open' button on the signal panel and by default, it will open the M15 timeframe with symbols related to the signal. Several analysis tools are available on the chart. Click buttons at the bottom to show/hide. Regression channel, Pivot levels, Fibonacci Retracement level, Support/Resistance areas, Trendlines, and also the Signal itself which contains information about the direction, entry price range and stoploss. Take advantage of them to find out the current price position. Make changes to the parameters of those tools like the Trendline and Support/resistance parameter if necessary. You can also put your own indicators to strengthen the confidence of your decision.
  3. Look at Support and Resistance from different timeframes - especially on higher timeframes - to determine more accurate take profit or stop loss. Because the exit is as important as the entry itself.
  4. You can cancel the execution in case you see the price is in the opposite Support/Resistance area or the price is Oversold/Overbought. Because the indicator does not accommodate all current market conditions. It will produce very few signals in the same time span in case we do it. For that reason, we set a scale to display the signal. If the minimum scale, we specified in the code is met then the signal is triggered. The scale value can be read on the description panel.
  5. Use proper trading and money management. Adjust to your account condition.


Parameters:

  1. Trading Symbols (separated by comma): input the symbol to be scanned. It can be any symbol and should be the symbols available in the market watch.
  2. Symbol Prefix: The symbol prefix if available. Otherwise leave it blank.
  3. Symbol Suffix: The symbol Suffix if available. Example: EURUSD.s, then the suffix is .s
  4. Signal Storage Time in minute (min. 15): The indicator will store and maintain the signal on the panel for the time period specified here. Minimum Value is 15 that means 15 minutes.
  5. Support/Resistance Period: The indicator will look for reversal points at every number of bars specified here until up to 1000 bars back. And it will draw Support/Resistance area based on the data.
  6. Support/Resistance Strength: This value is the minimum number of reversal points - highest high and lowest low - in the past that the indicator must count to display Support/Resistance area. The idea is that the higher the number, the higher the probability of a reversal in the future. If the entered value is not found in the existing history, the indicator will not display Support/Resistance areaSo, the lower the value entered, the more Support/Resistance areas will possibly be displayed and vice versa.
  7. Bars to search TrendLines: This is the maximum number of bars that the indicator must count to display a trendline. Within the range of bar values specified here, the indicator will look for the most relevant points and the most frequent price reversals to draw trend lines.
  8. TrendLines Period: This is similar to point 5 above. But this is to determine the trend line.  The indicator will look for reversal points at every number of bars specified here until up to the number of 'Bars to search TrendLines'  specified in point 7.
  9. Max. Trendlines/Side: The indicator can display more than one line per 'up/down' side based on the values specified in points 7 and 8 above. With the condition that trend line is found based on the input above. Maximum value of this input is 30 for performance reason.
  10. Bars Multiplier: It is the multiplier of the value of ' Bars to search TrendLines' (point 7). This value will be used only if ' Max. Trendlines/Side' specified in point 9 is more than 1. The formula is Bars to search TrendLines x line index x Bars Multiplier. Example:  Bars to search TrendLines= 300, Max. Trendlines/Side= 4 and Bars Multiplier= 2 then the indicator will draw the trend lines with such conditions:
    • The first 2 lines (upper & lower) are drawn from the calculation of the last 600 bars. 300 x 1 x 2
    • The second 2 lines (upper & lower) are drawn from the calculation of the last 1200 bars.  300 x 2 x 2
    • The third 2 lines (upper & lower) are drawn from the calculation of the last 1800 bars.  300 x 3 x 2
    • The fourth 2 lines (upper & lower) are drawn from the calculation of the last 2400 bars.  300 x 4 x 2
    • And so on, if 'Max. Trendlines/Side' is added more in value.
    1. Trendlines width: The width of trend lines. 
    2. Fibo Period: Number of bars to calculate the Fibonacci Retracement Levels.
    3. Shape Fibo Golden Ratio: Option to draw background color in the Golden Ratio area for Fibonacci Retracement Levels.
    4. Pivot Levels Timeframe: Option Timeframe to draw Pivot Levels. The Levels are drawn from the data of the last candle close of the timeframe specified here.
    5. Regression Fast Period: The Fast period of MA to determine the trend in regression signals. 
    6. Regression Slow Period: The Slow period of MA to determine the trend in regression signals and also this is the number of bars to calculate the regression channel. 
    7. Regression Deviation: The deviation of regression channel.

    8. Below are the candle color settings when the chart is opened:
    9. Bar Up Color: The color of bar up.
    10. Bull Candle Color:  The color of bull candle. 
    11. Bear Candle Color:  The color of bear candle.

    12. Indicator alerts:
    13. PopUp Alert
    14. Mobile Notification Alert
    15. Email Alert


    FAQS

    1. How many signals does the indicator generate per day? 
    2. *The average signal generated can be up to 50 signals per day and depends on market conditions. Minimum 10 per day. With the assumption that MT4 is online 24 hours.
    3. The indicator displays error text on the chart, what should I do?
    4. *The indicator will automatically download history data if the existing data is insufficient to generate a signal. It will display an error message when downloading the data. Wait a few moments until the download is complete. Make sure you write the input symbols correctly, including prefixes and suffixes and comma as symbol separator.
    5. Why can't indicators be attached to charts?
    6. *It will be automatically removed from the chart if a mistake in inputting the symbol is found or the symbol is not available on market watch. Try to check again the symbol input.
    7. This indicator makes my MT4 run slowly, what should I do to improve its performance?
    8. *Normally, it should not happen. Because we took that into consideration when building this indicator. However, if that happens, try changing some of the overloading parameters. For example: reducing the number of symbols or the 'Max. Trendlines/Sides'.
    9. What does the ID displayed on the signal panel mean?
    10. *There are several trading strategies behind the signal and the ID is to mark the strategy. Each strategy has its own ID.
    11. What time zone is used in this indicator to determine the time and expiration of the signal?
    12. *It uses Time Server.
    13. How much minimum capital is required to trade with this indicator?
    14. *You can use as much capital as you want according to the rules applied by your broker. There is no minimum limit.
    15. Will you make updates in the future, including adding trading strategies?
    16. *Of course. I will make regular updates, if necessary, as I also do with my other products.
    17. Is it possible to use the signals to apply to EA?
    18. *Yes, possible. ChartGetSignal save the signal to file txt, everytime new signal is triggered. Real time updated. You can use it to apply to the EA.

    If you have any question, please don't hesitate to contact me.


    Рекомендуем также
    The Auto Super Pivot indicator is an indicator designed to calculate support points and resistance points for pivot points. this indicator has the ability to calculate standard pivot, fibonacci, camarilla, woodie and demark pivot points. It also allows you to use all time zones with the time frame feature. Another feature of the indicator is the auto time slice feature. This feature allows automatic calculations without having to set any time zone. Features 6 different pivot calculation modes
    Pivot Points MT4
    KEENBASE SOFTWARE SOLUTIONS
    KT Pivot Points automatically plots the daily, weekly, and monthly pivot levels on a chart with the precise calculation based on the latest data. Pivot points is a widely used indicator in technical analysis, particularly in the Forex market. Features Send alerts when the price touches the pivot level.  It offers complete customization for each kind of pivot level.   Shows daily, weekly, and monthly pivot levels without any fuss. It uses minimum CPU resources for faster calculation. Compati
    DoAid
    Samuel Akinbowale
    5 (1)
    DoAid DoAid indicator is a simple channel indicator with an advance timeframe correlation board. DoAid indicator: can be used with any instrument provided by your broker and MetaTrader, be it Currency , Commodity ,Stock, or Cryptocurrencies. DoAid indicator   can be used for swing, scalping and day trading. DoAid indicator   is also a multi time-frame indicator {MTF}. DoAid indicator can be used with any timeframe. It does not repaint.It does not repaint. When To Buy if the market
    Общая информация Это версия DELUX серии индикаторов Pivot Point Plotter Series. Это надежный индикатор, который динамически вычисляет и строит на графике любые четыре основные точки разворота независимо от внутридневного таймфрейма, на котором вы используете индикатор. Индикатор рисует точки разворота STANDARD, CAMARILLA, FIBONNACI и WOODIE. Какой бы из них вы ни использовали в своей торговле, этот индикатор самая выгодная покупка. Пожалуйста, обратите внимание, что это дневной вариант индикатор
    Индикатор FiboZag - перенесите индикатор на график и уровни Фибоначчи будут построены автоматически по последнему развороту ZigZag-а. Основное преимущество заключается в корректном построении уровней Фибоначчи и разметке ценовых уровней. Простое, визуальное и эффективное использование. Индикатор не перерисовывается и не запаздывает. Работает на всех валютных парах и на всех таймфреймах.
    Supply Demand Zone Pro Indicator works with all products and timeframes. It is using a new calculation method, and now you can select the desired zone on any timeframe! Strongest Zones are already enabled by default This is a great advantage in trading.This indicator has a built in backtester enabled by default, just move the chart. Supply and Demand ? Supply is a price zone where sellers outnumbered buyers and drove the price lower. Demand is a price zone where buyers outnumbers sellers and
    Reversals typically refer to large price changes, where the trend changes direction. Small counter-moves against the trend are called pullbacks or consolidations.When it starts to occur, a reversal isn't distinguishable from a pullback. A reversal keeps going and forms a new trend, while a pullback ends and then the price starts moving back in the trending direction. Difference Between a Reversal and a Pullback A reversal is a trend change in the price of an asset. A pullback is a counter-move w
    Что такое "точки разворота"? Анализ точек разворота зачастую применяется совместно с расчетом уровней поддержки и сопротивления, как и в случае с анализом трендовых линий. При анализе точек разворота первые уровни поддержки и сопротивления рассчитываются с использованием ширины торгового диапазона между точкой разворота и максимальной или минимальной ценой за предыдущий день. Вторые уровни поддержки и сопротивления рассчитываются с использованием всей ширины между максимальной и минимальной цен
    Black series MT4 - Индикатор предназначен для торговли на бинарных опционах с Tаймфреймом М1-M5-M15 Мультивалютный (Работает на криптовалюте и на валютных парах) Сигнал появляется при открытии свечи До 90% верных сигналов Полностью отсутствует перерисовка сигналов  Можно использовать с другими индикаторами. Хороший для скальпинга! В Настройках есть: -Методы работы индикатора -И Аллерт Цвет стрелок Красный сигнал вниз Синий сигнал вверх Так же смотрите видео как работает индикатор и появляются си
    Индикатор построения трендовых линий по алгоритму Томаса Демарка. Строит на одном графике линии с разных таймфреймов, старших или равных таймфрейму графика, на который наложен индикатор. Учитывает квалификаторы пробоя (при выполнении условий на месте пробоя появляется дополнительный значок) и строит ориентировочные цели (линии цели выше/ниже текущих цен) согласно алгоритму Томаса Демарка. Рекомендуемые таймфреймы для торговли D1+H1. Построение трендовых линий для остальных таймфреймов может дать
    Alpha Trend sign - это мой давний и очень популярный торговый инструмент, который проверяет нашу торговую систему и четко сигнализирует о транзакциях, которые не дрейфуют.   Основные функции:   • В зависимости от того, показывает ли рынок активную область, показатели могут быть очень интуитивными, чтобы определить, является ли текущая конъюнктура трендовой или шоковой.   И в соответствии с индикатором стрелка врезается на рынок, зеленая стрела подсказывает купить, красная стрела подсказыв
    NEW Timing Ossillator
    Tjia Elisabeth Jasmine Canadi
    [As of November 15, downloaded by 38 traders]  [ Disclaimer ] u can download it for free to help with the analysis using oscillators just for CyberBot customers! cool news: anyone can turn it on without joining the main product [paid or free]. but heads up - a warning might pop up since this is linked to the main product. if u like it and find it helpful, u can upgrade the "ReviewPass" by just writing a few sentences in the review box to be a wise reviewer. hurry up while it's still free, spots
    FREE
    Indicator captures the trend reversals with no-repaint Buy and Sell Arrow signals. CyberZingFx Trend Reversal Indicator - your go-to solution for accurate and reliable trend reversal signals. With its  advanced trading strategy , the indicator offers you Buy and Sell Arrow signals that do not repaint, making it a reliable tool for catching Swing Highs and Swing Lows in any market and any time frame. Indicator works on  any market  and  any time frames . __________________________________________
    This tool draws all the pivot point lines on chart. It is important to remind/tell you that there are 5 pivot method according to BabyPips website. All these methods have their unique mathematical formula. 1. Floor Method. 2. Woodie Method. 3. Camarilla Method. 4. DeMark Method. 5. Fibonacci Method. What makes this pivot tool unique is that you can click the "Fibonacci" button to select the pivot method you want. You can click the "Monthly" button to select the Period you want to use for the piv
    Что такое Pivot? Пивот - это заранее известный важный ценовой уровень, который трейдеры считают важным и могут принимать торговые решения вокруг этого уровня. В качестве технического индикатора цена разворота похожа на уровень сопротивления или поддержки. Если уровень разворота будет превышен, ожидается, что цена продолжит движение в этом направлении. Или цена может развернуться на этом уровне или около него. Что вам говорит Pivot? Есть развороты и опорные точки. Эти термины могут означат
    Introduction It is common practice for professional trades to hide their stop loss / take profit from their brokers. Either from keeping their strategy to the themselves or from the fear that their broker works against them. Using this indicator, the stop loss / take profit points will be drawn on the product chart using the bid price. So, you can see exactly when the price is hit and close it manually.  Usage Once attached to the chart, the indicator scans the open orders to attach lines fo
    Pivots MT4 - Простой и удобный индикатор уровней pivot , рассчитывает уровни по методам  Classic , Fibonacci , DeMark , Camarilla , WooDie , Central Pivot Range . Индикатор выгодно отличается следующим Рассчитывает уровни pivot по методам  Classic ,  Fibonacci ,  DeMark ,  Camarilla ,  WooDie ,  Central Pivot Range ; Выводит на графике текущие уровни и уровни на предыдущих периодах; Выводит на графике выбранные метод и период, названия уровней и их ценовые значения. Параметры Pivot Method - Вып
    Индикатор строит гибкие уровни поддержки и сопротивления (точками). Для построения используется особая фаза движения. Уровни формируются динамически, то есть, каждая новая свеча может продолжить уровень или завершить. Уровень может оказывать сопротивление или поддержку цене даже там, где его уже нет. Также уровни поддержки и сопротивление могут меняться ролями. На значимость уровней влияют: количество времени формирования уровня и количество касаний. Важность уровней заключается в том, ч
    PLUTO MASTER TURTLE (Binary Option)   The indicator allows you to trade binary options. The recommended timeframe is М5 and the expiration time is 5 minutes. The indicator works on any currency pairs. Trading time is not limited. A possible signal is specified as a arrow above/under a candle. If the arrow remains on the previous candle, you can enter the trade immediately. Arrows are not re-painted! The trading strategy is based on the correlation of the statistical RSI, STO and Candlestick body
    Pivot Points และระดับ (Support) และ(Resistance) บนแผนภูมิการเทรดใน MetaTrader 4 สำหรับตลาด Forex : คำนวณ Pivot Points : สคริปต์คำนวณจุด Pivot โดยใช้ข้อมูลราคาประวัติศาสตร์ เช่น ราคาเปิด, ราคาสูงสุด, ราคาต่ำสุด, และราคาปิด จากช่วงเวลาที่กำหนด (เช่น วัน, ชั่วโมง, ฯลฯ) จุด Pivot และระดับต่างๆ เช่น R1, R2, R3 (ระดับการต้านทาน) และ S1, S2, S3 (ระดับการสนับสนุน) ถูกคำนวณออกมา แสดงบนแผนภูมิ : หลังจากคำนวณจุด Pivot และระดับต่างๆ, สคริปต์จะแสดงเส้นเหล่านี้บนแผนภูมิ MT4 เพื่อช่วยให้นักเทรดสามารถเห็นจุดที่
    MA bounce LITE arrows is simplified version of main indicator MA bounce . It's for people who don't need to use all features of main indicator. Lite version shows only arrows on chart when there is high probability of price bounce from selected MA. MA bounce LITE arrows input settings: Current MA period  - period of moving average on current TF Current     MA type   - moving average calculation method  on current TF Current     MA applied price   - applied price of moving average  on current T
    Indicator Support and Resistence plain in your chart seven lines; Red line=Resistence 3. Red line=Resistence 2. Red line=Resistence 1. Yellow line= Pivot. Green line= Support 1. Green line= Support 2. Green line= Support 3. adattable in all timeframe (minute 1, minute   5, minute   15, minute   30, Hour 1, Hour 4,Day 1,Week 1,Mounth 1); Buy under support and sell over the resistence;
    Magic Pivot это профессиональный индикатор для нахождения линий поддержки и сопротивления, разработанный группой профессиональных трейдеров. Индикатор строит три линии поддержки и три линии сопротивления, от которых с высокой вероятности произойдет разворот. Magic Pivot это отличный инструмент для скальпинга и торговли внутри дня.   Преимущества Высокая точность сигналов. Подходит для скальпинга и торговли внутри дня. Индикатор не перерисовывается. Простая настройка индикатора, минимум настроек
    FREE DOWNLOAD  Understanding Support & Resistance Support and Resistance are critical levels used by market participants in making decisions. This level is used to determine whether the price will continue or reverse direction. If this Support and Resistance is combined with candlestick forms, it is believed that it will be able to determine the next movement.  Economic support can be interpreted as a level where supply begins to decrease and demand increases so that if that happens, prices will
    Classic Fractals indicator for MT4, with additional Trendlines connecting the latest couples of fractals ( fractals are showing highest high, and lowest low on each period) Rules for trendlines: -if new top fractal is below the last one = new resistance line -if new bot fractal is above the last one = new support line -Trendlines can be hidden -Fractals can be hidden Fractal Period = can be both even or uneven number, as it is setting for half (one side) of the bars sequence
    Pivot Points Indicator Features: Send alerts when a pivot line is hit Displays Daily, Weekly, Monthly Indicators at the same time on the chart Restricting the time during the day when the alerts are sent Adjust the styling settings for the Pivot lines Settings: Show Daily Pivots Show Weekly Pivots Show Monthly Pivots Weekly Pivots Hit Notification Enabled Monthly Pivots Hit Notification Enabled Hit Check Frequency Time Restriction Enabled From Hour To Hour PP Color R1 Color R2 Color R3 Color S1
    This indicator works on MT4 and is very easy to use. When you receive a signal from it, you wait for that candle with the signal to close and you enter your trade at the beginning of the next new candle . A red arrow means sell and a green arrow means buy. All arrows comes with Alert  like for easy identification of trade signal. Are you okay with that? 1 minute candle 1 minute expire
    Pivot Point Indicator (Poivt) ClassicMode indicator calculation formula (ClassicMode): pp=(High+Low+Close)/3.0         s1=2*pp-High         s2=pp-(High-Low)         s3=Low-2*(High-pp)         r1=2*pp-Low         r2=pp+(High-Low)         r3=High+2*(pp-Low) Woodie Mode indicator calculation formula (WoodieMode): pp=(High+Low+2*Close)/4.0         s1=2*pp-High         s2=pp-(High-Low)         s3=Low-2*(High-pp)         r1=2*pp-Low                 r2=pp+(High-Low)         r3=H
    Key level wedge pro
    Presley Annais Tatenda Meck
    5 (1)
    We have combined all of our beloved indicators the likes of: Key level order block , Key level supply and demand , Key level liquidity grab and Key level wedge into one single indicator and dashboard. Whats new Dashboard : There is an easy access dashboard for all your needs. Multi-timeframe button : There is now a multi-timeframe option for Order Blocks and Supply and demand zones, making it easy to see higher timeframe zones easily on the current timeframe by just clicking the desired timefr
    Представляем наш новый индикатор: [ON Trade Breakout Zone] Простой, но мощный инструмент анализа рынка для всех трейдеров! Подходит как для профессионалов, так и для начинающих трейдеров. Готовы улучшить свою торговую стратегию? Наш новый индикатор создан для упрощения анализа рынка и дает возможность трейдерам всех уровней. Будь вы опытным профи или только начинаете, [ON Trade Breakout Zone] - ваш ключ к раскрытию потенциальной прибыли на рынке. Как использовать [ON Trade Breakout Z
    С этим продуктом покупают
    FX Volume
    Daniel Stein
    4.58 (33)
    Получите истинное преимущество на Forex с помощью FX Volume: Лучший индикатор объема FX Volume - это первый и единственный индикатор объема, который показывает истинное настроение рынка с точки зрения инсайдера. Предоставляя уникальную информацию о позиционировании институциональных участников рынка и брокеров, FX Volume позволяет вам торговать с такой прозорливостью, которая обычно присуща крупным игрокам. Попрощайтесь с задержками с отчетами COT - FX Volume предоставляет вам эту важную инфор
    TPSproTREND PrO
    Roman Podpora
    4.79 (19)
    TPSpro TREND PRO   —  трендовый индикатор, который автоматически анализирует рынок и предоставляет информацию о тренде и каждой его смене а также дающий сигналы для входа в сделки без перерисовки! Индикатор использует каждую свечу, анализируя их отдельно. относя к разным импульсам – импульс вверх или вниз. Точные точки входа в сделки  для  валют, крипты, металлов, акций, индексов! Version MT5           ПОЛНОЕ ОПИСАНИЕ ИНДИКАТОРА           Рекомендуем использовать с  индикатором -  RFI LEVELS
    MetaBands M4
    Vahidreza Heidar Gholami
    5 (3)
    MetaBands использует мощные и уникальные алгоритмы для построения каналов и обнаружения тенденций, чтобы предоставлять трейдерам потенциальные точки для входа и выхода из сделок. Это индикатор канала плюс мощный индикатор тенденций. Он включает различные типы каналов, которые могут быть объединены для создания новых каналов, просто используя параметры ввода. MetaBands использует все типы оповещений, чтобы уведомлять пользователей о событиях на рынке. Особенности Поддерживает большинство алгоритм
    Представляем       Quantum Breakout PRO   , новаторский индикатор MQL5, который меняет ваш способ торговли в зонах прорыва! Разработанная командой опытных трейдеров с опытом торговли более 13 лет,   Quantum Breakout PRO   предназначена для того, чтобы вывести ваше торговое путешествие на новые высоты благодаря своей инновационной и динамичной стратегии зон прорыва. Quantum Breakout Indicator покажет вам сигнальные стрелки на зонах прорыва с 5 целевыми зонами прибыли и предложением стоп-лос
    TrendMaestro
    Stefano Frisetti
    5 (3)
    note: this indicator is for METATRADER4, if you want the version for METATRADER5 this is the link:  https://www.mql5.com/it/market/product/108106 TRENDMAESTRO ver 2.4 TRENDMAESTRO recognizes a new TREND in the bud, he never makes mistakes. The certainty of identifying a new TREND is priceless. DESCRIPTION TRENDMAESTRO identifies a new TREND in the bud, this indicator examines the volatility, volumes and momentum to identify the moment in which there is an explosion of one or more of these data a
    Dynamic Forex28 Navigator — инструмент для торговли на рынке Форекс нового поколения. В НАСТОЯЩЕЕ ВРЕМЯ СКИДКА 49%. Dynamic Forex28 Navigator — это эволюция наших популярных индикаторов, объединяющая мощь трех в одном: Advanced Currency Strength28 Indicator (695 отзывов) + Advanced Currency IMPULSE with ALERT (520 отзывов) + CS28 Combo Signals (бонус). Подробности об индикаторе https://www.mql5.com/en/blogs/post/758844 Что предлагает индикатор Strength нового поколения?  Все, что вам нрав
    Инновационный индикатор, использующий эксклюзивный алгоритм для быстрого и точного определения тренда. Индикатор автоматически рассчитывает время открытия и закрытия позиций, а также подробную статистику работы индикатора на заданном отрезке истории, что позволяет выбрать наилучший торговый инструмент для торговли. Вы также можете подключить свои пользовательские стрелочные индикаторы к Scalper Inside Pro для проверки и расчета их статистики и прибыльности. Scalper Inside PRO (версии 6.5 и выше)
    В настоящее время скидка 20%! Лучшее решение для новичка или трейдера-эксперта! Эта приборная панель работает на 28 валютных парах. Он основан на 2 наших основных индикаторах (Advanced Currency Strength 28 и Advanced Currency Impulse). Он дает отличный обзор всего рынка Forex. Он показывает значения Advanced Currency Strength, скорость движения валюты и сигналы для 28 пар Forex на всех (9) таймфреймах. Представьте, как улучшится ваша торговля, когда вы сможете наблюдать за всем рынком с пом
    Важным ключевым элементом в трейдинге являются зоны или уровни, от которых принимаются решения о покупке или продаже торгового инструмента. Несмотря на попытки крупных игроков скрыть свое присутствие на рынке, они неизбежно оставляют следы. Наша задача заключалась в том, чтобы научиться находить эти следы и правильно их интерпретировать. INSTRUCTIONS     RUS   -    ENG                    Рекомендуем использовать с индикатором -   TPSpro  TREND PRO -  Version MT5 Основные функции: Отображения ак
    Connect Indicator
    Sukunthakan Ngernbamrung
    Connect Indicator is a tool used for connecting indicators between the MQL market and MT4. The connected indicators are made by our group and can be used for other applications, such as sending messages to the Line application or Telegram application. If you have any questions, please don't hesitate to ask us to receive support. Function and indicator buffer Buffer one is the high price of the previous candle. Buffer two is the high price of the previous candle. Usage To connect indicators to fu
    Алерты в виде стрелок на вход: Индикатор находит точки входа и уведомляет о них с помощью мобильных или обычных алертов Ключевые особенности: Консервативный режим . Один сигнал на вход на каждое направление. Идеально подходит для долгосрочных трейдеров. Агрессивный режим . Многочисленные сигналы на вход в одном направлении. Идеально подходит для активных трейдеров, стремящихся захватить несколько движений внутри одного тренда. Уровень срабатывания . Ценовая линия входа сокращает число ложных сиг
    В настоящее время скидка 20%! Эта приборная панель - очень мощное программное обеспечение, работающее на нескольких символах и до 9 таймфреймов. Он основан на нашем основном индикаторе (Лучшие отзывы: Advanced Supply Demand ).   Приборная панель дает отличный обзор. Она показывает:  Отфильтрованные значения спроса и предложения, включая рейтинг силы зон, расстояния между пунктами в зонах и внутри зон, Выделяются вложенные зоны, Выдает 4 вида предупреждений для выбранных символов на всех (9)
    ПОЖАЛУЙСТА, ПРОЧТИТЕ ИНФОРМАЦИЮ НИЖЕ ПЕРЕД ПОКУПКОЙ! Apollo Pips PLUS SP – уникальный продукт! ЭТО ДЛЯ ТЕХ, КТО ХОЧЕТ ПОЛУЧИТЬ МОЙ НОВЫЙ ИНДИКАТОР «APOLLO PIPS» + БОНУС «SUPER PACK» С ДОСТУПОМ КО ВСЕМ МОИМ ТОРГОВЫМ ИНДИКАТОРАМ! Покупая продукт Apollo Pips PLUS SP, вы фактически приобретаете абсолютно новую версию моего индикатора Apollo Pips. Эта версия индикатора имеет улучшенный алгоритм и простой в использовании параметр, который дает вам возможность использовать индикатор на любом рынке и в
    The AT Forex Indicator MT4 is a sophisticated trading tool designed to provide traders with a comprehensive analysis of multiple currency pairs. This   powerful indicator   simplifies the complex nature of the forex market, making it accessible for both novice and experienced traders. AT Forex Indicator uses   advanced algorithms   to detect trends, patterns and is an essential tool for traders aiming to enhance their forex trading performance. With its robust features, ease of use, and reliabl
    Currently Price 20% OFF ( for unlimited use )   BONUS  AUX VIP Club 2024 : Include  EA Airbag  and  Load Data History  to enhance the performance of this tool to its maximum potential  Click Here to Download Files   ( for users only )   Hello World! Introducing.. SMCpro VIP tool and Indicator for MetaTrader 4, designed to revolutionize your trading experience with the ICT Smart Money Concept. This system is meticulously crafted to empower traders with advanced insights and precision in
    Индикатор LineMagnit для MT4 - высокоточный индикатор, который строит уровни поддержки и сопротивления, притягивающие к себе цену по принципу магнита. Это позволяет трейдеру легко определить наиболее вероятные точки входа и выхода из рынка, а также определить направление сил в рынке так как уровни строятся на основе вливаний капитала в инструмент. Индикатор LineMagnit   оснащен интуитивно понятным графическим интерфейсом, который позволяет быстро находить и анализировать уровни поддержки и сопро
    TheStrat Monitor
    Robert Gerald Wood
    3 (2)
    If you've not already learnt about The Strat trading strategy , go google it now. I promise it won't be a waste of your time, and you will likely learn some new tricks whether you use it or not. OK, so now you know what TheStrat is, you will be able to understand what this indicator can do for you. Key Features In short, the Indicator will: Show Timeframe Continuity for all supported timeframes Supports two timeset views, Day trader and Swing trader Show when Full Timeframe Continuity is in pl
    Трендовый индикатор Reincarnations используют для определения силы и направления тренда и нахождения точек разворота цены. Данный инструмент сканирует рынок в поиске корректного входа. Вы можете сами посмотреть и оценить его, возможно он подойдет вам по ряду задач связанных с прогнозированием ценового движения. Для расчета точек входа использует только данные цены и аналитику. Не использует вспомогательных индикаторов. Для настройки имеет два параметра.  Настройка индикатора. Interval - интер
    Устали от построения линий поддержки и сопротивления? Сопротивление поддержки - это мульти-таймфреймовый индикатор, который автоматически обнаруживает и отображает линии поддержки и сопротивления на графике с очень интересным поворотом: поскольку ценовые уровни тестируются с течением времени и его важность возрастает, линии становятся более толстыми и темными. [ Руководство по установке | Руководство по обновлению | Устранение неполадок | FAQ | Все продукты ] Повысьте технический анализ в одноч
    Enigmera
    Ivan Stefanov
    5 (3)
    ЭНИГМЕРА: ядро рынка https://www.enigmera.com Введение Этот индикатор и торговая система представляют собой удивительный подход к финансовым рынкам. ENIGMERA использует фрактальные циклы для точного расчета уровней поддержки и сопротивления. Он показывает подлинную фазу накопления и дает направление и цели.  Система, которая работает независимо от того, находимся ли мы в тренде или в коррекции.  Как она работает? ENIGMERA состоит из трех линий: линии поддержки/сопротивления, линии цели и ли
    Ultimate Gold Advisor для MetaTrader 4 Ultimate Gold Advisor — это продвинутый технологический инструмент, созданный для оптимизации торгового процесса на MetaTrader 4. Разработанный для удовлетворения потребностей опытных трейдеров, этот индикатор сочетает точность, сложный анализ и многофункциональность, предоставляя поддержку для принятия обоснованных торговых решений. Идеально подходит для торговли золотом, но также применим к широкому спектру активов. Ultimate Gold Advisor может помочь вам
    Advanced version of CyberZingFx Volume Plus, the ultimate MT4 indicator for traders seeking highly accurate buy and sell signals. With an additional strategy and price action dot signals that enhances its effectiveness, this indicator offers a superior trading experience for professionals and beginners alike. The CyberZingFx Volume Plus Advanced version combines the power of volume analysis and historical price data with an additional strategy, resulting in even more precise and reliable signals
    В НАСТОЯЩЕЕ ВРЕМЯ СКИДКА 20%! Лучшее решение для новичка или трейдера-эксперта! Этот индикатор специализирован для отображения силы валюты для любых символов, таких как экзотические пары, товары, индексы или фьючерсы. Впервые в своем роде, любой символ может быть добавлен в 9-ю строку, чтобы показать истинную силу валюты золота, серебра, нефти, DAX, US30, MXN, TRY, CNH и т.д. Это уникальный, высококачественный и доступный торговый инструмент, потому что мы включили в него ряд собственных функци
    PZ Day Trading
    PZ TRADING SLU
    3.67 (3)
    Этот индикатор обнаруживает разворот цены зигзагообразно, используя только анализ ценового действия и канал Дончиана. Он был специально разработан для краткосрочной торговли, без перекраски или перекраски вообще. Это фантастический инструмент для проницательных трейдеров, стремящихся увеличить сроки своих операций. [ Руководство по установке | Руководство по обновлению | Устранение неполадок | FAQ | Все продукты ] Удивительно легко торговать Это обеспечивает ценность на каждом таймфрейме Ре
    NAM Order Blocks
    NAM TECH GROUP, CORP.
    5 (1)
    Индикатор обнаружения блоков ордеров мультитаймфреймов MT4. Функции - Полностью настраиваемая панель управления графиком, обеспечивает полное взаимодействие. - Скрыть и показать панель управления где угодно. - Обнаружение OB на нескольких таймфреймах. - Выберите количество OB для отображения. - Различные пользовательские интерфейсы OB. - Различные фильтры по OB. - Оповещение о близости OB. - Линии ADR High и Low. - Служба уведомлений (Экранные оповещения | Push-уведомления).
    Руководство пользователя + Обучающие видео + Доступ к приватному Discord-каналу + VIP-статус и мобильная версия + Лицензия на 5 ПК с неограниченным количеством аккаунтов и терминалов MT4. Сколько раз вы покупали индикатор торговли с замечательными обратными тестами, доказательствами производительности на живых счетах и зашикарными цифрами и статистикой, но после использования на своем счете вы оказываетесь с пустым счетом? Не следует доверять сигналу в отрыве от контекста, вам нужно знать, по
    The Stochastic Basket Currency Strenght  brings the Stochastic indicator to a new level.  Expanding the boundaries of TimeFrames and mono-currency analysis, the SBCS take the movements of each currency that composes the cross and confront them in the whole basket of 7 crosses.  The indicator works with any combination of AUD, CAD, CHF, EUR, GBP, JPY, NZD, USD pairs and with full automation takes in account every stochastic value (main line) for the selected Time Frame.  After that, the indicator
    Представляем ON Trade Waves Patterns Harmonic Elliot Wolfe, передовой индикатор, разработанный для обнаружения разнообразных рыночных паттернов с использованием как ручных, так и автоматизированных методов. Вот как это работает: Гармонические паттерны: Этот индикатор может определять гармонические паттерны, появляющиеся на вашем графике. Эти паттерны важны для трейдеров, практикующих теорию гармонической торговли, как это описано в книге Скотта Карни "Гармоническая Торговля том 1 и 2". Независи
    Gold Channel is a volatility-based indicator, developed with a specific timing algorithm for the XAUUSD pair, which consists of finding possible corrections in the market. This indicator shows two outer lines, an inner line (retracement line) and an arrow sign, where the theory of the channel is to help identify overbought and oversold conditions in the market. The market price will generally fall between the boundaries of the channel. If prices touch or move outside the channel it is a tra
    Представляем       Индикатор Quantum Trend Sniper   , инновационный индикатор MQL5, который меняет способ определения разворотов тренда и торговли ими! Разработан командой опытных трейдеров со стажем торговли более 13 лет,       Снайперский индикатор Quantum Trend       разработан, чтобы вывести ваше торговое путешествие на новые высоты благодаря инновационному способу определения разворотов тренда с чрезвычайно высокой точностью. ***Купите индикатор Quantum Trend Sniper и получите индикатор
    Другие продукты этого автора
    It works based on the Stochastic Indicator algorithm. Very useful for trading with high-low or OverSold/Overbought swing strategies. StochSignal will show a buy arrow if the two lines have crossed in the OverSold area and sell arrows if the two lines have crossed in the Overbought area. You can put the Stochastic Indicator on the chart with the same parameters as this StochSignal Indicator to understand more clearly how it works. This indicator is equipped with the following parameters: Inputs d
    FREE
    It identifies the pivot, support, and resistance price levels of the selected timeframe and then draws lines onto the chart. FEATURES: Option to specify the Timeframe Period in the PivotSR calculation. Option to display the PivotSR of the last candle, of every candle, or of the current candle. Options for displaying labels, line thickness, and line color. PivotSR can be interpreted as reversal levels or past price reactions that can be used as the basis for current price analysis. Some traders b
    FREE
    It is a custom non-repaint indicator to identify trade opportunities in swing action as prices move within an upper and lower band. Inspired by the Keltner Channel, the most popular channel Indicator introduced by Chester Keltner. It is different with a Bollinger Bands. It represents volatility using the high and low prices, while Bollinger's studies rely on the standard deviation. The algorithm for this indicator is also available in the EntryMaximator EA. Including the option to use it or not.
    FREE
    All in one Indicator. Multiple market analysis tools. Non-Repaint Oscillator signals, Trend lines, Price channel, Fibonacci levels, Support and Resistance, Regression, Pivot levels, Candle Strength and Oversold/Overbought line detector. Includes buttons to hide or show. Advanced algorithms to detect important reversal points and draw trend lines or shapes automatically in appropriate areas. A simple and professional chart display, user friendly and easier to understand for faster and accurately
    Профессиональный торговый индикатор с возможностью двойного входа. Ценные Гладкие Линии Канала в отдельном окне, Линии Тренда как в главном окне, так и отдельное окно и стрелки входа. Подходит для скальпинга на младших таймфреймах. Также он может работать и давать сигналы на старших таймфреймах для более длительных торговых периодов. НАСТРОЙКИ ИНДИКАТОРА: 1. Сигнальный режим. Есть 2 варианта: Стандартный и Компактный. Если выбрано значение по умолчанию, в главном окне будут отображаться 3 р
    Provides Regression Channel on the current chart. Combined by Trend of Moving Averages and Multi timeframes Oscillator Indicators: CCI, RSI, Stochastic, and MACD with specific working logic . It could make us easier to identify swing high-low as an entry point, the retracement area while following the current trend. Consists of 2 types of signal, main and secondary. The main signal will draw very clearly triangle and lines on the chart with the word " BUY" or 'SELL'. and the secondary is the sta
    MACD Scanner provides the multi symbols and multi-timeframes of MACD signals. It is useful for trader to find the trading idea quickly and easily. User-friendly, visually clean, colorful, and readable. Dynamic dashboard display that can be adjusted thru the external input settings. Total Timeframes and Total symbols as well as the desired total rows/panel, so it can maximize the efficiency of using the chart space. The Highlight Stars on the certain matrix boxes line based on the selected Scan M
    MACD Scanner provides the multi symbols and multi-timeframes of MACD signals. It is useful for trader to find the trading idea quickly and easily. User-friendly, visually clean, colorful, and readable. Dynamic dashboard display that can be adjusted thru the external input settings. Total Timeframes and Total symbols as well as the desired total rows/panel, so it can maximize the efficiency of using the chart space. The Highlight Stars on the certain matrix boxes line based on the selected Scan M
    GOLDEN RETRACEMENT POWER indicator draws fibonacci levels automatically. Defines the golden entry buy/sell area, support and resistant lines , signals arrows and strength 'Power Bars Level' based on price action . Some indicators also work behind the chart: Stochastic,RSI,MFI,DeMarker and WPR . Fibonacci retracements are a popular form of technical analysis used by traders in order to predict future potential prices in the financial markets. If used correctly, Fibonacci retracements and ratios c
    It is an expert advisor that scans the last patterns on defined symbols and timeframes . Multi Symbols /pairs , Multi timeframes .  There are 2 ways to specify symbols : Automatically scan all symbols available on the market watch (true/false) Type any symbols ,separated by comma.   There are also 2 ways to specify timeframes : Automatically scan all timeframes available on mt4 (true/false) Type any timeframes,separated by comma.   Unlimited symbols available in an account and unlimited timefr
    Non-repaint indicator    to identify trade opportunities in swing action as prices move within an upper and lower band. Inspired by the Keltner Channel, the most popular channel Indicator introduced by Chester Keltner. It is different with a Bollinger Bands. It represents volatility using the high and low prices, while Bollinger's studies rely on the standard deviation. Customized by adding the trends exactly in the middle line, arrows when price cross over the outer lines and Fibonacci Levels L
    This is the countdown of the last candle Indicator. How much time remains in the current candle of your chart CTime display exactly how many hours, minutes and seconds remain before the current candle closes, and a new one opens. This allows you to be on the ball as soon as the next candle appears It could be useful for a trader who trades with candles as the main attention Available option to change the text color to suit the chart background. This Indicator is related to the system here .
    FREE
    Индикатор основан на множестве EMA. Идея состоит в легком отображении нескольких экспоненциальных скользящих средних на одном гнрафике, без необходимости добавлять их по отдельности. В индикатор также встроена линия тренда: она синяя при растущем тренде и красная при падающем тренде. Цвета линий можно поменять в настройках индикатора. В индикаторе 2 внешних параметра. Это параметры периода и сдвига. При их изменении (период и/или сдвиг), остальные параметры подстраиваются автоматически. Подходит
    Индикатор Range Multi Alligators отображает информацию о максимуме и минимуме канала диапазона, а также о тренде, который рисуется в центре канала в виде гистограммы красного и синего цвета. Линии канала диапазона позволяют определять уровни стоп-лосс и тейк-профит. Это трендовый индикатор на основе использования нескольких "Аллигаторов". Запустите индикатор на графике и настройте один или все параметры, при этом все линии будут перемещаться синхронно. Описание настраиваемых параметров Period
    Индикатор стохастических свечей Он преобразует стохастический индикатор из отдельного окна в окно графика, рисуя раскрашенные перекупленные свечи. Красный перекуплен, а синий перепродан по умолчанию. Позже вы можете изменить цвет в настройке внешнего индикатора. Это индикатор мульти таймфрейма, который означает, что он может показывать результат появления с другого таймфрейма. Например: если вы установите таймфрейм H1, он будет отображаться свечи с таймфрейма H1 на любой таймфрейм Это будет
    Autobot Retracement Code (ARC) A robot trading that works based on retracement strategy while following the market trend.It has  made average profits up to 25% /month that is relatively a High Return of Investment.Real Account proof. Fully automation. Auto Lot sizing, Auto TakeProfit Calculation, Auto StopLoss Calculation. Currently Running on Real account , it has more than 100% growth / 5 months. NEW UPDATE RELEASED, VERSION 3.0  FEATURES on Version 3: FIFO rules Auto LotSize Auto StopLoss
    Order Management EA (OME). The software will manage your trades based on 2 options: Magic Number or Order Comment. Both the Trades from the other EA or from Manual Trading. Drawing Stop Loss/Take Profit, Close All the positions, manages Multiple Orders, determining grid range and entry signals automatically.  Sending Martingale Orders, if necessary, that can be turn off/on. Including 2 options lot calculation: Multiplication or Addition.  You install OME in your account, you place order, and it
    Strategy – Bollinger Band, Moving Average and Price Actions. Bollinger Bands to identify High-Low Price, Moving Average to identify Trend and Price Action is to synchronize both of them.  SardaFx 4.1 has average holding time 24 hours (1 day) on timeframe H1. It is not a Martingale EA or Averaging EA. The work is simple, BUY and Exit or SELL and Exit. No recurring BUY and or SELL in the same time and the same symbol except you adjust Max BUY/SELL  more than 1,default setting is 1 BUY and 1 SELL.
    Some informations on the chart with the single attachment. RangeBorder Buy Sell (RBBS) Non Repaint Indicator will provide trend line, buy sell arrows,reversal arrows, range channel, order exit area,high average price line and low average price line.All arrows and lines don't repaint and not lagging. Once candle closed it won't  repaint. Reading Indicator: 1. Small Stars , Indicates oversold and overbought with certain logic and price may reverse when this small star triggers. Useful to identif
    Oversold and Overbought Candles, Trendlines, and BUY-SELL arrows in the single Indicator. Built from 8 default MT4 Indicators. Stochastic,RSI,SAR,CCI,RVI,DeMarker,WPR and MA. It is " NON REPAINT " indicator. All buffers do not repaint.  Double Trendline buffers that can also be used to identify sideway market and support resistance area.  Any timeframes and any currency pairs. Parameters: Show Trend . TRUE/FALSE to show trendlines on the chart Follow Trend. If TRUE , Dapitrend will show on
    TrendWavePattern  an another way to trade with a harmonic pattern, a maestro classic pattern . I made some improvements and combinations with my own strategy. Trend direction, buy-sell signal ,hi-low area and pivot line. These will be helpful for trader to read the current market condition. So it is not blindly following the pattern itself but also following other informations from the market. Readable chart appearance . Designed to be user friendly even you are a new trader. BUY-SELL zone, Ta
    This is MT4 version of StochScanner It scans Stochastic from Multi Symbols and Multi Timeframes and displayed on the dashboard on a single chart. . 4 scanning modes: 1. Mode OverBought/OverSold Indicator scans Overbought and OverSold . OverBought : current stochastic is above level 80 and OverSold : current stochastic is below level 20 2. Mode Signal It means if the previous stochastic is on OverBought or OverSold ( either Main Line and Signal Line ) and the current Main Line cross over the curr
    Lemurian Trader is a multi symbols  EA/robot. User can input symbols in the external parameter separated by comma. Only need to place on the single chart, no need to open multiple chart,no limited symbols as long the symbol is available on the market watch. Sweeping signals from timeframe M15 to H4 on each symbol to find the best high/low price while it also keeps to follow the trend. Lower TF M15 as a signal and higher(M30,H1,H4) to indentify trend and high low. It means whatever timeframe we p
    RSI Scanner Plus Indicator scans RSI values in multiple symbols and timeframes. Plus trend line buffer on the chart.  Features: -Trend Line :  We add trend line on the chart in the hope it help you to see current trend on the chart while following oversold and overbought  from RSI. This is additional feature in the indicator. We consider that following the trend is very important in trading. -Changeable Panel Display :  Change the value of Max.Symbols/Panel and  the indicator will adjust the d
    TrendScanner XTra scans market trends from Multi Symbols and Multi Timeframes with extra additional Entry Point Signals arrow on the current chart. Features: -Entry Point SIgnals :  This is additional feature in the indicator. No repaint arrows. The Trading system in the single indicator. MTF Trend informations and Entry Signals. In order to make it easier for trader to get trading moments from a single chart and  deciding entry time.  -Changeable Panel Display :  Change the value of Max.Symbo
    PullbackMatrix provides the key information of the trading transactions when it finds the right market moment based on its built-in logic algorithm. The high accuracy signals including Trading Symbol, Entry Price, Entry Time, TakeProfit, Stoploss, and more. And that's all will be available instantly in your chart panel, drawing the position lines and also sending signal notification to email, mobile phone, and screen popup. More important is that also saves signals into a .csv file which is usef
    It could help to calculate Risk-Reward easily before placing a BUY-SELL position. TradeSizeCalculator is a Multi-Tasking Calculator. It will calculate the others when we define the value in one of the columns. Stoploss, risk percentage, risk-money, lot size, take-profit , reward-money, and reward-ratio. Depending on which value is changed. All values in the columns are editable. Also, we can get those calculation results by drag-drop the stop-loss/take-profit line. Parameter: The inputs below ar
    It has 3 capabilities at once and can be adjusted according to needs. Full Auto, Semi-Auto, or Warning Signals only. You can choose it by setting the parameters provided. Built to help Traders work much easier than doing it manually. Sharpen the accuracy of market analysis performed by a Trader by only executing in certain price areas and adjustable signal parameters. Features Ability to manage trading management, including automatically determining stop loss/take profit, calculating lot size ba
    GU Spot is a One Shot One Kill EA. A  Scalping EA   for GBPUSD .   No Martingale, No Averaging, No Grid or other high-risk strategies.  Working with up to the best 100 trading signals algorithm from various Trading Systems. The combination of Price Action, High Low, Trend, Range Levels, Pullback /  Retracement and Reversal. This is Fully Automatic Trading Robot . High Accuracy Entry Signals and protected by a proper Money Management. A tight Stop Loss with SL:TP ratio 1:3 by default, Trailing an
    SignalPinner is a trend line Indicator which can detect market trends early by including three types of signal arrows. Non repaint and trend following. Signals on the strong trend, signals in the beginning of trend and signals with multiple market analysis algorithm as the main signals. Supported by alert notification message to keep you getting signals while on the go. Symbols: Any Timeframes: Any Features Histogram buffers as a sign the trend is started. It can help the trader knowing the ma
    Фильтр:
    cam028
    6027
    cam028 2024.10.05 09:47 
     

    its been a while with no response to a question about a indicator I bought

    Ответ на отзыв
    Версия 1.4 2023.12.28
    Improvement for signal description