Liquidity Flow
- Индикаторы
- Pavel Milicka
- Версия: 1.2
- Обновлено: 1 января 2024
- Активации: 5
Market Profile, Volume Profile? Extra paid in TradingView, displayed for the last moment in time or discreetly, e.g. after 24 hours. Counting super-accurate values from a histogram...?
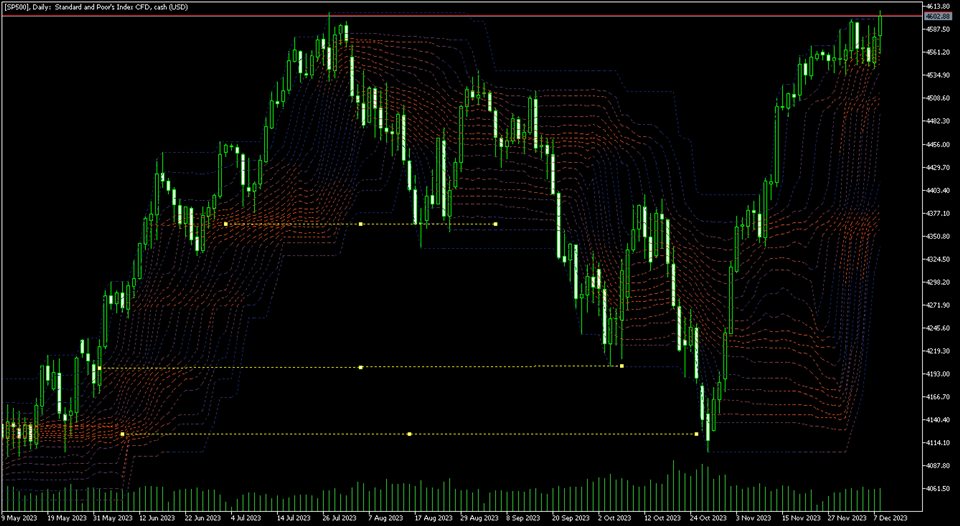
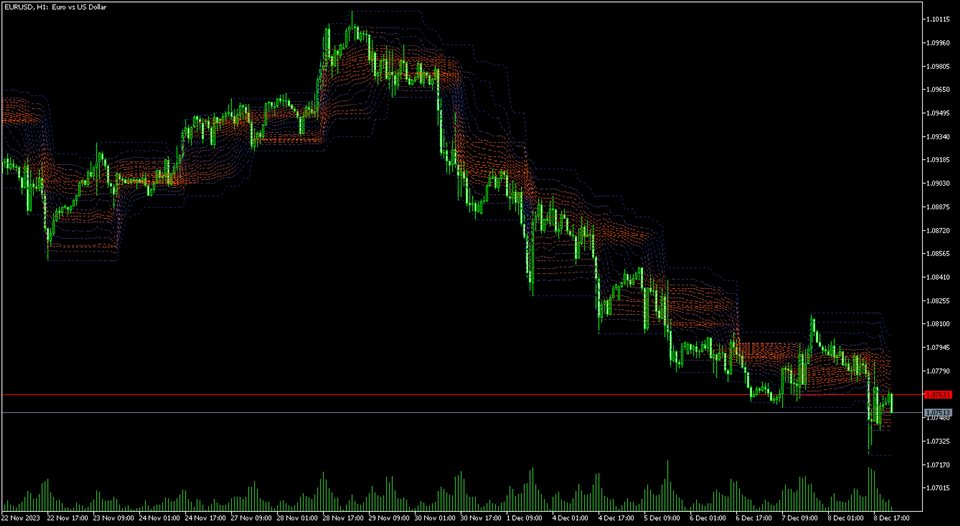
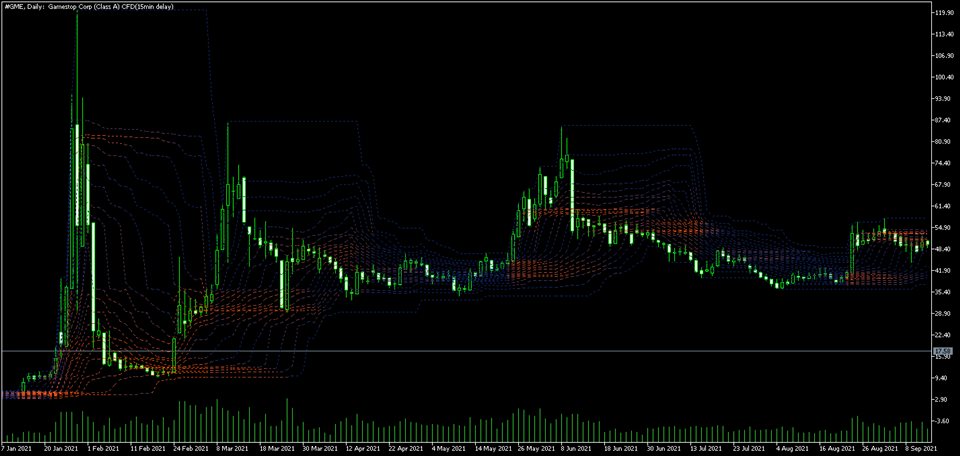
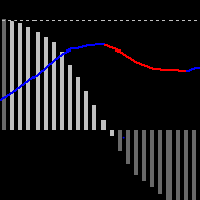
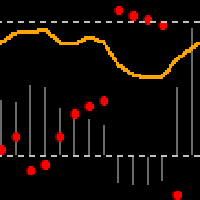
None of these ways suited me. I was looking for an expression of the dynamics of the market, its liquidity, I just wanted to clearly see where the money was flowing. I thought I would calculate the volume weighted price percentiles for a certain period.
To make the calculation more accurate, I calculate from a lower timeframe. That is, to be more precise, two degrees lower. So, with the H1 timeframe set, I load candles from M15. I believe this detail balances sufficient accuracy on the one hand and speed on the other. Speed, i.e. loading historical data in this detail, tends to be a problem. Be patient, jump to surrounding timeframes. Loading will speed up. It will keep the data loaded once with MT5 and it will be better next time.
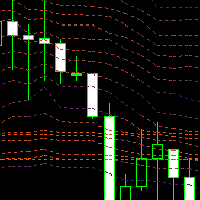
The similarity with the Volume profile is that where the histogram has higher values, the quantiles - liquidity streams - are closer together. I highlight it in color for a quick overview.
There is a lot of information about Volume Profile, Smart Money and the like. You will use everything.
Free JPY version: https://www.mql5.com/en/market/product/110785
