Trend Harmony MTF Trend and Phase Visualizer MT4
- Индикаторы
- Andras Salamon
- Версия: 1.4
- Обновлено: 31 января 2024
- Активации: 5
TREND HARMONY MT4 – Multi Timeframe Trend and Phase and Pullback Level Visualizer indicator for Metatrader4
The TREND HARMONY indicator automates deep trend analysis and generates visualizations for you. Take control of your trades by eliminating uncertainty! Revolutionize your trading experience with precision and insight through the TREND HARMONY Multi Timeframe Trend Indicator – your ultimate MT4 trend visualization indicator.
Are you tired of missing trading opportunities or consistently entering the market at the wrong time, resulting in missed profits or feeling overwhelmed by market complexities? Look no further – the TREND HARMONY MTF Trend & Phase Visualizer indicator is here to enhance your trading experience!
Unlock the potential of your trading journey with the TREND HARMONY MTF Trend & Phase Visualizer indicator, a tool designed to support both novice and seasoned traders. By simultaneously analyzing 6 different timeframes, this indicator helps navigate various trend phases of a given instrument.
[ Features and Manual | MT5 version | All Products ]
Key features:
· Multi-Timeframe Analysis:
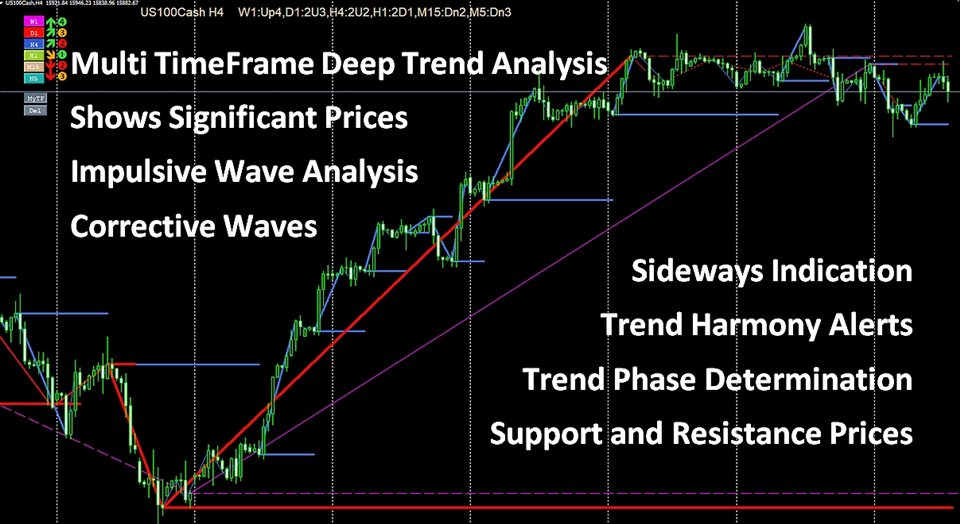
Analyze your chosen instrument effortlessly across 6 different timeframes simultaneously, from M5 to W1 (or as per your settings). Gain a holistic view of market trends, empowering well-informed decision-making and optimizing trading focus.
· Trend Identification:
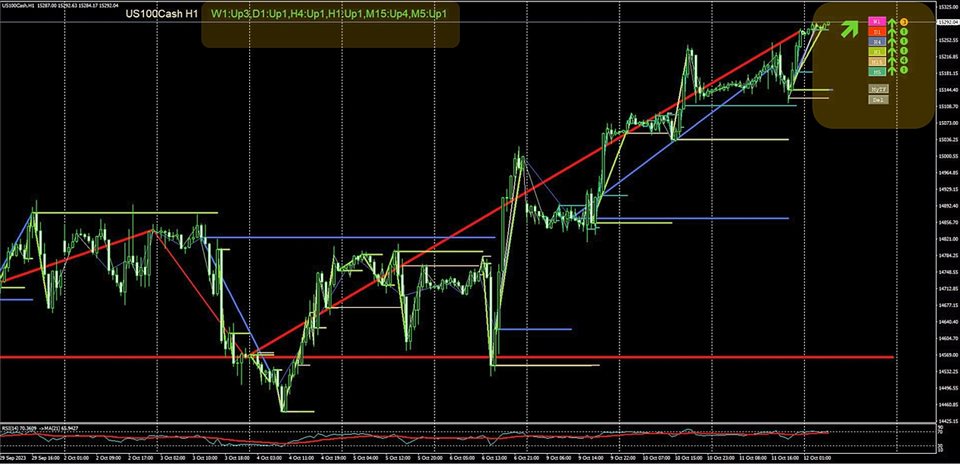
Our advanced algorithm accurately identifies and illustrates trend waves. Visualize market trends in unprecedented detail, enabling you to ride the waves of success.
· Trend Phase Determination:
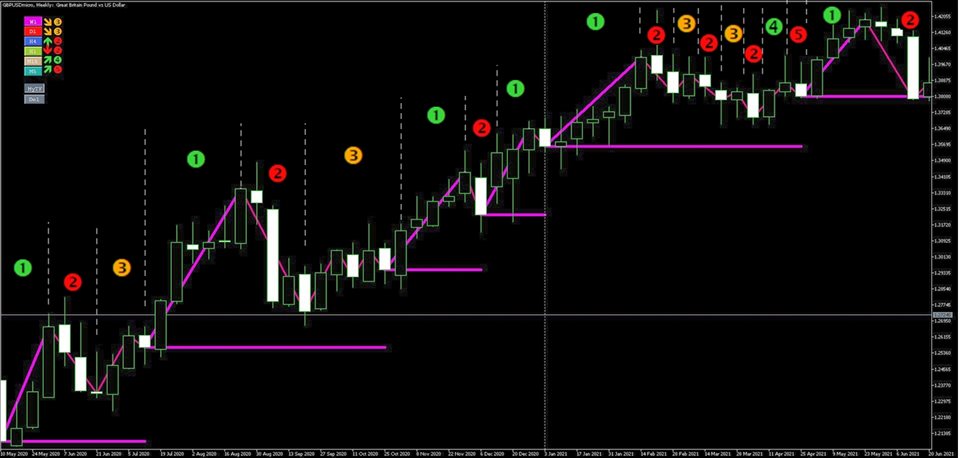
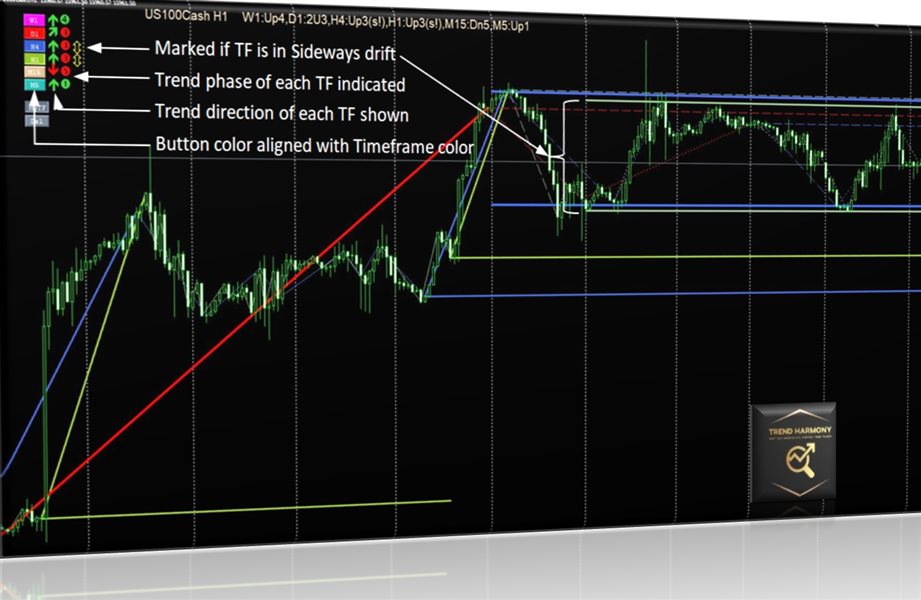
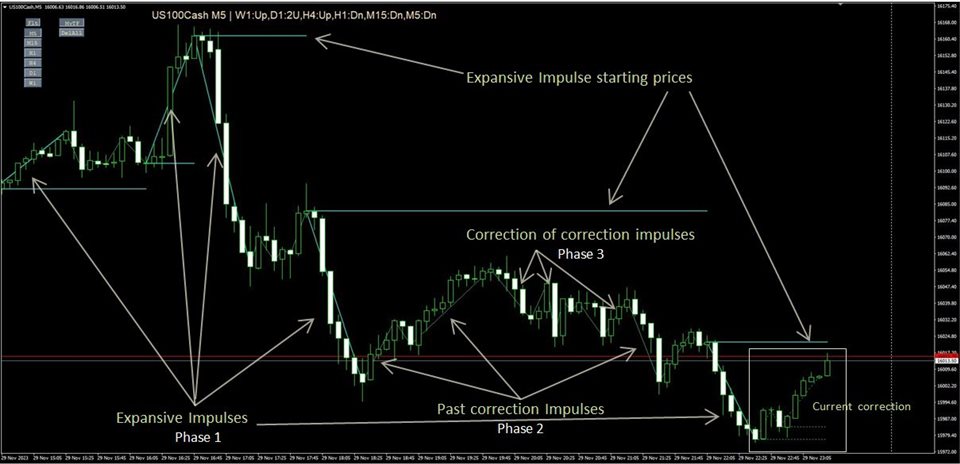
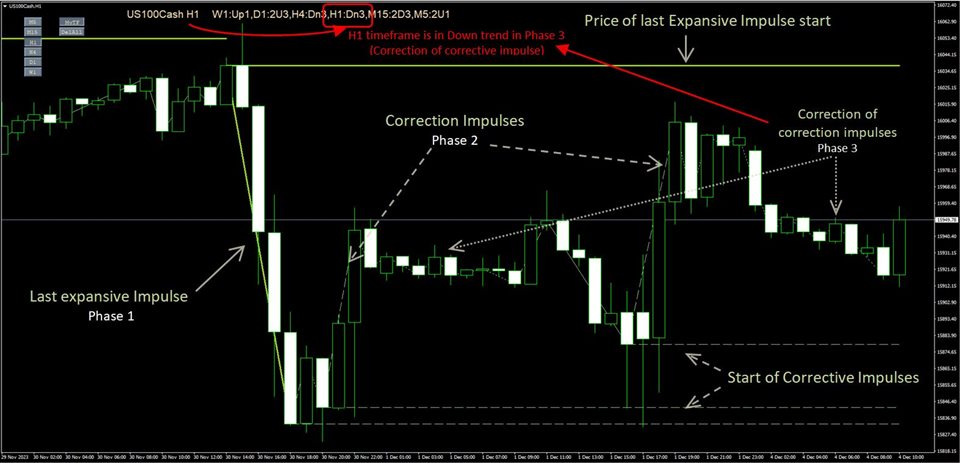
Easily determine the trend phases of a specific instrument by analyzing 6 timeframes simultaneously, allowing strategic adaptation. Clearly differentiate between impulsive and corrective phases, enhancing understanding of market dynamics.
· Sideways Signalization:
The indicator signals when the market enters a Sideways phase, preventing you from entering trades when it's best to stay on the sidelines.
· Filtering of False breakout and fake trend changes:
You can set flexible threshold for filtering out false breakouts and fake trend changes, By cleaning out such "noises" you can see and trust well established trends better.
· Signals if TrendHarmony is formed or ended:
The indicator displays arrows and sends notifications when all timeframes are in the same direction and in expansive or trend continuation phase.
· Indication of retarcement levels while waves forming:
You can efforlessly identify retracement (support/resistance) levels in corrective waves, in trend reversal phases and in case of trend changes.
How TREND HARMONY Multi Timeframe Trend & Phase Visualizer Empowers You
Time-Saving: Streamline your analysis process by viewing trends across multiple timeframes at a glance. The indicator works on any trading instrument and timeframe.
Historical Reference Lines: Highlights prices of past expansive impulsive start points on each timeframe with thick horizontal lines, serving as strong support or resistance levels. Enhance decision-making by leveraging historical reference lines and projecting trend continuations.
Trend Continuation Projection: Anticipate trend continuation by identifying trend reversals during correction phases.
Trend Change Signals: signals potential trend changes when current price surpasses the initiation points of the existing expansion on each timeframe.
Adaptability: Tailor your strategy to the current market phase, ensuring you're always one step ahead.
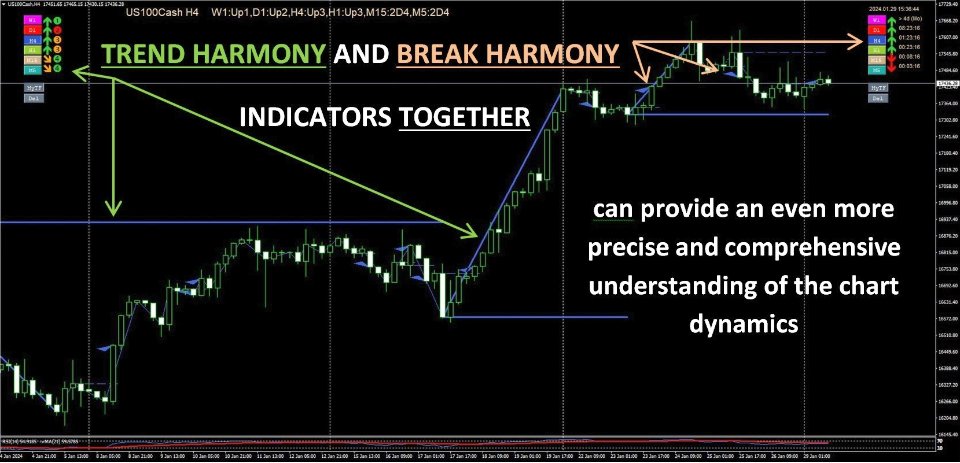
By combining the Trend Harmony indicator with the Break Harmony indicator, traders can attain an even more precise and comprehensive understanding of the chart dynamics. The Trend Harmony indicator, with its ability to identify and emphasize prevailing trends across multiple timeframes, works synergistically with the Break Harmony indicator's capacity to pinpoint breakout and breakdown points. Together, these indicators create a holistic view of the market, integrating trend analysis with breakout signals.
As the Trend Harmony indicator highlights the overarching market direction, the Break Harmony indicator complements this information by identifying critical points where significant price movements are likely to occur. The synergy between the two indicators enables traders to align their strategies with both the broader trend and potential breakout opportunities.
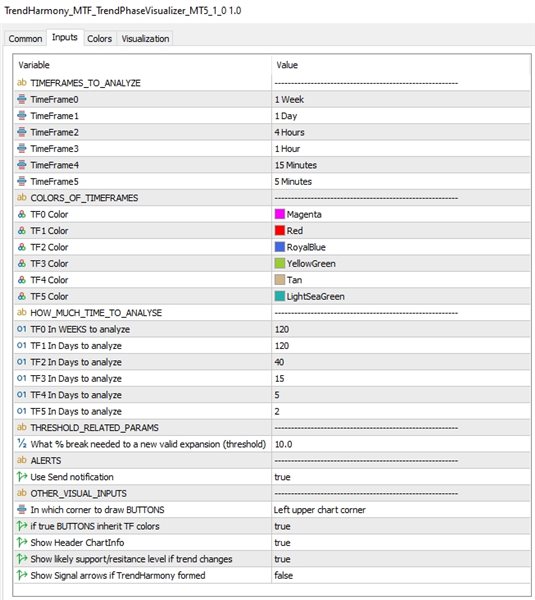
**For proper operation please make sure historical data is downloaded for every timeframe or reduce analyzed period (at HOW_MUCH_TIME_TO_ANALYSE inputs)!**
NOTE: TREND HARMONY MT4 - MTF Trend & Phase Visualizer is compatible with MetaTrader 4 and is designed to enhance, not replace, your trading strategy. Trade responsibly.
For MT5 Version: Click here.
For more detail please Click here.
Thank you!

