• Обзор
  • Отзывы
  • Обсуждение

KT Supply and Demand MT4

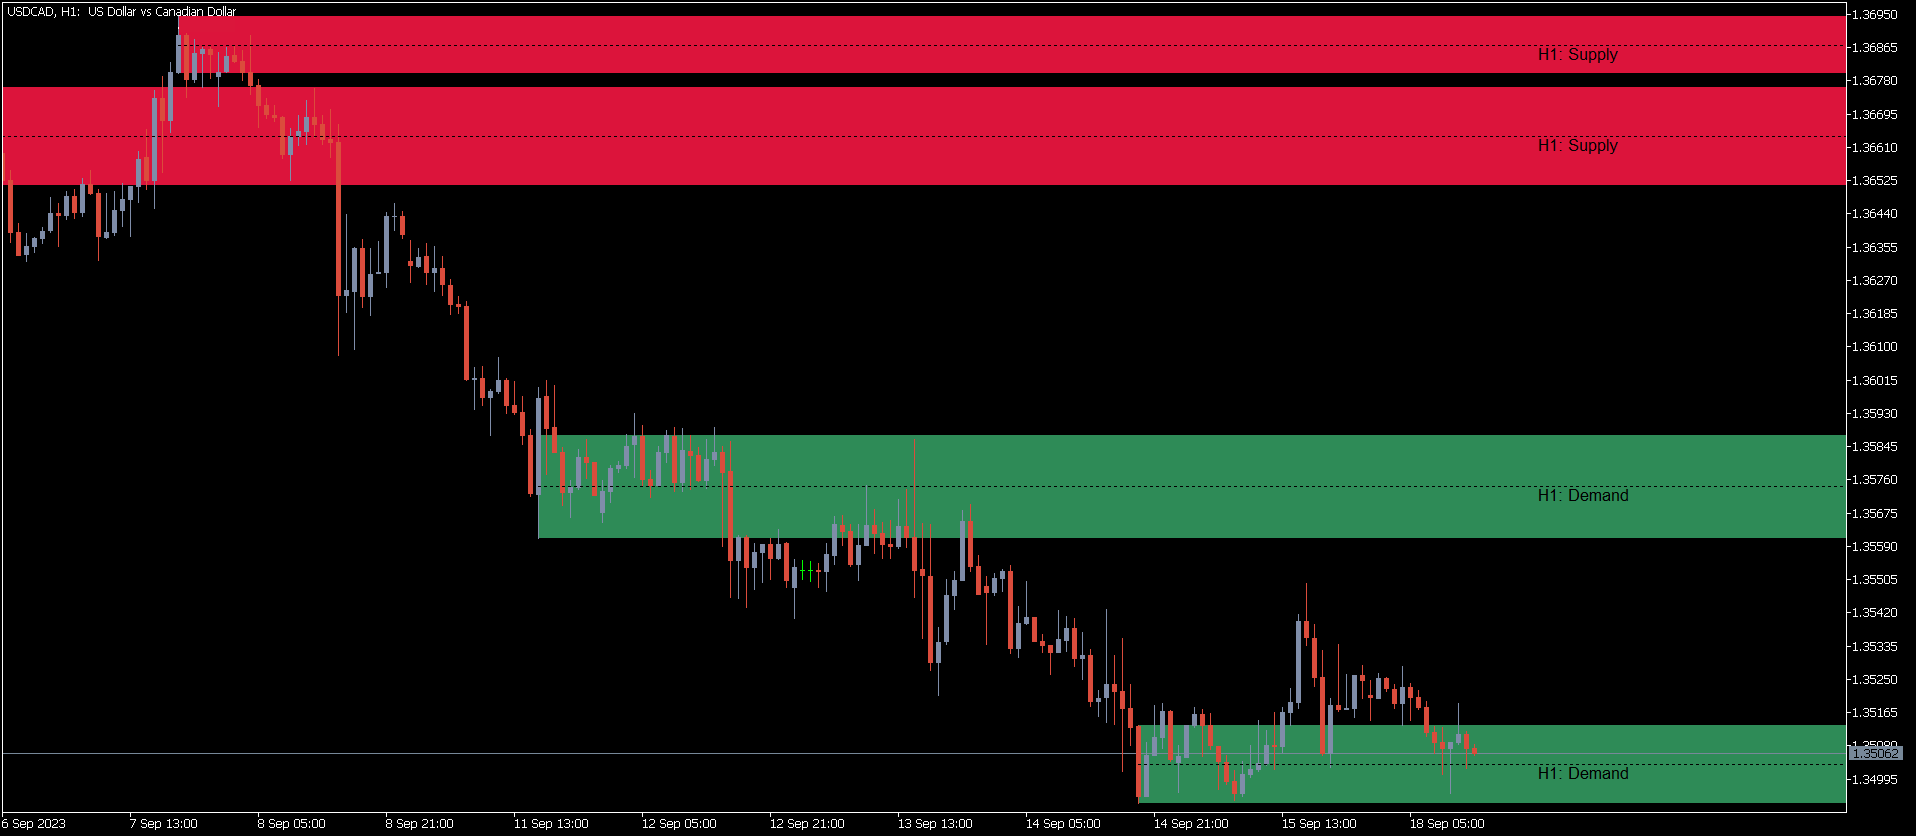
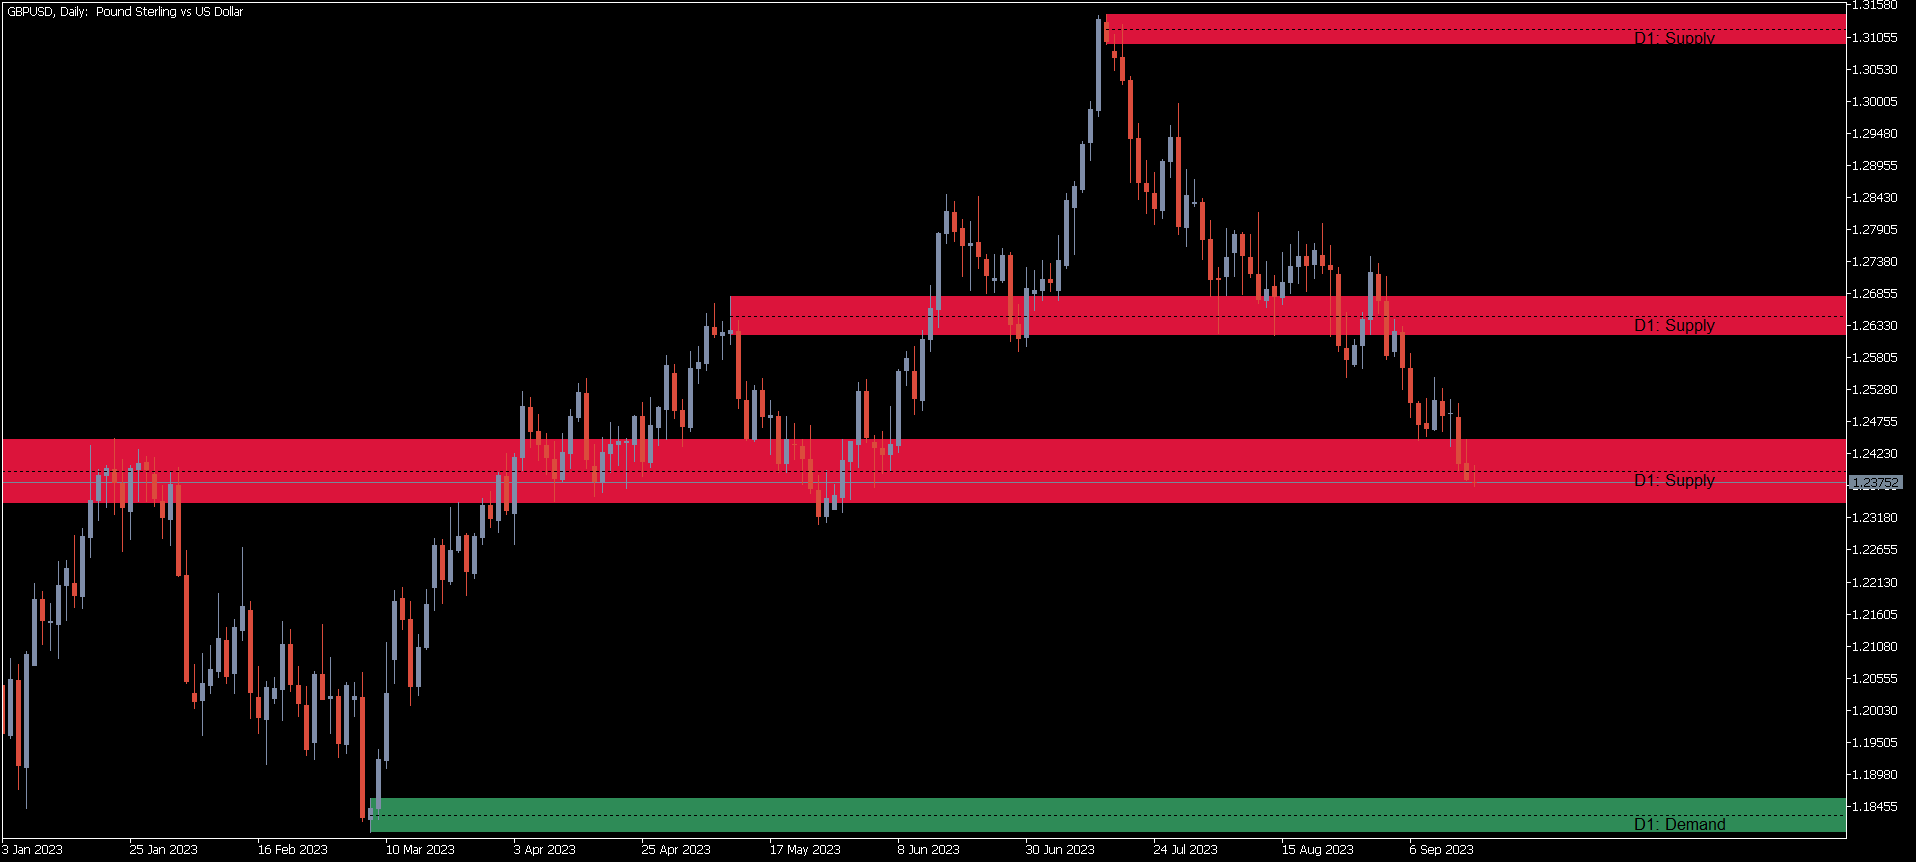
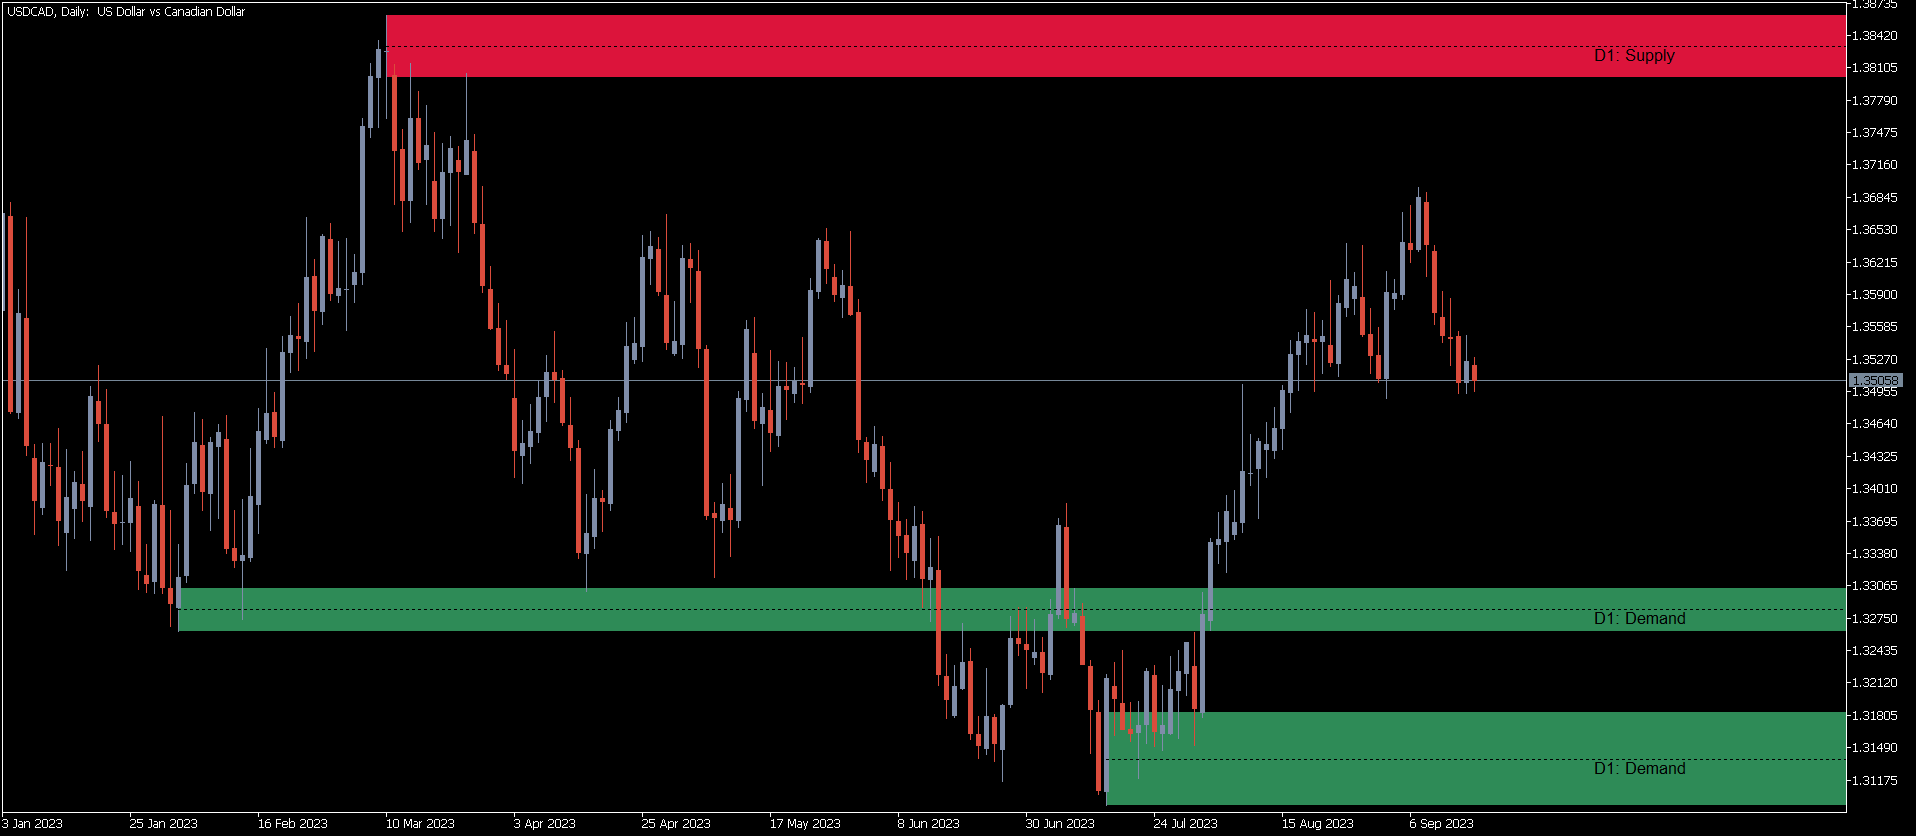
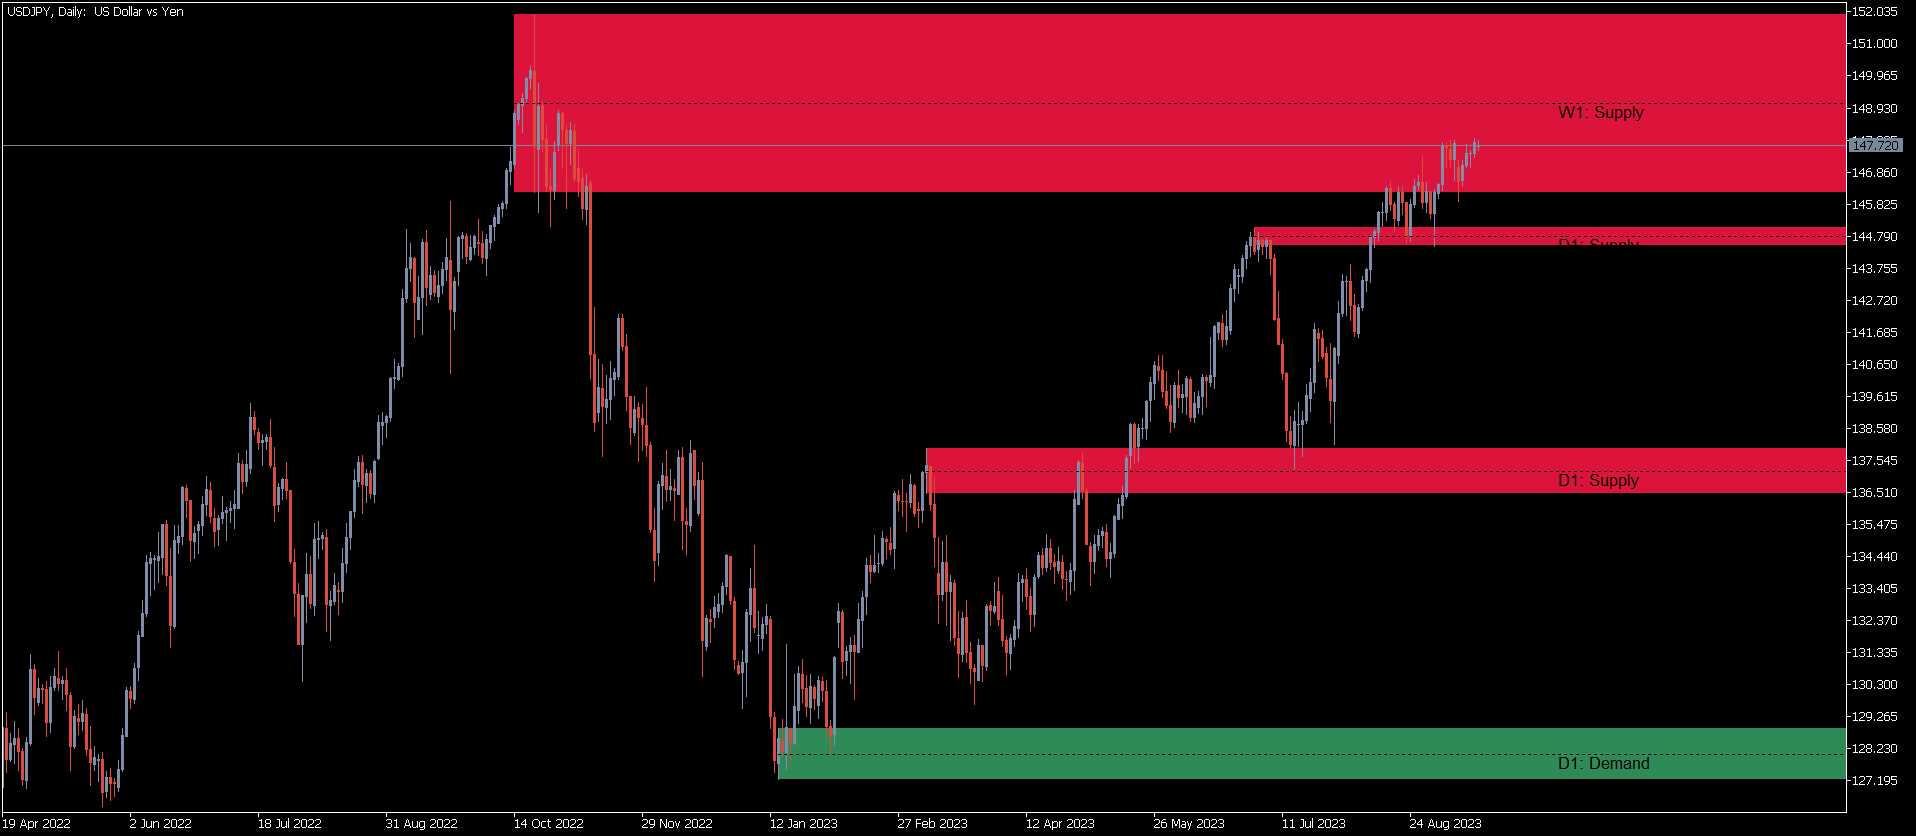
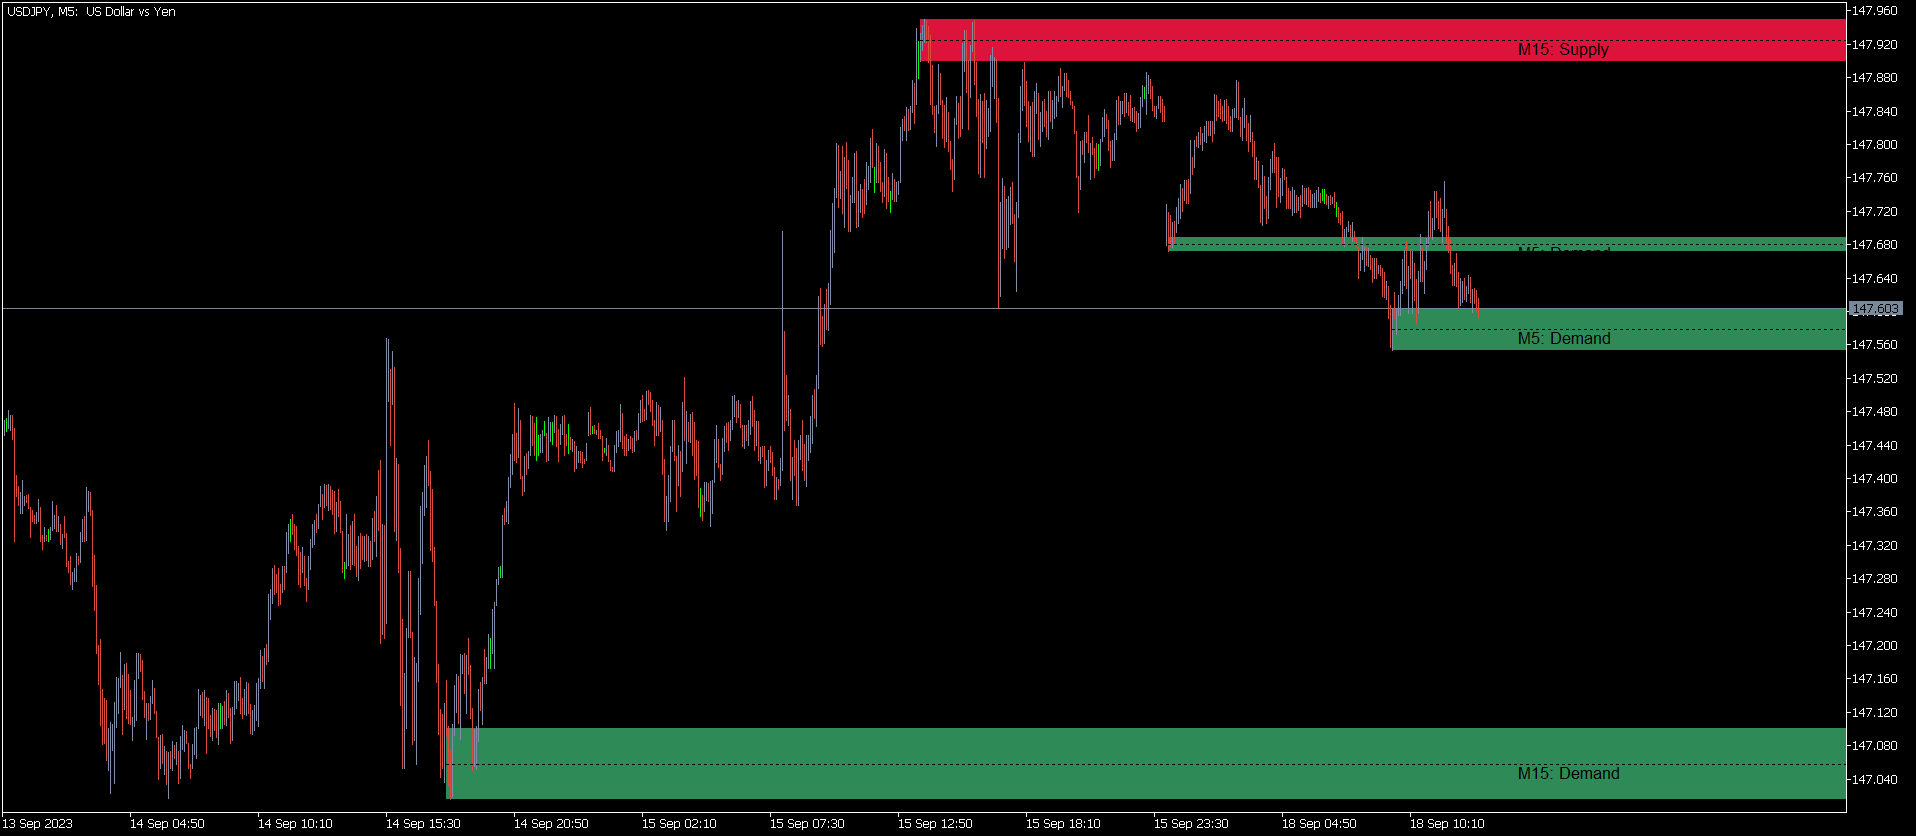
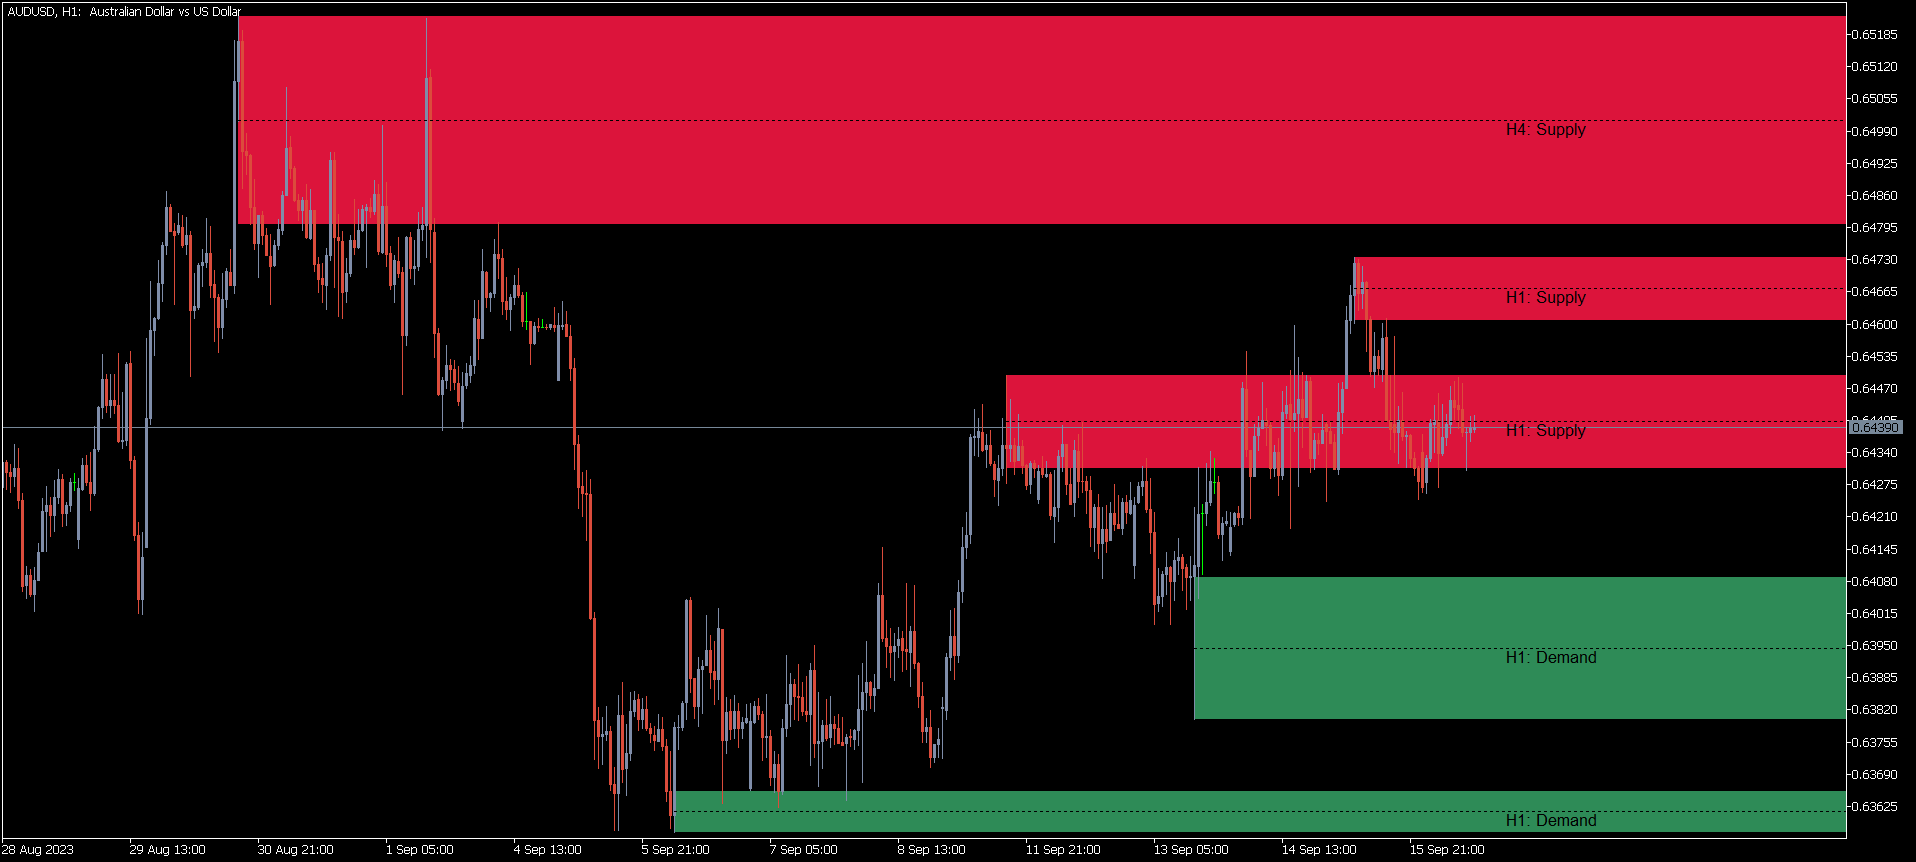
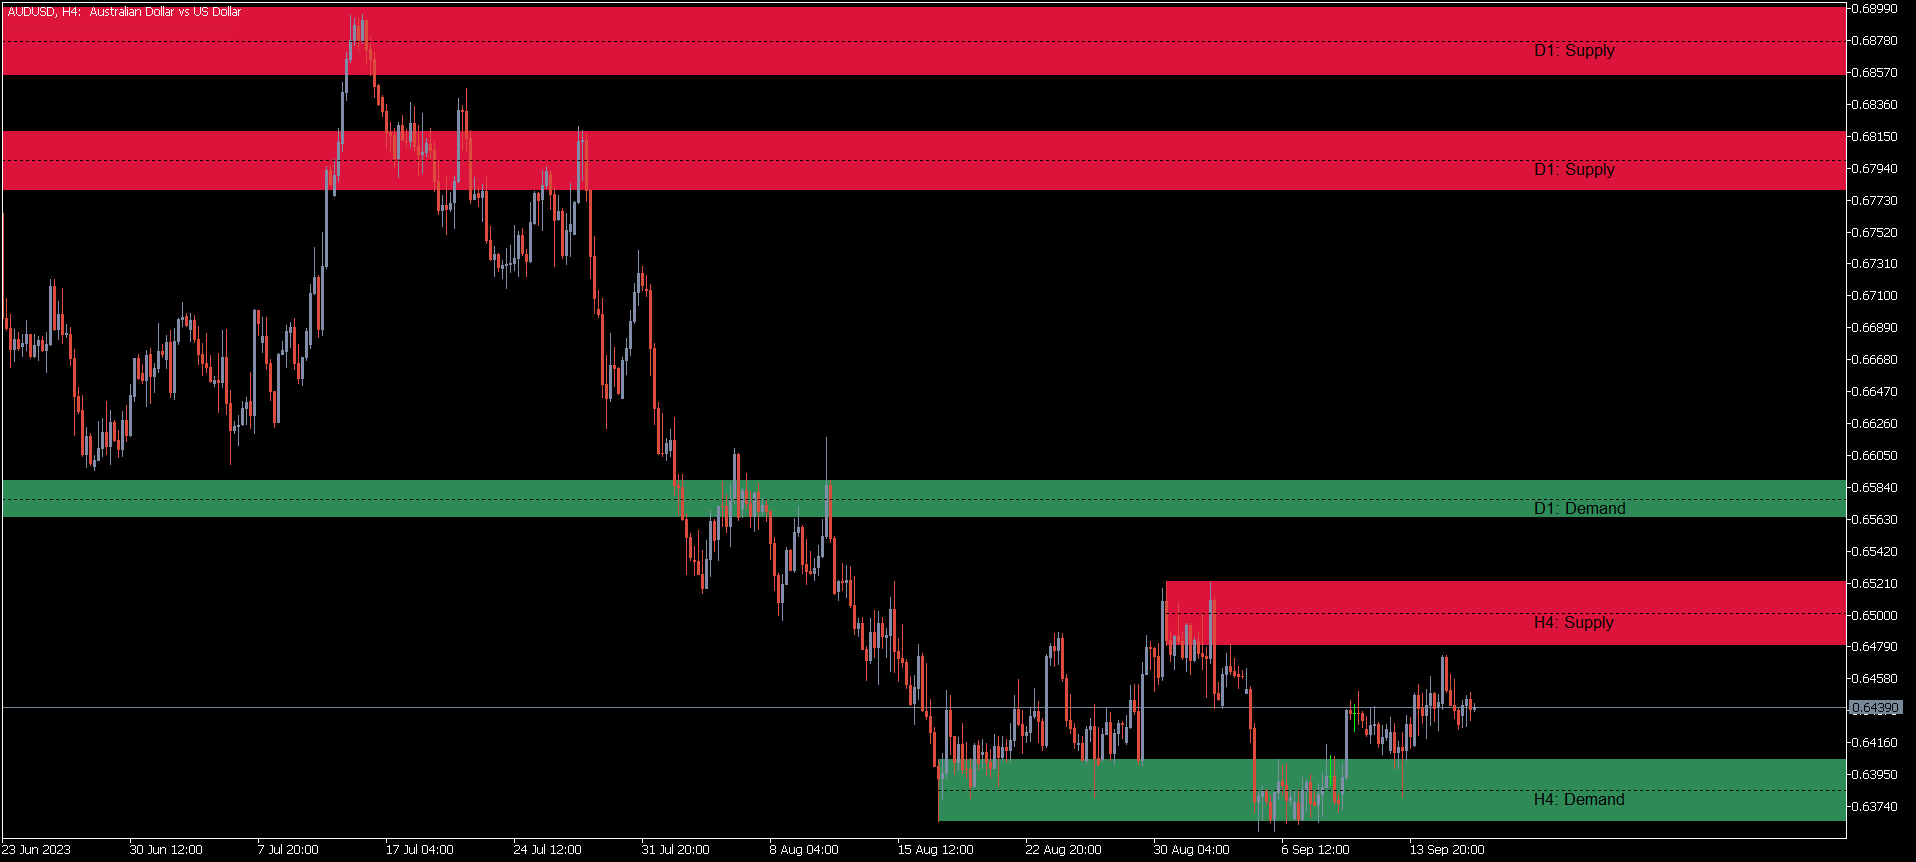
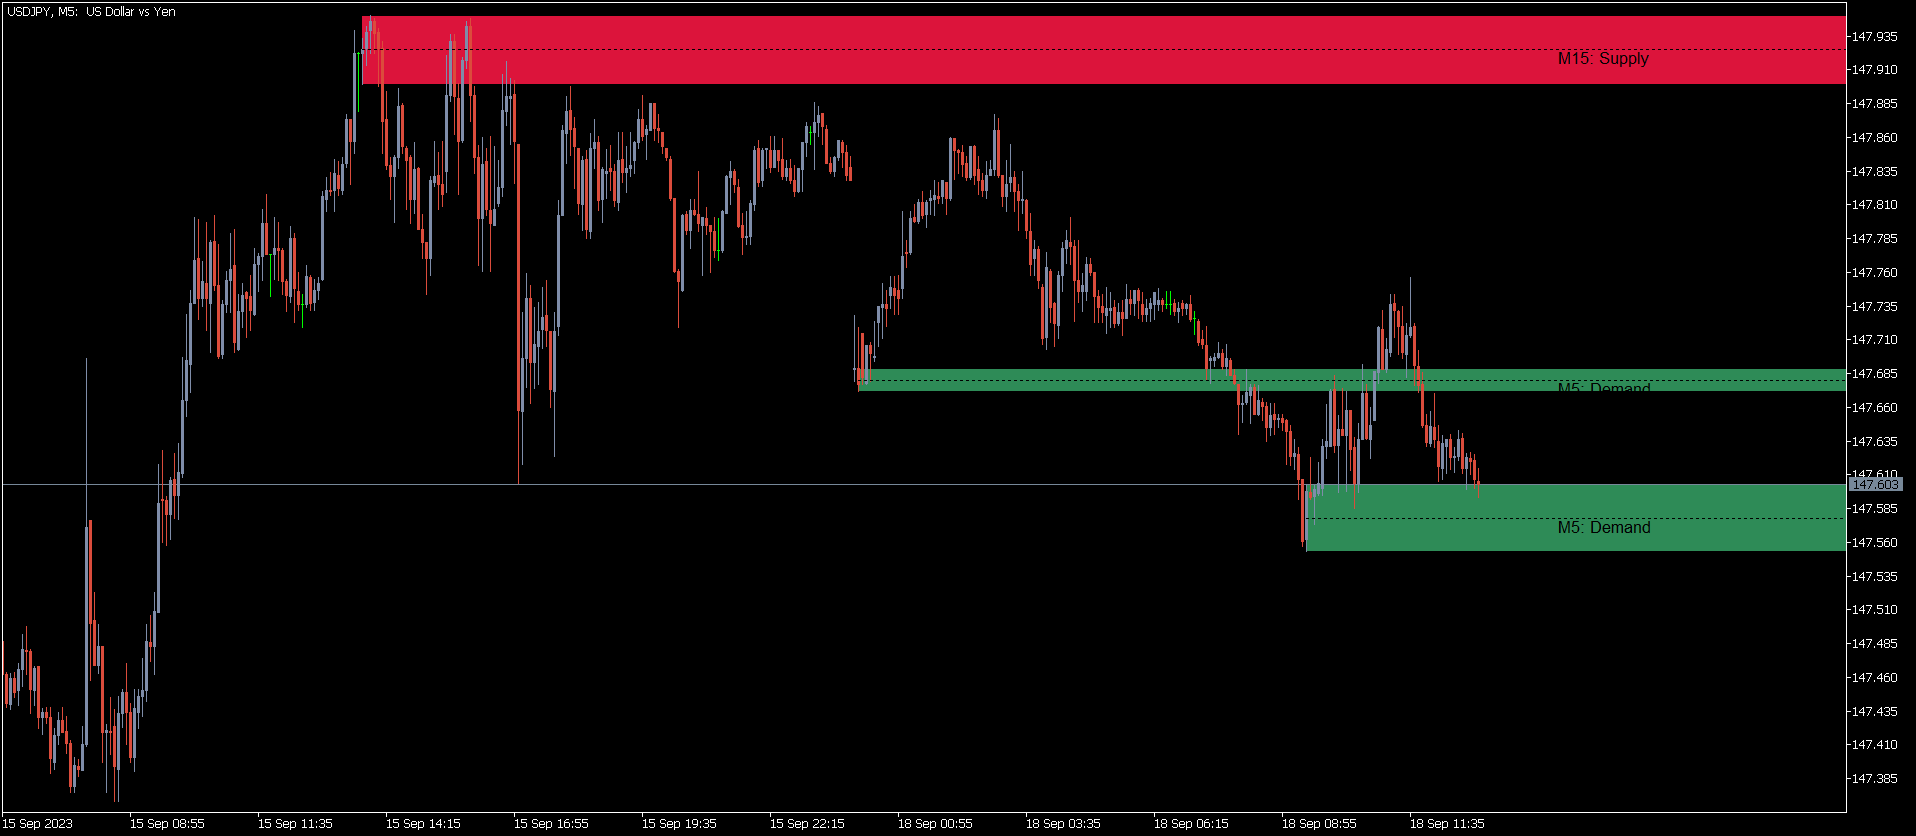
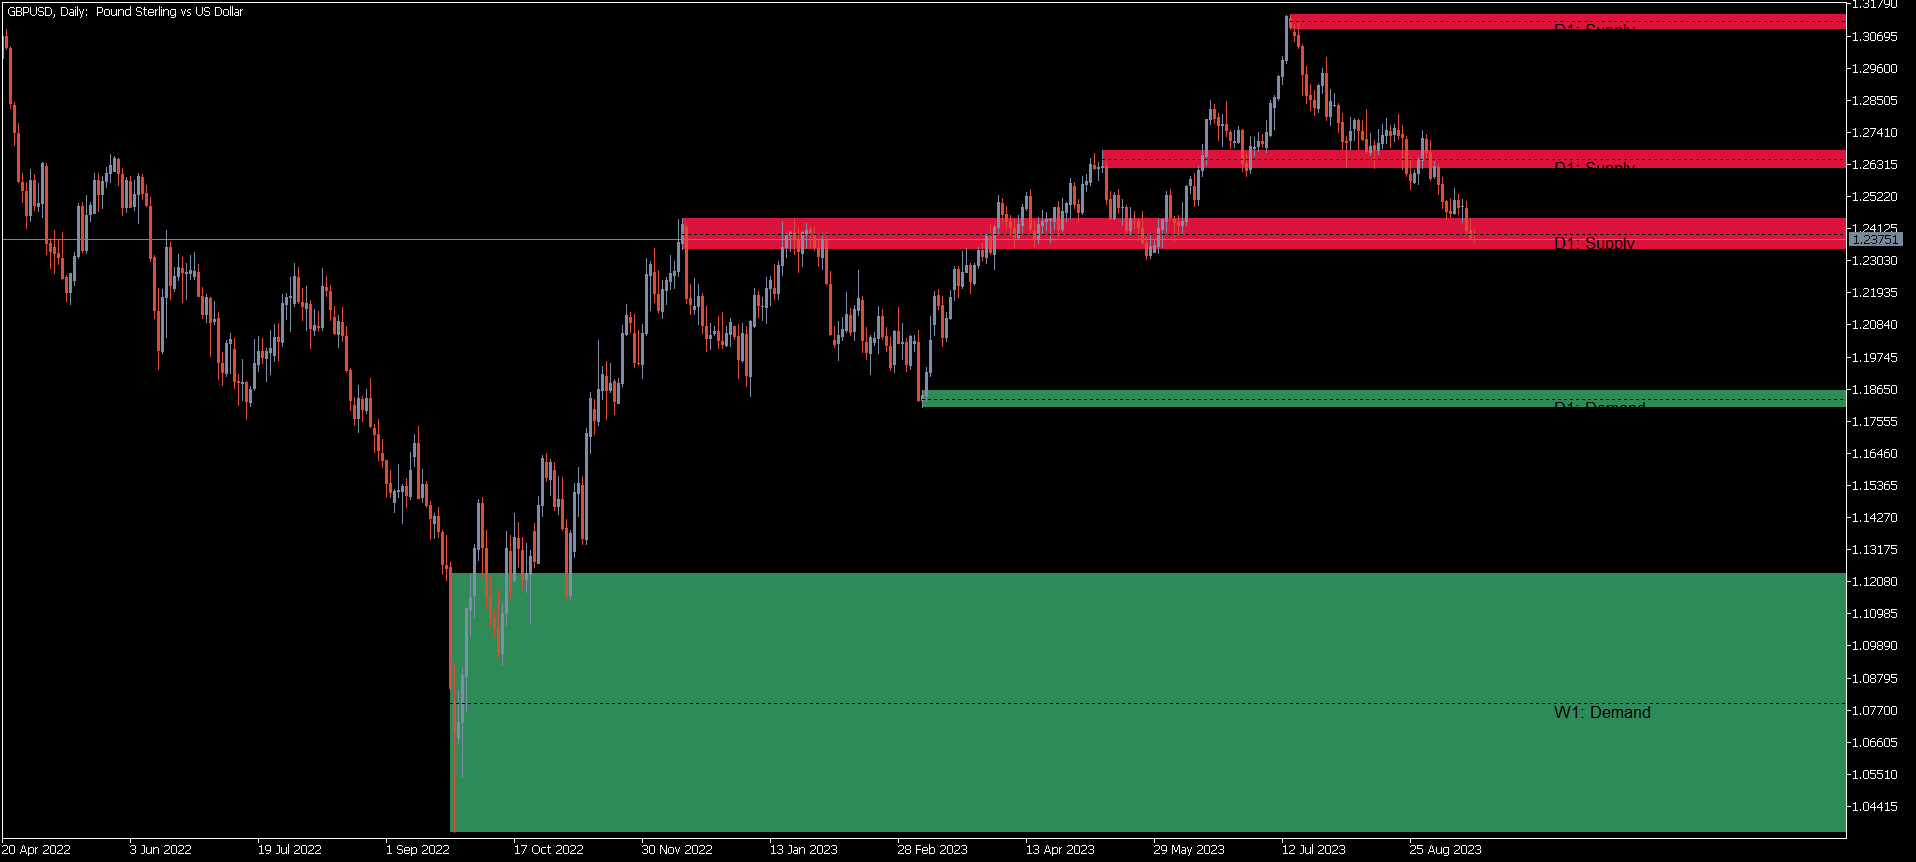
KT Supply and Demand indicator identifies and plots key supply and demand zones. It achieves this by analyzing swing points and integrating them with a multi-timeframe analysis, ensuring that only the most crucial supply-demand zones are highlighted.

This advanced method highlights the regions where prices are likely to reverse, stemming from significant supply-demand zones established by recent price movements.

Features

  • Precision Analysis: Our refined algorithm is designed to accurately pinpoint the most crucial supply and demand zones, areas often indicative of major price shifts.
  • Complete Market Insight: Showcases supply and demand zones from up to three timeframes, giving traders a thorough market view through multi-timeframe scrutiny.
  • Uncluttered Visualization: Ensures your chart remains neat and interpretable by smartly avoiding any overlap of supply and demand zones, thereby reducing potential distractions.
  • Integrated Chart Setup: It is complemented by a preset chart template that meshes perfectly with the indicator's features, enhancing your visual analysis.
  • Predictive Power: Features a distinctive marking within each zone, acting as a hint for traders to foresee potential price reversals originating from these regions.
  • Adaptive Coloring: Grants the ability to fluidly alter the colors of supply and demand zones, resonating with the ongoing price movements.
  • Personalized Adjustments: Offers users a wealth of customization capabilities, from zone intensity to color choices and thickness, making sure it caters to every individual's style.
  • Active Notifications: Comes with a range of alerting mechanisms, such as on-screen prompts, mobile messages, email alerts, and auditory signals, all of which activate as the price nears a supply or demand zone.

Applications

Mastering Trade Precision and Timing: Harness the power of this indicator to navigate pivotal areas on charts, pinpointing where prices may experience significant shifts. Moreover, with our indicator's timely alerts, traders can refine their trade entry and exit decisions, ensuring optimal execution and perfect timing.

Strengthening Technical Analysis: The clearly demarcated supply and demand zones not only serve as invaluable reference points but also bolster the identification of crucial support and resistance levels. This dual advantage aids in determining stop-loss placements, profit target settings, and predicting potential breakouts, especially when there's a pronounced imbalance between buyers and sellers.

Elevating Risk and Trade Management: Our indicator provides insights that are indispensable for risk strategy refinement. Recognizing zones teeming with buying or selling activity allows traders to fine-tune their risk parameters and cut through the market noise. This clarity ensures that traders can focus on opportunities aligning with prominent supply or demand areas.

Enriching Diverse Trading Strategies: Whether you're a trend-focused trader or a swing trader, our indicator complements your approach. Paired with trend analysis, it points out zones in harmony with the prevailing trend. For swing traders, understanding supply and demand dynamics enhances the predictability and profitability of short to mid-term price fluctuations.
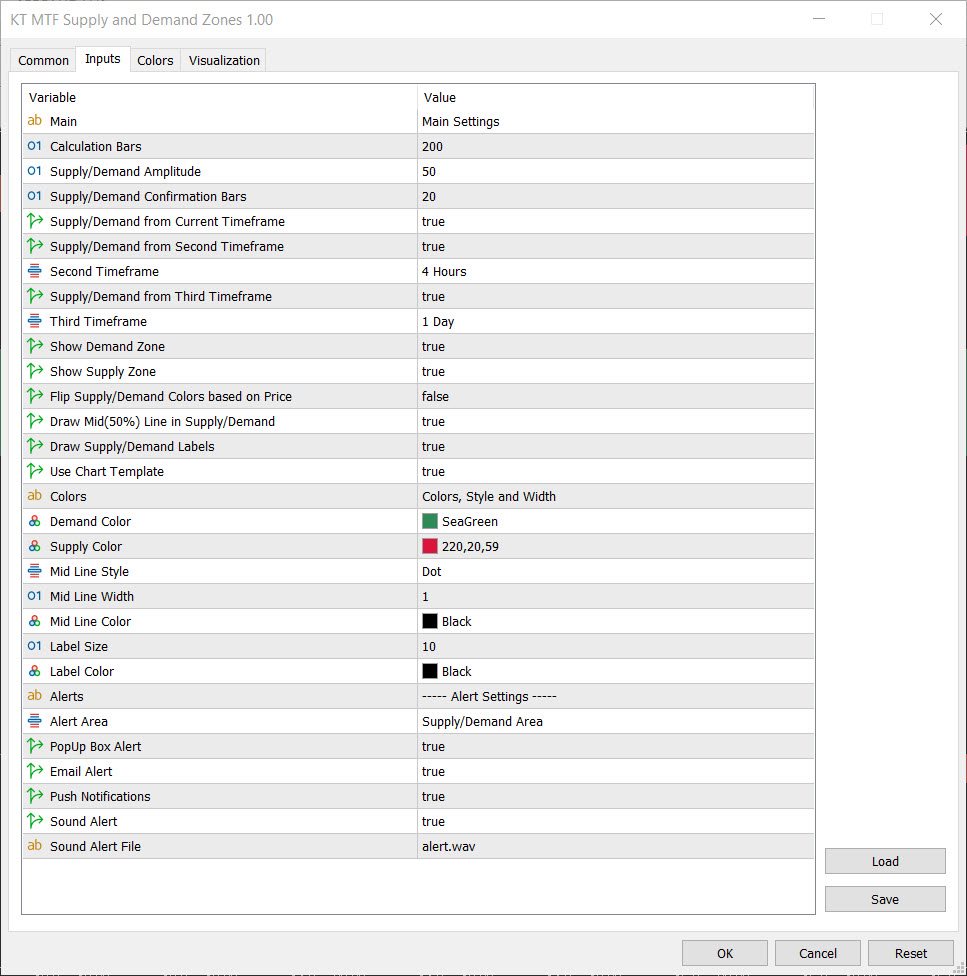
Indicator's Inputs

  • Calculation Bars: Set the number of bars to spot supply and demand zones. Recent bars have a stronger effect on price actions.
  • Supply/Demand Amplitude: Adjust this to pick up supply and demand zones. Bigger values give fewer but clearer zones; smaller ones give more zones.
  • Supply/Demand Confirmation Bars: Choose how many bars you want for confirming a zone. More bars mean a stronger zone.
  • Supply/Demand from Current Timeframe: Activate this to show the supply and demand zones from the current chart timeframe.
  • Supply/Demand from Second or Third Timeframe: Use this to see zones from other timeframes you pick.
  • Show Supply or Demand Zones: Decide if you want to see just supply or demand zones.
  • Flip Supply/Demand Colors based on Price: When on, the colors of supply and demand zones will shift with price changes.
  • Draw Mid(50%) Line in Zone: Turn this on to see a mid 50% line in each zone.
  • Utilize Chart Template: Enable this function to apply a specially designed chart template that harmoniously aligns with this indicator.
Рекомендуем также
The Th3Eng PipFinite indicator is based on a very excellent analysis of the right trend direction with perfect custom algorithms. It show the true direction and the best point to start trading. With StopLoss point and Three Take Profit points. Also it show the right pivot of the price and small points to order to replace the dynamic support and resistance channel, Which surrounds the price. And Finally it draws a very helpful Box on the left side on the chart includes (take profits and Stop loss
Owl smart levels
Sergey Ermolov
4.63 (54)
Версия MT5  | Как установить?  | FAQ Индикатор Owl Smart Levels   – это полноценная торговая система внутри одного индикатора, которая включает в себя такие популярные инструменты анализа рынка как усовершенствованные   фракталы Билла Вильямса , Valable ZigZag, который строит   правильную волновую структуру   рынка, а также  уровни Фибоначчи,   которые   отмечают точные уровни входа в рынок и места взятия прибыли. Подробное описание стратегии Инструкция по работе с индикатором Советник-помошник
Это трендовый индикатор без перерисовки Разработан вместо стратегии бля бинарках опционов (по цвету свечи мартингейл) Так же хорошо работает в торговле на рынке форекс Когда открывать сделки ( бинарные опционы ) Сигнал появится в месте с свечой сигналит на текущую свечу  Открывать сделку стоит на одну свечу текущего таймфрейма рекомендуется м1 и М5 При появлении синей точки открываем сделку вверх При появлении красной точки открываем сделку в низ. Как открывать сделки на Форекс. При полу
Noize Absorption Index - is the manual trading system that measures the difference of pressure between bears forces and bulls forces. Green line - is a noize free index that showing curent situation. Zero value of index shows totally choppy/flat market.Values above zero level shows how powerfull bullish wave is and values below zero measures bearish forces.Up arrow appears on bearish market when it's ready to reverse, dn arrow appears on weak bullish market, as a result of reverse expectation. S
PipFinite Trend PRO
Karlo Wilson Vendiola
4.9 (2780)
Стратегия пробоя для торговли по тренду, фильтрация и все необходимые функции, встроенные в один инструмент! Интеллектуальный алгоритм индикатора Trend Pro с точностью определяет тренд, отфильтровывает рыночный шум и генерирует входные сигналы и уровни выхода. Новые функции с расширенными правилами статистического расчета улучшают общую производительность этого индикатора. Важная информация Для максимального использования потенциала Trend Pro прочитайте полное описание www.mql5.com/en/blogs/
"Тренд - друг трейдера" . Это одна из самых известных пословиц в трейдинге, потому что правильное определение тренда может помочь заработать. Однако проще сказать о торговле по тренду, чем сделать, потому что многие индикаторы основаны на развороте цены, а не на анализе тренда. Они не очень эффективны при определении периодов тренда или в определении того, сохранится ли этот тренд. Мы разработали индикатор Trendiness Index , чтобы попытаться решить эту проблему. Индикатор определяет силу и напра
Heiken Ashi candle chart is an improved version of The Japanese candle chart, which can effectively filter the market "noise" of the Japanese candle chart. It is favored by many traders for its simplicity and intuition. For trend traders, the HA candle chart is a magic tool. Unlike the traditional Japanese candle chart, Heikenashi does not reflect the opening price, high price, low price and closing price of the market. Instead, Heikenashi calculates the value of a single K line in the dominant
Представляем       Графики   Quantum Heiken Ashi PRO Свечи Heiken Ashi, разработанные для обеспечения четкого понимания рыночных тенденций, известны своей способностью отфильтровывать шум и устранять ложные сигналы. Попрощайтесь со сбивающими с толку колебаниями цен и познакомьтесь с более плавным и надежным представлением графиков. Что делает Quantum Heiken Ashi PRO действительно уникальным, так это его инновационная формула, которая преобразует данные традиционных свечей в легко читаемые цветн
The Stepping Trend Indicator     The Steppi ng Trend indicator uses the  average true range  (ATR indicator) in its calculation. This gives you control to set your own average true range period, I set the Default as 10.   Indicator Details. Green Arrow Up: This means you are at the starting point of a new bullish trend, it’s time to buy.   Red  Arrow  Down : This means you are at the starting point of a new  bearish  trend, it’ s time to sell .   What if you miss the Arrow Signal?   No
Fibonacci retracement and extension line drawing tool Fibonacci retracement and extended line drawing tool for MT4 platform is suitable for traders who use  golden section trading Advantages: There is no extra line, no too long line, and it is easy to observe and find trading opportunities Trial version: https://www.mql5.com/zh/market/product/35884 Main functions: 1. Multiple groups of Fibonacci turns can be drawn directly, and the relationship between important turning points
Daily Candle Predictor - это индикатор, который предсказывает цену закрытия свечи. Прежде всего индикатор предназначен для использования на графиках D1. Данный индикатор подходит как для традиционной форекс торговли, так и для торговли бинарными опционами. Индикатор может использоваться как самостоятельная торговая система, так может выступать в качестве дополнения к вашей уже имеющейся торговой системе. Данный индикатор производит анализ текущей свечи, рассчитывая определенные факторы силы внут
Уникальная мультивалютная авторская стратегия, одновременно определяющая силу трендов и точки входа в рынок, визуализируя это с помощью гистограмм на графике. Индикатор оптимально адаптирован для торговли на временных периодах М5, М15, М30, Н1. При этом для удобства пользователя по определенной точке всегда появляется точка входа (в виде стрелки), рекомендуемые уровни получения прибыли (TP1, TP2 с текстовыми метками) и рекомендация по установке Стоп Лосс. Уровни получения прибыли (TP1, TP2) авто
VR Cub
Vladimir Pastushak
VR Cub это индикатор что бы получать качественные точки входа. Индикатор разрабатывался с целью облегчить математические расчеты и упростить поиск точек входа в позицию. Торговая стратегия, для которой писался индикатор, уже много лет доказывает свою эффективность. Простота торговой стратегии является ее большим преимуществом, что позволяет успешно торговать по ней даже начинающим трейдерам. VR Cub рассчитывает точки открытия позиций и целевые уровни Take Profit и Stop Loss, что значительно повы
Индикаторы [ZhiBiCCI] подходят для всех циклов использования, а также подходят для всех разновидностей рынка. [ZhiBiCCI] Зеленая сплошная линия - разворот бычьей дивергенции. Зеленая пунктирная линия - классическая бычья дивергенция. [ZhiBiCCI] Сплошная линия к красному - обратная медвежья дивергенция. Красная пунктирная линия - классическая медвежья дивергенция. [ZhiBiCCI] можно установить в параметрах (Предупреждение, Отправить почту, Отправить уведомление), установить на (true) для отпр
Chart Patterns Detect 15 patterns (Ascending Triangle, Descending Triangle, Rising Wedge, Falling Wedge, Bullish Flag, Bearish Flag, Bullish Rectangle, Bearish Rectangle Symmetrical triangle, Head and Shoulders, Inverted Head and Shoulders, Triple top, Triple Bottom, Double Top, Double Bottom) Use historical data to calculate the probability of each pattern to succeed (possibility to filter notification according to the chance of success) gives graphic indication about the invalidation level and
Профиль Рынка (Market Profile) определяет ряд типов дней, которые помогают трейдеру распознать поведение рынка. Ключевая особенность - это область значений (Value Area), представляющая диапазон ценового действия, в котором произошло 70% торговли. Понимание области значений может помочь трейдерам вникнуть в направление рынка и установить торговлю с более высокими шансами на успех. Это отличное дополнение к любой системе, которую вы возможно используете. Blahtech Limited представляет сообществу Me
Представляем вашему вниманию индикатор "Счётчик закрытия свечи", который станет вашим незаменимым помощником в мире трейдинга. Вот почему знание того, когда свеча закроется, может помочь: Если вы любите торговать, используя свечные паттерны, то вы будете знать, когда свеча будет закрыта. Этот индикатор позволит вам проверить, сформировался ли известный шаблон и есть ли возможность торговли. Индикатор поможет вам подготовиться к открытию рынка и закрытию рынка. Вы можете установить таймер, чтобы
Trend Monitor
Pavel Zamoshnikov
4.2 (5)
Индикатор дает ранние сигналы при смене тренда, основываясь на показаниях ADX в комбинации с элементами ценовых паттернов. Работает на любых инструментах и таймфреймах. Индикатор не перерисовывает свои сигналы. Вы видите на истории ту же картину, которая была в реал-тайм. Сигналы отображаются стрелками для удобства восприятия (чтобы не загромождать график). Особенности Простота использования. Все настройки фильтров сводятся к выбору чувствительности параметром " Sensitivity of the indicator ".
SUPER SALE! --> BUY Trend Reader Indicator with -$180 OFF and GET a BONUS EA: News Scope EA PRO with AMAZING results! NOTE: Trend Reader Indicator PROMO price: $117 (The next price $297) - The offer ends soon! Click here to check News Scope EA PRO results and learn more about the promotion! Trend Reader Indicator is a revolutionary trading indicator designed to empower forex traders with the tools they need to make informed trading decisions. This cutting-edge indicator utilizes complex mathema
Форекс индикатор  Wave Wold MT4   предназначен для поиска волн Вульфа и их отображения в текущем окне торгового терминала. Отличный  индикатор для трейдеров, использующих в торговле волны Вульфа. Его применение в торговых стратегиях значительно повысит их эффективность и прибыльность. ИНФОРМАЦИЯ О ИНДИКАТОРЕ В отличие от других индикаторов волн Вульфа, форекс индикатор  Wave Wold MT4  обладает рядом особенностей, которые значительно повышают его эффективность: Первая – это параметр Open Windo
This is a new strategy for SUPPLY DEMAND areas It is based on a calculation using the tick volume to detect the big price action in market for both bear /bull actions this smart volume action candles are used to determine the supply and demand areas prices in between main supply and demand lines indicate sideway market  up arrows will be shown when prices moves above the main supply and the secondary supply lines Down arrows will be shown when prices moves below the main demand and the secondary
Индикатор Point61 - результат многолетнего наблюдения за поведением цены валютных пар и металлов. Не секрет, что в моменты неопределенности трейдеры ищут возможные уровни поддержки и сопротивления - точки, где цена должна остановить движение. В этих точках возможны 2 сценария: 1. Разворот (коррекция) в обратную сторону; 2. Пробой для продолжения движения. Очень часто эти точки используются для установки стоп-ордеров - ТейкПрофит или СтопЛосс. И важно определять эти точки для максимизации прибыли
Trade with Gann on your side!! MASTER CIRCLE 360 CIRCLE CHART, originally created by Gann admitted that this is “The Mother of all charts”. It is one of the last studies that this great trader left for us. The numeric tab le is apparently quite simple like all the tables and is based on square numbers, the SQUARE OF 12 and is by evolution, one of the most important square numbers. Here we can find CYCLE, PRICE AND TIME thanks to angles and grades, to show past and future support and resistance.
Master scalping M1 -инновационный индикатор, использующий алгоритм для быстрого и точного определения тренда.Индикатор рассчитывает время открытия и закрытия позиций, алгоритмы индикатора позволяют находить идеальные моменты для входа в сделку (покупки или продажи актива), повышающие успешность сделок у большинства трейдеров. Преимущества индикатора: Прост в использовании, не перегружает график не нужной информацией. Возможность использования  как фильтр для любой стратегии. Работает на рынке
Akendicator X is a Non-repainting Indicator for trading at 5-15 minutes Timeframe.  Akendicator X extimates with clear arrows, in which direction the next candlestick will move. Pratically, when the length of the last candle reaches and exceeds a particular value (called Candle Power) immediately, after its closing, an arrow appears indicating whether the next candle could be Bullish or Bearish. I created a manual in pdf where you should learn exactly how to use AKENDICATOR X correctly; I will s
Индикатор LineMagnit для MT4 - высокоточный индикатор, который строит уровни поддержки и сопротивления, притягивающие к себе цену по принципу магнита. Это позволяет трейдеру легко определить наиболее вероятные точки входа и выхода из рынка, а также определить направление сил в рынке так как уровни строятся на основе вливаний капитала в инструмент. Индикатор LineMagnit   оснащен интуитивно понятным графическим интерфейсом, который позволяет быстро находить и анализировать уровни поддержки и сопро
Shark Deal Book
Philip Pankaj Suthagar
4 (3)
Term  "shark"  in the business world denotes a high volume investor who just made a good investment in a highly Potential business deal.So, sharks are the ones who make the market move. In our case, if an American shark bought a Japanese company, he/she has to convert American dollars into Japanese yen to make the deal. So, the demand for the Japanese yen will increase sharply. Thus USD/JPY will go short rapidly if the deal was from the shark. Another example, In the case of forex, if fed increa
Are you tired of the uncertainty that arises when your orders fail to stop at a specific line due to the spread? Look no further! Introducing our  indicator that plots candlesticks based on the Ask price instead of the traditional bid-based chart commonly used in MQL4. With this indicator, you can say goodbye to the frustrations caused by the bid-based chart, as it provides you with a more accurate representation of market movements. By utilizing the Ask price, which represents the price at whic
Усовершенствованная версия бесплатного индикатора HMA Trend (для MetaTrader 4) , с возможностью статистического анализа. HMA Trend - трендовый индикатор, базирующийся на скользящей средней Хала (Hull Moving Average - HMA) с двумя периодами. HMA с медленным периодом определяет тренд, HMA с быстрым периодом - краткосрочные движения и сигналы в сторону тренда. Главные отличия от бесплатного варианта: Возможность предсказать вероятность разворота тренда с помощью анализа исторических данных; Постр
Trend Line Chart Pattern Signals  Is a traders Tool for Signals based on Strong  Patterns Formed By a pair of robust trend lines. They FOR WITH DIFFERENT POPULAR PATTERNS ON CHARTS LIKE – TRIANGLES, FLAGS,RANGE , ASCENDING TRIANGLES, DESCENDING PATTERNS, PENNANTS ETC. The TREND LINES  form  dynamically  on running bars. The  sensitivity  of the trend lines can be changed by custom settings. The  Buy and Sell Signals Generate upon Break Of the Trend Line + "Close" of the same bar above the previo
С этим продуктом покупают
Инновационный индикатор, использующий эксклюзивный алгоритм для быстрого и точного определения тренда. Индикатор автоматически рассчитывает время открытия и закрытия позиций, а также подробную статистику работы индикатора на заданном отрезке истории, что позволяет выбрать наилучший торговый инструмент для торговли. Вы также можете подключить свои пользовательские стрелочные индикаторы к Scalper Inside Pro для проверки и расчета их статистики и прибыльности. Scalper Inside PRO инструкция и настро
В настоящее время скидка 20%! Лучшее решение для новичка или трейдера-эксперта! Эта приборная панель работает на 28 валютных парах. Он основан на 2 наших основных индикаторах (Advanced Currency Strength 28 и Advanced Currency Impulse). Он дает отличный обзор всего рынка Forex. Он показывает значения Advanced Currency Strength, скорость движения валюты и сигналы для 28 пар Forex на всех (9) таймфреймах. Представьте, как улучшится ваша торговля, когда вы сможете наблюдать за всем рынком с пом
Reversal First Impulse levels (RFI)        INSTRUCTIONS     RUS    -      ENG           Рекомендуем использовать с  индикатором -  TPSpro  TREND PRO -  Version MT5 Важным ключевым элементом в трейдинге являются зоны или уровни, от которых принимаются решения о покупке или продаже торгового инструмента. Несмотря на попытки крупных игроков скрыть свое присутствие на рынке, они неизбежно оставляют следы. Наша задача заключалась в том, чтобы научиться находить эти следы и правильно их интерпретирова
The AT Forex Indicator MT4 is a sophisticated trading tool designed to provide traders with a comprehensive analysis of multiple currency pairs. This   powerful indicator   simplifies the complex nature of the forex market, making it accessible for both novice and experienced traders. AT Forex Indicator uses   advanced algorithms   to detect trends, patterns and is an essential tool for traders aiming to enhance their forex trading performance. With its robust features, ease of use, and reliabl
Получайте ежедневную информацию о рынке с подробностями и скриншотами через наш утренний брифинг здесь, на mql5 , и в Telegram ! FX Power MT4 NG - это новое поколение нашего популярного измерителя силы валют FX Power. Что же предлагает этот измеритель силы нового поколения? Все, что вы любили в оригинальном FX Power ПЛЮС Анализ силы GOLD/XAU Еще более точные результаты расчетов Индивидуально настраиваемые периоды анализа Настраиваемый предел расчета для еще более высокой производительности Спец
TPSproTREND PrO
Roman Podpora
4.78 (18)
TPSpro TRENDPRO   —  трендовый индикатор, который автоматически анализирует рынок и предоставляет информацию о тренде и каждой его смене а также дающий сигналы для входа в сделки без перерисовки! Индикатор использует каждую свечу, анализируя их отдельно. относя к разным импульсам – импульс вверх или вниз. Точные точки входа в сделки  для  валют, крипты, металлов, акций, индексов! -  Version MT5             ПОЛНОЕ ОПИСАНИЕ ИНДИКАТОРА           Рекомендуем использовать с  индикатором -  RFI LEVE
Indicator : RealValueIndicator Description : RealValueIndicator is a powerful tool designed specifically for trading on the EURUSD pair. This indicator analyzes all EUR and USD pairs, calculates their real currency strength values, and displays them as a single realistic value to give you a head start on price. This indicator will tell you moves before they happen if you use it right. RealValueIndicator allows you to get a quick and accurate overview of the EURUSD currency pair tops and bottoms,
Представляем       Индикатор Quantum Trend Sniper   , инновационный индикатор MQL5, который меняет способ определения разворотов тренда и торговли ими! Разработан командой опытных трейдеров со стажем торговли более 13 лет,       Снайперский индикатор Quantum Trend       разработан, чтобы вывести ваше торговое путешествие на новые высоты благодаря инновационному способу определения разворотов тренда с чрезвычайно высокой точностью. ***Купите индикатор Quantum Trend Sniper и получите индикатор
TrendMaestro
Stefano Frisetti
5 (3)
note: this indicator is for METATRADER4, if you want the version for METATRADER5 this is the link:  https://www.mql5.com/it/market/product/108106 TRENDMAESTRO ver 2.4 TRENDMAESTRO recognizes a new TREND in the bud, he never makes mistakes. The certainty of identifying a new TREND is priceless. DESCRIPTION TRENDMAESTRO identifies a new TREND in the bud, this indicator examines the volatility, volumes and momentum to identify the moment in which there is an explosion of one or more of these data a
Прежде всего стоит подчеркнуть, что этот торговый индикатор не перерисовывается, не перерисовывает и не отставает, что делает его идеальным как для ручной, так и для роботизированной торговли. Руководство пользователя: настройки, вводы и стратегия. Атомный аналитик - это индикатор ценового действия PA, который использует силу и импульс цены, чтобы найти лучший край на рынке. Оборудованный расширенными фильтрами, которые помогают убирать шумы и ложные сигналы, и повышают торговый потенциал. Испо
В НАСТОЯЩЕЕ ВРЕМЯ СКИДКА 26% Лучшее решение для новичка или трейдера-эксперта! Этот индикатор является уникальным, высококачественным и доступным торговым инструментом, поскольку мы включили в него ряд собственных функций и новую формулу. С помощью всего лишь ОДНОГО графика вы можете определить силу валюты для 28 пар Форекс! Представьте, как улучшится ваша торговля, потому что вы сможете точно определить точку запуска нового тренда или возможность скальпирования? Руководство пользователя:
Advanced Supply Demand
Bernhard Schweigert
4.92 (313)
Этот индикатор является уникальным, качественным и доступным инструментом для торговли, включающим в себя наши собственные разработки и новую формулу. В обновленной версии появилась возможность отображать зоны двух таймфреймов. Это означает, что вам будут доступны зоны не только на старшем ТФ, а сразу с двух таймфреймов - таймфрейма графика и старшего: отображение вложенных зон. Обновление обязательно понравится всем трейдерам, торгующим по зонам спроса и предложения. Важная информация Для мак
Представляем       Quantum Breakout PRO   , новаторский индикатор MQL5, который меняет ваш способ торговли в зонах прорыва! Разработанная командой опытных трейдеров с опытом торговли более 13 лет,   Quantum Breakout PRO   предназначена для того, чтобы вывести ваше торговое путешествие на новые высоты благодаря своей инновационной и динамичной стратегии зон прорыва. Quantum Breakout Indicator покажет вам сигнальные стрелки на зонах прорыва с 5 целевыми зонами прибыли и предложением стоп-лос
NAM Order Blocks
NAM TECH GROUP, CORP.
5 (1)
Индикатор обнаружения блоков ордеров мультитаймфреймов MT4. Функции - Полностью настраиваемая панель управления графиком, обеспечивает полное взаимодействие. - Скрыть и показать панель управления где угодно. - Обнаружение OB на нескольких таймфреймах. - Выберите количество OB для отображения. - Различные пользовательские интерфейсы OB. - Различные фильтры по OB. - Оповещение о близости OB. - Линии ADR High и Low. - Служба уведомлений (Экранные оповещения | Push-уведомления).
FX Volume
Daniel Stein
4.61 (36)
Получайте ежедневную информацию о рынке с подробностями и скриншотами в нашем утреннем брифинге здесь, на mql5 , и в Telegram ! FX Volume - это ПЕРВЫЙ и ЕДИНСТВЕННЫЙ индикатор объема, который дает РЕАЛЬНОЕ представление о настроении рынка с точки зрения брокера. Он дает потрясающее представление о том, как институциональные участники рынка, такие как брокеры, позиционируют себя на рынке Forex, гораздо быстрее, чем отчеты COT. Видеть эту информацию прямо на своем графике - это настоящий геймчей
Enigmera
Ivan Stefanov
5 (4)
ЭНИГМЕРА: ядро рынка https://www.enigmera.com Введение Этот индикатор и торговая система представляют собой удивительный подход к финансовым рынкам. ENIGMERA использует фрактальные циклы для точного расчета уровней поддержки и сопротивления. Он показывает подлинную фазу накопления и дает направление и цели.  Система, которая работает независимо от того, находимся ли мы в тренде или в коррекции.  Как она работает? ENIGMERA состоит из трех линий: линии поддержки/сопротивления, линии цели и ли
Cycle Sniper
Elmira Memish
4.41 (37)
NEW YEAR SALE PRICE FOR LIMITED TIME!!! Please contact us after your purchase and we will send you the complimentary indicators to complete the system Cycle Sniper is not a holy grail but when you use it in a system which is explained in the videos, you will feel the difference. If you are not willing to focus on the charts designed with Cycle Sniper and other free tools we provide, we recommend not buying this indicator. We recommend watching the videos about the indiactor and system before pu
Индикатор All-in-One Trade (AOTI) определяет дневные цели для пар EURUSD, EURJPY, GBPUSD, USDCHF, EURGBP, EURCAD, EURAUD, AUDJPY, GBPAUD, GBPCAD, GBPCHF, GBPJPY, AUDUSD и USDJPY. Все остальные модули работают на любых финансовых инструментах. Индикатор включает в себя множество функций: двойной канал для определения тренда, ценовой канал, полосы МА, построение уровней Фибо, определение точки кульминации и др. Индикатор создан для упрощения анализа рынка и основан на нескольких торговых стратегия
TakePropips Donchian Trend Pro
Eric John Pajarillaga Aldana
4.61 (18)
TakePropips Donchian Trend Pro   (MT4) — это мощный и эффективный инструмент, который автоматически определяет направление тренда с помощью канала Дончиана и предоставляет вам торговые сигналы для входа и выхода! Этот многофункциональный индикатор включает в себя сканер тренда, торговые сигналы, статистическую панель, скринер, торговые сессии и панель истории предупреждений. Он разработан, чтобы предоставить вам торговые сигналы и сэкономить время на анализе графиков! Вы можете скачать руководст
Топовый индикатор МТ4, дающий сигналы для входа в сделки без перерисовки! Идеальные точки входа в сделки   для  валют, крипты, металлов, акций, индексов !  Смотрите  видео  (6:22) с примером отработки всего одного сигнала, окупившего индикатор. Версия индикатора для MT5 Преимущества индикатора Сигналы на вход без перерисовки Если сигнал появился, он никуда НЕ исчезает! В отличие от индикаторов с перерисовкой, которые ведут к потере депозита, потому что могут показать сигнал, а потом убрать его.
Прецизионный индикатор осциллятора (Pi-Osc) от Роджера Медкалфа из Precision Trading Systems Версия 2 была тщательно перекодирована для быстрой загрузки на вашем графике, а также внесены некоторые другие технические улучшения для улучшения опыта. Pi-Osc был создан для предоставления точных сигналов времени для совершения сделок, предназначенных для поиска экстремальных точек истощения - точек, к которым рынок вынужден идти, чтобы сработать стоп-заказы всех остальных. Этот продукт решает вековую
Welcome to the world of SMC (Smart Money Concepts) Trading, where we empower traders with the tools and knowledge to make smarter trading decisions. Our latest addition to our suite of trading tools is the SMC Trading Pro indicator, version 1.0. Key Features: Major Market Structure Identification with BODY break. Order Block must be in Major Swing ( not Small Swing ). Order Block with Fair Value Gap Detection. Order Block in Discount | Premium zone. Filter for only Bullish, Bearish or All Order
ZeusArrow Smart Liquidity Finder  Smart Liquidity Finder is Ai controlled indicator based on the Idea of Your SL is My Entry. It scan and draws the major Liquidity areas on chart partitioning them with Premium and Discount Zone and allows you find the best possible trading setups and help you decide the perfect entry price to avoid getting your Stop Loss hunted . Now no more confusion about when to enter and where to enter. Benefit from this one of it's kind trading tool powered by Ai an trade
А. Что такое A2SR?   * Это опережающий технический индикатор (без перерисовки, без запаздывания) . -- Учебники : -- на https://www.mql5.com/ru/blogs/post/734748/page4#comment_16532516   -- и https://www.mql5.com/ru/users/yohana/blog A2SR имеет особую технику определения уровней Поддержки (спроса) и Сопротивления (предложения). В отличие от обычного способа, который мы видели в сети, A2SR имеет оригинальную концепцию определения фактических уровней SR. Оригинальная техника не была взята из Инт
Ищете мощный индикатор для торговли на рынке Форекс, который поможет вам с легкостью определить прибыльные торговые возможности? Не ищите ничего, кроме Beast Super Signal. Этот простой в использовании индикатор, основанный на тренде, постоянно отслеживает рыночные условия, ищет новые развивающиеся тренды или отслеживает уже существующие. Beast Super Signal дает сигнал на покупку или продажу, когда все внутренние стратегии совпадают и на 100% совпадают друг с другом, что устраняет необходимость в
GOLD Impulse with Alert
Bernhard Schweigert
4.56 (9)
Этот индикатор является супер комбинацией двух наших продуктов Advanced Currency IMPULSE with ALERT  +   Currency Strength Exotics . Он работает на всех временных рамках и графически показывает импульс силы или слабости для 8 основных валют плюс один символ! Этот индикатор специализирован для отображения ускорения силы валюты для любых символов, таких как золото, экзотические пары, товары, индексы или фьючерсы. Первый в своем роде, любой символ может быть добавлен в 9-ю строку, чтобы пока
FxBears Powers работает со всеми валютными парами, металлами, товарами, фьючерсами, индексами, энергоносителями, криптовалютой и всем ... и на всех таймфреймах от M1 до MN. Он основан на спросе и предложении и некоторых внутренних индикаторах, он дает вам очень сильную точку входа с нулевым проскальзыванием большую часть времени, вы можете проверить это в тесте. Он мгновенно отправляет вам сигналы на платформу вашего телефона, где бы вы ни находились, он содержит название пары, время, таймф
The Volume by Price Indicator for MetaTrader 4 features Volume Profile and Market Profile TPO (Time Price Opportunity). Volume and TPO histogram bar and line charts. Volume Footprint charts. TPO letter and block marker collapsed and split structure charts. Session filtering and grouping. Static, dynamic and flexible range segmentation and compositing methods with relative and absolute visualizations. Graphical layering, positioning and styling options to suit the user's analytic and aesthetic n
norepaint buy sell indicator is norepaint indicator.and works all pairs and all timeframes. Indicator hold too long way to signals. And show major and minor cycles.and gives signals Minor cycles are indicating with x signs. Major cycles are indicating big arrows. So 5m chart and 15m chart more suitable For major cycles, 1 h and 4h chart suitable for minor cycles. using is wery simple ,it puts arrow on price probably buy sell arrows. thise indicator is suitable for beginner and experienced trader
В НАСТОЯЩЕЕ ВРЕМЯ СКИДКА 20%! Лучшее решение для новичка или трейдера-эксперта! Этот индикатор специализирован для отображения силы валюты для любых символов, таких как экзотические пары, товары, индексы или фьючерсы. Впервые в своем роде, любой символ может быть добавлен в 9-ю строку, чтобы показать истинную силу валюты золота, серебра, нефти, DAX, US30, MXN, TRY, CNH и т.д. Это уникальный, высококачественный и доступный торговый инструмент, потому что мы включили в него ряд собственных функци
Другие продукты этого автора
KT Momentum Arrows MT5
KEENBASE SOFTWARE SOLUTIONS
5 (3)
KT Momentum Arrows Indicator is based on a momentary breakout which is calculated using the bands deviation and emerging volatility in a certain direction. A buy signal is generated when the price closes above the upper band and a sell signal is generated when the price closes below the lower band. A magnitude coefficient is used as the input which affects the band deviation and volatility at the same time. The coefficient value should be carefully selected and analyzed based on the instrument a
If you trade Forex, having detailed information about the currency strength and currency pairs correlation can take your trading to new heights. The correlation will help to cut your risk in half, and strength analysis will help to maximize the profits. This indicator provides a hybrid approach for selecting the most appropriate currency pairs using the strength analysis and currency pairs correlation. How to use the Currency Strength Analysis Suppose your trading strategy provides a buying o
KT Auto Fibo MT5
KEENBASE SOFTWARE SOLUTIONS
5 (1)
KT Auto Fibo draws Fibonacci retracement levels based on the ongoing trend direction. The Highs and Lows are automatically selected using the Maximum and Minimum points available on the chart. You can zoom in/out and scroll to adjust the Fibonacci levels accordingly. Modes Auto:  It draws the Fibonacci levels automatically based on the chart area. Manual:  It draws the Fibonacci levels only one time. After that, you can change the anchor points manually. Usage: Helps to predict the future p
KT Trend Magic MT5
KEENBASE SOFTWARE SOLUTIONS
KT Trend Magic shows the trend depiction on chart using the combination of market momentum and volatility. A smoothing coefficient is used to smooth out the noise from the signal.It can be used to find out the new entries or confirm the trades produced by other EA or indicator. Features Drag n drop MTF scanner which scans for the new signals across multiple time-frames. Find new entries in the trend direction. Improve the accuracy of other indicators when used in conjunction. Can be used as a
Divergence is one of the vital signals that depicts the upcoming price reversal in the market. KT Stoch Divergence shows the regular and hidden divergences build between the price and stochastic oscillator. Limitations of KT Stoch Divergence Using the Stochastic divergence as a standalone entry signal can be risky. Every divergence can't be interpreted as a strong reversal signal. For better results, try to combine it with price action and trend direction. Features Marks regular and hidde
ACB Breakout Arrows
KEENBASE SOFTWARE SOLUTIONS
4.19 (36)
The ACB Breakout Arrows indicator provides a crucial entry signal in the market by detecting a special breakout pattern. The indicator constantly scans the chart for a settling momentum in one direction and provide the accurate entry signal right before the major move.  Get multi-symbol and multi-timeframe scanner from here - Scanner for ACB Breakout Arrows MT4 Key features Stoploss and Take Profit levels are provided by the indicator. Comes with a MTF Scanner dashboard which tracks the brea
ACB Trade Filter MT4
KEENBASE SOFTWARE SOLUTIONS
5 (2)
Индикатор ACB Trade Filter отфильтровывает маловероятные торговые сигналы в торговой стратегии. Продукт использует сложный алгоритм фильтрации на основе рыночных настроений и трендов. Заявки Хорошо сочетается с другим нашим индикатором ACB Breakout Arrows . Отфильтровывает маловероятные сигналы любого индикатора. Избегает слишком частых сделок и минимизирует убытки. Торгует в направлении рыночных настроений. Хорошо справляется с волатильностью. Инструкция по применению Покупайте, если гистог
KT Momentum Arrows
KEENBASE SOFTWARE SOLUTIONS
KT Momentum Arrows Indicator is based on a momentary breakout which is calculated using the bands deviation and emerging volatility in a certain direction. A buy signal is generated when the price close above the upper band and a sell signal is generated when the price close below the lower band. A magnitude coefficient is used as the input which affects the band deviation and volatility at the same time. The coefficient value should be carefully selected and analyzed based on the instrument and
KT COG Advanced MT4
KEENBASE SOFTWARE SOLUTIONS
1 (1)
KT COG is an advanced implementation of the center of gravity indicator presented by John F. Ehlers in the May 2002 edition of Technical Analysis of Stocks & Commodities magazine. It's a leading indicator which can be used to identify the potential reversal points with the minimum lag. The COG oscillator catches the price swings quite effectively. MT5 version of the same indicator is available here KT COG Advanced MT5 Calculation of COG The COG indicator is consist of the two lines. The mai
KT Pin Bar
KEENBASE SOFTWARE SOLUTIONS
KT Pin Bar identifies the pin bar formation which is a type of price action pattern which depicts a sign of reversal or rejection of the trend. When combined with support and resistance, BRN and other significant levels, Pin Bar pattern proved to be a very strong sign of reversal. Basically, a pin bar is characterized by a small body relative to the bar length which is closed either in upper or lower 50% part of its length. They have very large wicks and small candle body. A pin bar candlest
KT Trend Magic
KEENBASE SOFTWARE SOLUTIONS
KT Trend Magic shows the trend depiction on chart using the combination of market momentum and volatility. A smoothing coefficient is used to smooth out the noise from the signal.It can be used to find out the new entries or confirm the trades produced by other EA/Indicators. Usage Drag n drop MTF scanner which scans for the new signals across multiple time-frames. Find new entries in the trend direction. Improve the accuracy of other indicators when used in conjunction. Can be used as a dyna
KT Auto Fibo
KEENBASE SOFTWARE SOLUTIONS
KT Auto Fibo draws Fibonacci retracement levels based on the ongoing trend direction. The Highs and Lows are automatically selected using the Maximum and Minimum points available on the chart. You can zoom in/out and scroll to adjust the Fibonacci levels accordingly. Modes Auto:  It draws the Fibonacci levels automatically based on the chart area. Manual: It draws the Fibonacci levels only one time. After that, you can change the anchor points manually. Usage: Helps to predict the future pr
KT Psar Arrows
KEENBASE SOFTWARE SOLUTIONS
KT Psar Arrows plots the arrows on chart using the standard Parabolic SAR indicator. A bullish arrow is plotted when the candle's high touch the SAR. A bearish arrow is plotted when the candle's low touch the SAR. The signals are generated in the real-time without waiting for the bar close.  Features A beneficial tool for traders who want to experiment with the trading strategies that include the use of Parabolic Sar indicator.  Can be used to find turning points in the market. Use custom PSA
KT Ichimoku Trader
KEENBASE SOFTWARE SOLUTIONS
1 (1)
KT Ichimoku Trader is a fully automated expert advisor that offers five popular trading strategies based on the Ichimoku indicator. Each strategy has it's own entry and exit method without any interference to other strategies. The Ichimoku system can be applied to all major currency pairs and metals. However, we found that it performs reasonably well mainly on two pairs.   MT5 Version is available here  https://www.mql5.com/en/market/product/35043 Features Trade up to 5 famous trading strate
KT Volatility oscillator analyze the past and current market data with a mathematical formula to display the result in a form of an oscillator. The growing and deteriorating waves are equivalent to high and low volatility in the asset.  In a nutshell, volatility is simply a measurement of the price fluctuation of an asset over a certain period of time. Without volatility, there would not much movement in the market and traders would not be able to profit from the price movements. Use of Volati
KT COG Robot
KEENBASE SOFTWARE SOLUTIONS
KT COG Robot is a fully automated Expert Advisor based on the KT COG Indicator . The COG indicator was originally presented by John F. Ehlers in the May 2002 edition of Technical Analysis of Stocks & Commodities magazine. The EA fires a long trade when COG line cross above the signal line and a short trade is fired when the COG line cross below the signal line.  Adaptive Filtration Our adaptive filtration algorithm combines the original COG formula with the major trend direction and market ac
ACB Breakout Arrows EA
KEENBASE SOFTWARE SOLUTIONS
This is a 100% automated expert advisor based on our custom indicator named "ACB Breakout Arrows" . The entries are based on a breakout pattern that constantly occurs in a bi-directional manner. The intensity of entry signals can be manipulated using the external input called "Signal Sensitivity". MT5 Version is available here  https://www.mql5.com/en/market/product/35785 Trades Confirmation ACB Breakout Arrows EA provides an ability to filter the entries using our another custom indicator n
KT Asian Breakout
KEENBASE SOFTWARE SOLUTIONS
4 (1)
KT Asian Breakout carefully analyzes the range-bound market during the Asian session and then fires a long or short trade after doing some preassessment based on its inbuilt technical analysis module. The executed orders are closed within a day before the completion of the next day session. The inbuilt technical analysis module checks for the session range and compares it with the last 20 days price movement. If it finds any erratic price movement within the session, the orders are not execute
KT London Breakout
KEENBASE SOFTWARE SOLUTIONS
First thirty minutes are essential for a trading session. The early reaction of traders and market players sets a path for the rest of the day. KT London Breakout EA takes advantage of this phenomenon, and after analyzing the first thirty minutes of London session, it places two bidirectional pending orders. One of pending order is eventually canceled after realizing the market direction with certainty. It has been strictly tested and developed for EUR/JPY using 30-Min Time Frame. You can ex
Use of support and resistance in systematic trading is very subjective. Every trader has their own idea and way to plotting the support and resistance levels on the chart. KT Support and Resistance indicator take out this ambiguity out of the situation and automatically draws support and resistance levels following an algorithmic approach using a unique multi-timeframe analysis. When launched on the chart, It immediately scan the most significant extreme points across all the available timefr
MACD Divergence Seeker
KEENBASE SOFTWARE SOLUTIONS
KT MACD Divergence Seeker trades the regular and hidden divergence signals generated by our free indicator named KT MACD Divergence indicator. Trading the standalone divergences can be a risky affair that's why the KT MACD Divergence Seeker combines the standard divergence signals with an advanced analysis module to exploit the price inefficiencies on some FX pairs. What is the Divergence exactly? As a general conception if the price is making higher highs, then macd should also be making
KT Asian Breakout indicator scans and analyzes a critical part of the Asian session to generate bi-directional buy and sell signals with the direction of a price breakout. A buy signal occurs when the price breaks above the session high, and a sell signal occurs when the price breaks below the session low. MT5 Version is available here https://www.mql5.com/en/market/product/41704 Things to remember If the session box is vertically too wide, a new trade should be avoided as most of the price
MACD Divergence MT4
KEENBASE SOFTWARE SOLUTIONS
KT MACD Divergence shows the regular and hidden divergences build between the price and oscillator. If your trading strategy anticipates the trend reversal, you can include the MACD regular divergence to speculate the potential turning points. And if your trading strategy based on the trend continuation, MACD hidden divergence would be a good fit. Limitations of KT MACD Divergence Using the macd divergence as a standalone entry signal can be a risky affair. Every divergence can't be interpr
KT Bollinger Bands Trader is a 100% automated expert advisor that's incorporated a mean reversion trading strategy using the Bollinger bands during the period of low volatility. Price often reacts at the upper or lower line of Bollinger bands, but a reversal not always occurs. However, there is more chance of price reversal during the time of low volatility. Entries A buy trade is activated when price correctly aligns below the bottom line of Bollinger bands. A sell trade is activated when pri
KT CCI Divergence MT4
KEENBASE SOFTWARE SOLUTIONS
KT CCI Divergence shows the regular and hidden divergence created between the price and CCI oscillator. Divergence is one of the vital signals that depicts the upcoming price reversal in the market. Manually spotting the divergence between price and CCI can be a hectic and ambiguous task. Limitations of KT CCI Divergence   Using the CCI divergence as a standalone entry signal can be risky. Every divergence can't be interpreted as a strong reversal signal. For better results, try to combine it
KT Heiken Ashi Smoothed is a smoothed version of the standard Heiken Ashi. Moreover, it also plots buy/sell arrows on a trend change. A buy arrow is plotted when it change to a bullish state from bearish state. A sell arrow is plotted when it change to a bearish state from bullish state. Mobile notifications, Email, Sound and Pop-up alerts included. What exactly is Heiken Ashi Smoothed? It filters out the false signals and noise in the standard Heiken Ashi. It applies the set of two moving a
KT MA Crossover MT4
KEENBASE SOFTWARE SOLUTIONS
KT MA Crossover draws the buy and sell arrows based on the crossover of chosen moving averages. Moreover, it also generates the appropriate alerts and displays the MFE (Most Favorable Excursion) for each successive signal. The moving average crossover is one of the primary strategies followed by traders around the world. Usually, it consists of a fast and slow moving average to find a buy and sell entry signal according to the crossover direction. Buy signal - when fast MA crosses above the slo
KT Round Numbers MT4
KEENBASE SOFTWARE SOLUTIONS
KT Round Numbers plots the round number levels which are also commonly known as psychological levels in the Forex world. In the context of Forex trading, round number levels are those levels in which there are two or more zeroes at the end. They are named as 00 levels on the chart. Some traders also consider the halfway points as a valid round number level. They are named as 50 levels on the chart. Use of round number levels in trading Round number levels work as strong support and resistan
Despite the popularity of inside bar pattern among the traders, using it as a standalone signal doesn't provide any edge in the market. KT Inside Bar Advanced indicator solves this problem by combining the classic inside bar pattern with the "ECE" cycle and Fibonacci extensions. Using this indicator in place of our classic inside bar indicator will provide a tremendous advantage and edge in the market. What is the ECE cycle? In financial markets, the price never moves in a straight line bu
KT Inside Bar Hunter MT4
KEENBASE SOFTWARE SOLUTIONS
Despite the popularity of inside bar pattern among traders, using it as a standalone entry signal doesn't provide any evidentiary advantage. KT Inside Bar Hunter trades only selected inside bar patterns using some preassessment and ECE price action cycle. Trading Strategy On successful detection of the required pattern, EA places a pending order in the direction of the forecasted price expansion phase. Pending orders are canceled if they are not triggered within the next bar. Once triggered,
Фильтр:
Нет отзывов
Ответ на отзыв