• Обзор
  • Отзывы
  • Обсуждение

Convergence Divergence Indicator

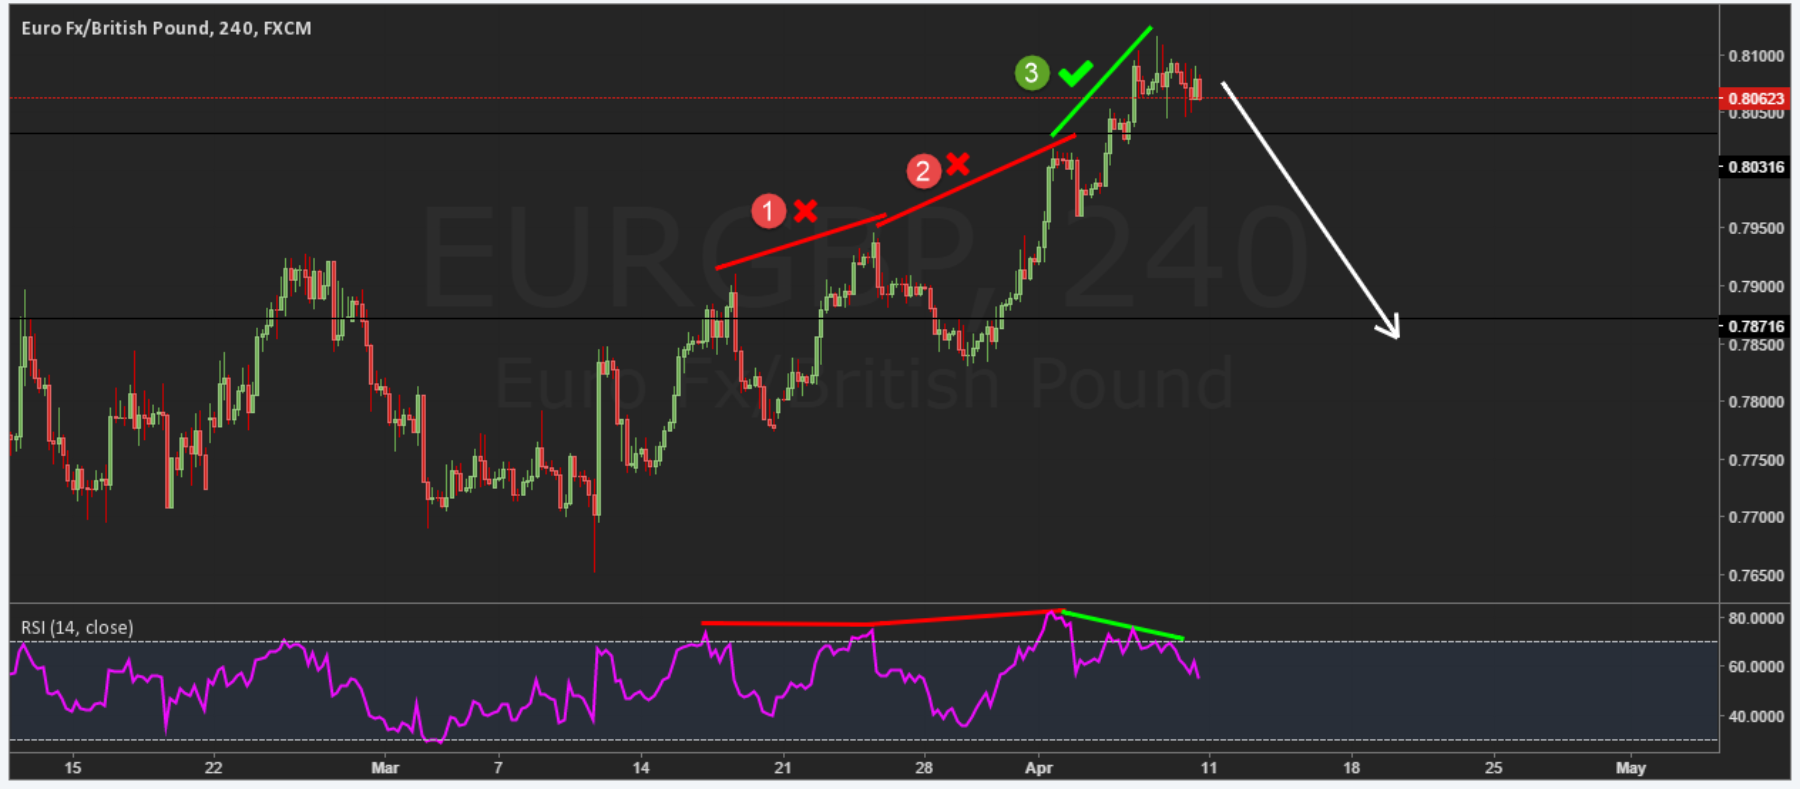
  1. Divergence Detection: The indicator is designed to identify divergences between the price movement and the Stochastics oscillator. This can help traders spot potential trend reversals or trend continuation opportunities.

  2. Early Warning System: By capturing divergences, the Stochastics Divergence Indicator can provide an early warning of possible market turning points. This allows traders to take timely action and make informed decisions.

  3. Versatility: The indicator can be applied to various financial markets, including stocks, forex, commodities, and cryptocurrencies. This versatility makes it suitable for a wide range of traders and investors.

  4. Customizable Parameters: Traders have the flexibility to customize the indicator's parameters based on their trading style and preferences. This allows for a personalized approach to using the indicator effectively.

  5. User-Friendly Interface: The Stochastics Divergence Indicator typically comes with a user-friendly interface that makes it easy to interpret and apply. It often includes visual representations, such as arrows or color-coded signals, to make trend divergences more visually apparent.

  6. Integration with Trading Platforms: Many popular trading platforms support the Stochastics Divergence Indicator, allowing traders to seamlessly incorporate it into their existing trading setups and strategies.

Remember, while the Stochastics Divergence Indicator can be a helpful tool, it's always recommended to combine it with other technical analysis tools and fundamental analysis for a well-rounded trading approach. Happy trading!


Рекомендуем также
Версия MT4   |   FAQ Индикатор Owl Smart Levels – это полноценная торговая система внутри одного индикатора, которая включает в себя такие популярные инструменты анализа рынка как усовершенствованные фракталы Билла Вильямса , Valable ZigZag, который строит правильную волновую структуру рынка, а также  уровни Фибоначчи, которые   отмечают точные уровни входа в рынок и места взятия прибыли. Подробное описание стратегии Инструкция по работе с индикатором Советник-помошник в торговле Owl Helper При
Ловец трендов: Стратегия Ловец трендов с индикатором оповещения - это универсальный инструмент технического анализа, который помогает трейдерам определять рыночные тренды и потенциальные точки входа и выхода. Он представляет собой динамичную стратегию Ловец трендов, адаптирующуюся к рыночным условиям для четкого визуального представления направления тренда. Трейдеры могут настраивать параметры в соответствии со своими предпочтениями и уровнем риска. Индикатор помогает в идентификации тренда,
FREE
WanaScalper
Isaac Wanasolo
1 (1)
A scalping indicator based on mathematical patterns, which on average gives signals with relatively small SL, and also occasionally helps to catch big moves in the markets (more information in the video) This indicator has three main types of notifications: The first type warns of a possible/upcoming signal on the next bar The second type indicates the presence of a ready signal to enter the market/open a position The third type is for SL and TP levels - you will be notified every time price r
Premium level - это уникальный индикатор с точностью правильных прогнозов  более 80%!  Данный индикатор тестировался более двух месяцев лучшими Специалистами в области Трейдинга!  Индикатор авторский такого вы больше не где не найдете!  По скриншотах можете сами увидеть точностью данного инструмента!  1 отлично подходит для торговли бинарными опционами со временем экспирации на 1 свечу. 2 работает на всех валютных парах, акциях, сырье, криптовалютах Инструкция: Как только появляется красная стре
Your Trend Friend
Luigi Nunes Labigalini
5 (1)
The trend is your friend! Look at the color of the indicator and trade on that direction. It does not  repaint. After each candle is closed, that's the color of the trend. You can focus on shorter faster trends or major trends, just test what's most suitable for the symbol and timeframe you trade. Simply change the "Length" parameter and the indicator will automatically adapt. You can also change the color, thickness and style of the lines. Download and give it a try! There are big movements
Magic Finger can help you identify trends and trading opportunities clearly. The finger points to the open position signal, and the discoloration line is confirmed by the trend. If you are a day trader, you can choose to trade during a period of active trading, referring to the discoloration line as the basis for the next order, finger signal as a filter. If you are a trend trader, you can choose a period above H1, wait for the appearance of the finger signal in the key price area, and enter
Noize Absorption Index - is the manual trading system that measures the difference of pressure between bears forces and bulls forces. Green line - is a noize free index that showing curent situation. Zero value of index shows totally choppy/flat market.Values above zero level shows how powerfull bullish wave is and values below zero measures bearish forces.Up arrow appears on bearish market when it's ready to reverse, dn arrow appears on weak bullish market, as a result of reverse expectation.
Orbit Rage Final 2
BILLY ARANDUQUE ABCEDE
Note : i only sell this EA on MQL5, any other sellers is fake. Orbit Rage Final, a cutting-edge trading strategy meticulously designed around the bull/bear candle approach and divergence analysis. This powerful tool is engineered to empower you to shape the life you desire. To embark on this transformative journey, simply download and seamlessly integrate it into your MetaTrader 4 platform by placing it in the experts advisors folder. Orbit Rage Final revolutionizes trading by offering a risk-f
WEEKEND OFFER! --> -60% OFF + BONUS EA: NEWS Scope EA PRO with AMAZING results! NOTE: Promo price: $117 ( Regular Price: $297) - The offer ends on Monday!  Click here to check News Scope EA PRO results! Trend Reader Indicator is a revolutionary trading indicator designed to empower forex traders with the tools they need to make informed trading decisions. This cutting-edge indicator utilizes complex mathematical calculations and the Average True Range (ATR) indicator to identify and highlight t
Уникальный индикатор, реализующий профессиональный и количественный подход к торговле на возврате к среднему. Он использует тот факт, что цена отклоняется и возвращается к среднему предсказуемым и измеримым образом, что позволяет использовать четкие правила входа и выхода, которые значительно превосходят неколичественные торговые стратегии. [ Installation Guide | Update Guide | Troubleshooting | FAQ | All Products ] Четкие торговые сигналы Удивительно легко торговать Настраиваемые цвета и разм
Limitless MT5  - это универсальный индикатор который подойдет каждому как начинающему так и опытному трейдеру работает на всех валютных парах криптовалютах сыре акциях Limitless MT5 - уже настроен и не требует дополнительной настройки   А теперь главное Почему  Limitless MT5 ? 1 полное отсутствие перерисовки  2 два года тестирования лучшими специалистами в трейдинге 3 точность правильных сигналов превышает 80% 4 хорошо показал себя в торговле во время выхода новостей Правила торговли  1 сигнал н
Прежде всего стоит подчеркнуть, что этот Торговый Инструмент является Неперерисовывающимся Нерепейнтинговым Индикатором, что делает его идеальным для профессиональной торговли. Онлайн-курс, руководство пользователя и демонстрация. Индикатор Концепций Умного Действия Цены - очень мощный инструмент как для новичков, так и для опытных трейдеров. Он объединяет более 20 полезных индикаторов в одном, комбинируя передовые торговые идеи, такие как анализ Inner Circle Trader и стратегии торговли конц
Этот индикатор покажет вам значения TP и SL (в этой валюте), которые вы уже установили для каждого ордера на графиках (закрытые от линии транзакции/ордера), что очень поможет вам оценить вашу прибыль и убыток для каждого ордера. И он также показывает вам значения PIP. Показанный формат - «Валютные значения нашей прибыли или убытка / значений PIP». Значение TP будет отображаться зеленым цветом, а значение SL — красным. По любым вопросам или для получения дополнительной информации, пожалуйста,
This indicator is based on a mathematical formula and an ANN combined, designed to make a model(using previous prices) of the most recent market condition (any chart*) in order to use the model as a forecasting tool. *This indicator can operate on any chart/timeframe, but it's suggested you use multiple timeframes for each trade because this method relies solely on the time factor, you can not use this indicator to predict price volatility, but if it's fit correctly it will show you when the nex
Сложно найти и дефицит по частоте, дивергенции являются одним из самых надежных торговых сценариев. Этот индикатор автоматически находит и сканирует регулярные и скрытые расхождения, используя ваш любимый осциллятор. [ Руководство по установке | Руководство по обновлению | Устранение неполадок | FAQ | Все продукты ] Легко торговать Находит регулярные и скрытые расхождения Поддерживает много известных генераторов Реализует торговые сигналы на основе прорывов Отображает подходящие уровни ст
Please backtest with the exact balance of your live account before applying to real money. ==> If account balance is too low it may not trade at all! For MT4 version please contact via private message. martingale version is available here . Strategy description - Detect trend based on EMA18-EMA50-SMA200 alignment in three time frames: M15, H1, H4 - Trade in trend direction and exit when above alignment is broken. - The bot is tuned to trade XAUUSD(Gold). - The bot output is break even in rangi
FREE
Профессиональный эксперт форекс   Gyroscope (для пар EURUSD, GBPUSD, USDJPY, AUDUSD, USDCHF, EURGBP, EURJPY, NZDUSD, USDCAD, EURCHF, AUDJPY, CADJPY)  ализирующий рынок при помощи индекса волн эллиота. Волновая теория Эллиотта — интерпретация процессов на финансовых рынках через систему визуальных моделей (волн) на ценовых графиках.  Автор теории Ральф Эллиотт выделил восемь вариантов чередующихся волн (из них пять по тренду и три против тренда). Движение цен на рынках принимает форму пяти вол
SmartTrendMt5 - индикатор тренда и торговых сигналов, основанный на принципе совмещенного анализа расчетных опорных точек внутри канала Келтнера. Индикатор формирует в отдельном окне канал Келтнера (по умолчанию линии красного цвета и линия синего цвета - середина канала), а также гистограмму расчетных опорных точек для каждой свечи (по умолчанию столбцы гистограммы желтого цвета). Индикатор устанавливается обычным образом на любой торговый символ с любым временным интервалом. Преимущества инд
- This is the exact conversion from TradingView: "Support/Resistance" By "BarsStallone". - This indicator lets you read the buffers for R/S values. - This is a non-repaint and light processing load indicator. - This is not a multi time frame indicator If you want the multi time frame version you should create a personal order and I deliver two files that you need them both to have the multi time frame indicator running on your system. - The MT4 version of the indicator is not light load from pr
Прежде всего стоит подчеркнуть, что этот торговый индикатор не перерисовывается, не перерисовывает и не отставает, что делает его идеальным как для ручной, так и для роботизированной торговли. Руководство пользователя: настройки, вводы и стратегия. Атомный аналитик - это индикатор ценового действия PA, который использует силу и импульс цены, чтобы найти лучший край на рынке. Оборудованный расширенными фильтрами, которые помогают убирать шумы и ложные сигналы, и повышают торговый потенциал. Испо
Этот индикатор находит AB = шаблоны восстановления CD. Паттерн AB = CD Retracement представляет собой 4-точечную ценовую структуру, в которой начальный ценовой сегмент частично восстановлен и сопровождается равноудаленным движением от завершения отката, и является базовой основой для всех гармонических паттернов. [ Руководство по установке | Руководство по обновлению | Устранение неполадок | FAQ | Все продукты ] Настраиваемые размеры рисунков Настраиваемые соотношения AC и BD Настраиваемы
Одна из числовых последовательностей носит название - "Последовательность лесного пожара". Она была признана одной из самых красивых новых последовательностей. Её главная особенность заключается в том, что эта последовательность избегает линейных трендов, даже самых кратковременных. Именно это свойство легло в основу этого индикатора. При анализе финансового временного ряда этот индикатор старается отбросить все возможные варианты тренда. И только если это ему не удается, то он признает наличие
Усовершенствованная Мультитаймфреймовая версия скользящей средней Хала (Hull Moving Average - HMA). Особенности Две линии индикатора Халла разных таймфреймов на одном графике. Линия HMA старшего таймфрейма определяет тренд, а линия HMA текущего таймфрейма - краткосрочные ценовые движения. Графическая панель с данными индикатора HMA на всех таймфреймах одновременно. Если на каком-либо таймфрейме HMA переключил свое направление, на панели отображается вопросительный или восклицательный знак с тек
The Cipher Hybrid-HFT Gold Trader: The Power of Probability Theory and Price Action Principles The vast majority of technical indicators are the same age as dinosaurs. Also, many retail traders are not aware of this fact: most technical indicators are developed for the stock market - not for the forex and not for the metals market. The apparent fact that you can not achieve consistent success in the metal market with old technical indicator theories and with the tools developed for stock marke
MarketMagnet
Kelly Adediran Raymond
Готовы ли вы выйти на новый уровень в своем торговом путешествии? Не ищите ничего, кроме MarketMagnet, этого новаторского индикатора, разработанного, чтобы стимулировать ваш торговый успех с волнением и точностью. Основанный на слиянии Momentum и CCI (индекс товарного канала), MarketMagnet предоставляет трейдерам окончательный инструмент для определения направления и цен входа для широкого спектра рекомендуемых валютных пар и инструментов. Если вы новичок, трейдер среднего уровня, у которого ес
Follow The Line MT5
Oliver Gideon Amofa Appiah
4.42 (31)
This indicator obeys the popular maxim that: "THE TREND IS YOUR FRIEND" It paints a GREEN line for BUY and also paints a RED line for SELL. (you can change the colors). It gives alarms and alerts of all kinds. IT DOES NOT REPAINT and can be used for all currency pairs and timeframes. Yes, as easy and simple as that. Even a newbie can use it to make great and reliable trades. NB: For best results, get my other premium indicators for more powerful and reliable signals. Get them here: https://www.m
FREE
The Penta-O is a 6-point retracement harmonacci pattern which usually precedes big market movements. Penta-O patterns can expand and repaint quite a bit. To make things easier this indicator implements a twist: it waits for a donchian breakout in the right direction before signaling the trade. The end result is an otherwise repainting indicator with a very reliable trading signal. The donchian breakout period is entered as an input. [ Installation Guide | Update Guide | Troubleshooting | FAQ | A
Free automatic Fibonacci is an indicator that automatically plots a Fibonacci retracement based on the number of bars you select on the BarsToScan setting in the indicator. The Fibonacci is automatically updated in real time as new highest and lowest values appears amongst the selected bars. You can select which level values to be displayed in the indicator settings. You can also select the color of the levels thus enabling the trader to be able to attach the indicator several times with differe
FREE
CSP eurusd Strategy
Francisco Tomas Moreno Garcia
Стратегия CSP. Эта стратегия основана на определенном типе паттерна на свечах (наилучшая производительность на таймфрейме 1H). Бэктест и оптимизация были выполнены на внешних исторических данных, поэтому бэктест, выполненный на meta trader5 не покажет таких же хороших результатов, тем не менее, помимо бэктеста, мы провели реальный тест в течение 1 недели с 2023.03.27 по 2023.0330, результаты представлены на изображениях. Подсказки для улучшения этой (и большинства других) стратегий. Как не
A powerful oscillator that provide Buy and Sell signals by calculating the investor liquidity. The more liquidity the more buy possibilities. The less liquidity the more sell possibilities. Please download the demo and run a backtest! HOW IT WORKS: The oscillator will put buy and sell arrow on the chart in runtime only . Top value is 95 to 100 -> Investors are ready to buy and you should follow. Bottom value is 5 to 0 -> Investors are ready to sell and you should follow. Alert + sound will app
С этим продуктом покупают
IVISTscalp5
Vadym Zhukovskyi
5 (5)
Что нового в индикаторе прогнозов iVISTscalp5 (Версия 10)? iVISTscalp5 – это авторская система прогнозов для любого финансового инструмента на неделю вперед (для быстрого скальпинга по уровням времени). iVISTscalp5 – инструмент для простого изучения и понимания финансового рынка. 1)     Индикатор прогнозов iVISTscalp5 полностью переписан на другой язык программирования ( C ++), что ускорило загрузку и обработку данных. Разное графическое отображение прогнозов на графике будет еще проще для п
Contact us to receive a comprehensive user guide after purchasing. William Delbert Gann, commonly known as W.D. Gann, was an exceptional market analyst renowned for his unique trading style in the early 20th century.  His trading techniques were based on a blend of mathematics, geometry, astrology, and ancient mathematics. Gann believed that stock market movements followed specific patterns and cycles, rather than being random. His methodologies, celebrated for their accuracy and relevance, con
Индикатор предназначен для того, чтобы вовремя закрывать позиции по рынку. Например: досрочно фиксировать прибыль, если цена не достигла TakeProfit, а рынок разворачивается. Индикатор анализирует импульс, а не тренд. О тренде никакой информации он не дает. Индикатор хорошо подходит для поиска дивергенции. Индикатор Ershov 38 Parrots динамически подстраивается под рынок и выявляет импульсы движения цены средней и высокой амплитуды. На мелкие скачки цены почти не реагирует.  Принципиальное о
VIP Buy Sell Signals
Hapu Arachchilage Tharindu Lakmal
Here is a Live DEMO testing account for the indicator. ( Profit proofs ) Login (MT5) - 100246 Server - FusionMarkets-Demo Investor PW - VIPindicator@2024 Click bellow link to download the FREE strategy PDF for this indicator   (Google Drive) Download Strategy Introduction   The   "Buy Sell Signals"   is designed to provide BUY and SELL trade signals based on the current market conditions.   A   Profitable   Trading Strategy   (Chee sheet)   is provided for this trading indicator.   (Read the
note: this indicator is for METATRADER4, if you want the version for METATRADER5 this is the link:  https://www.mql5.com/it/market/product/108106 TRENDMAESTRO ver 2.4 TRENDMAESTRO recognizes a new TREND in the bud, he never makes mistakes. The certainty of identifying a new TREND is priceless. DESCRIPTION TRENDMAESTRO identifies a new TREND in the bud, this indicator examines the volatility, volumes and momentum to identify the moment in which there is an explosion of one or more of these data a
The "No Reversal Accumatrix AI" is a cutting-edge MetaTrader 5 indicator designed to assist traders in confirming trends without the inconvenience of repainting. Built upon advanced artificial intelligence algorithms, this indicator offers a reliable tool for identifying and validating trends in financial markets. Key Features: Non-Repainting Technology : Unlike traditional indicators prone to repainting, the "No Reversal Accumatrix AI" utilizes innovative algorithms to provide accurate trend co
ЭТОТ ИНДИКАТОР, ОСНОВАННЫЙ НА ИСКУССТВЕННОМ ИНТЕЛЛЕКТЕ, определяет возможные точки разворота рынка, считывая следы, и ЗАРАНЕЕ сигнализирует о небольших движениях рынка до того, как они произойдут. В отличие от индикаторов цены и объема, которые генерируют «поздние» входы, т. е. когда подтверждение цены или объема уже произошло при изменении направления и, следовательно, часто движение уже закончилось, этот индикатор сигнализирует, основываясь на том, что он читает в след, «КОГДА ДВИЖЕНИЕ ДОЛЖНО
VTrende Pro
Andrii Diachenko
5 (1)
VTrende Pro - МТФ индикатор для трендовой торговли с панелью индикации для МТ5 !!! - Подробное описание на русском языке под видео (на Youtube) - !!! Хотя сигналы индикатора VTrende Pro можно использовать, как сигналы полноценной торговой системы, рекомендуется применять их в связке с ТС Билла Вильямса. VTrende Pro - это расширенная версия индикатора VTrende . Отличие Pro версии от VTrende: - Временные зоны - Сигнал V - сигнал 1-2 волн Основная задача индикатора - определить точки изм
RAD CRITICAL LEVES RAD indicator tracks “Relevant Volume” in real time, identifying accumulation and distribution processes, projecting them in the chart as SUPPORT or RESISTANCE zones. Natural   support   and resistance levels are generated by Volume Accumulation and Distribution processes. As these processes evolve, levels at which the relevant volume in the market place is positioned, become difficult areas to cross upwards or downwards. By using this information, traders can identify very s
Indicador en MQL5, que obtiene el promedio de 10 EMAS, que son alineadas según Fibonacci, obteniendo un promedio, que sera suavizado.  Se puede ingresar un numero desde 2 a N, que multiplica a los EMA-Fibonacci. Funciona en cualquier criptomoneda, etc. etc... pudiendo calcular el futuro segun la tendencia de las EMAS. Funciona excelentemente en tramos largos, determinando exactamente el mejor inicio/salida. El precio inicial por apertura sera por un periodo de tiempo, luego aumentará.
TREND HARMONY MT5 – Multi Timeframe Trend and Phase and Pullback Level Visualizer indicator for Metatrader5 The TREND HARMONY indicator automates deep trend analysis and generates visualizations for you. Take control of your trades by eliminating uncertainty! Revolutionize your trading experience with precision and insight through the TREND HARMONY Multi Timeframe indicator – your ultimate MT5 trend visualization indicator. [  Features and Manual   | MT4 version |   All Products   ] Are you t
EQ Cutrim Theory
Marco Aurelio Santos Costa
Ронал Кутрим в течение 14 лет был увлеченным математиком с более чем 10-летним опытом работы на финансовом рынке. Концепция теории проста - найти дисбаланс между покупателями и продавцами. В этом есть большой смысл, потому что ничто не растет вечно, ничто не падает вечно.   Когда вы находите актив с математической вероятностью неравновесного равновесия, это отличный способ заняться трейдингом:  Включите субтитры, видео сопровождается субтитрами
Технический индикатор Smooth Price (Гладкая цена) используется для построения гладкой линии максимально приближенной к цене торгового инструмента и служит для устранения ее шумовых составляющих. Индикатор является частью торговой системы Monarch, но здесь он представлен как самостоятельный инструмент технического анализа. Основой индикатора служит кластерный цифровой фильтр , который, в отличии от проекта ClusterSMA , применяется непосредственно к ценовой таймсерии. Smooth Price не перерисовывае
Классификатор силы тренда. Показания на истории не меняет. Изменяется классификация только незакрытого бара. По идее подобен полной системе ASCTrend, сигнальный модуль которой, точнее его аппроксимация в несколько "урезанном" виде, есть в свободном доступе, а также в терминале как сигнальный индикатор SilverTrend . Точной копией системы ASCTrend не является. Работает на всех инструментах и всех временных диапазонах. Индикатор использует несколько некоррелируемых между собой алгоритмов для класси
Indicador en base a la pendiente de la linea de precio, dibuja una línea de color cuando sube a base de los precios que previamente has sido procesados o linealizados, y cuando baja la pendiente la linea linealizada toma otro color. En este caso se a considerado 6 lineas de diferentes procesos desde pendientes largas hacia las cortas, observándose que cuando coincidan las pendientes se produce un máximo o mínimo, lo que a simple vista nos permitirá hacer una COMPRA O VENTA.
Индикатор Coefficient Of Determination (COD) представляет собой значение коэффициента детерминации или квадрат коэффициента корреляции между зависимой переменной — ценой и объясняющей переменной — тиковым объемом. Что это дает нам на практике? COD отлично распознает кульминацию трендовых движений, что позволяет подбирать оптимальные точки и ловить развороты рынка. Как использовать индикатор: Наиболее популярная торговая стратегия строится совместно с трендовым индикатором Moving Average (MA), пе
Fibonacci Múltiple 12, utiliza la serie fibonacci plasmado en el indicador fibonacci, aumentadolo 12 veces según su secuencia. El indicador fibonacci normalmente muestra una vez, el presente indicador se mostrara 12 veces empezando el numero que le indique siguiendo la secuencia. Se puede utilizar para ver la tendencia en periodos cortos y largos, de minutos a meses, solo aumentado el numero MULTIPLICA.
Recommended TimeFrame >= H1. 100% Non Repainted at any moment.  Use it carefully, only with Trend Direction. Trading Usage: 2 Variants: as Range System or as BreakOut System (Both Only With Trend Direction)::: (Always use StopLoss for minimise Risk); [1] as Range System: (Recommended) in UP TREND:  - BUY in Blue Line , then if price goes down by 50 points (on H1) open Second BUY.   Close in any Profit you wish: TrailingStop(45 points) or Close when Price touches upper Gold Line. in DOWN TR
En base a cálculos matemáticos de determino una linea Horizontal que cruza a todas las señales de trading, mostrando los máximos y mínimos. La linea horizontal parte en dos las subidas y bajadas de las señales de trading, de tan manera que es fácil identificar los máximos y mínimos, y es inteligente por que es sensible a las subidas y bajadas, afín de no quedarse en un solo lado por siempre, trabaja excelentemente con otros indicadores suavizadores ya que les garantiza que en un intervalo de tie
этот индикатор является индикатором детектора спайков, он специально разработан для обмена на Boom 1000, Boom 500, Crash 1000 и Crash 500 Мы рекомендуем использовать его только для индексов Deriv Boom и Crash. Его настройки интуитивно понятны, знакомы, просты в использовании имеет функции уведомления; звуковые уведомления и push-уведомления. этот инструмент прост в использовании, прост в обращении Это обновление основано на разных стратегиях для шипов.
Индикатор отслеживает тренд в 5 разных временах графика для одного и того же актива, основываясь на 6 сигналах для каждого времени графика. Основная цель индикатора - показать нам тенденцию большинства финансового актива, в котором он был размещен. Система передает информацию о тенденциях в несколько графических периодов, таким образом, пользователь может иметь широкое представление о движении актива, этот тип инструмента дает пользователю более высокую частоту обращений, помогая оператору в
панель просмотра тренда; Тенденция автосигналов Индикатор отслеживает тренд на 5 разных графиках одного и того же актива, основываясь на 6 сигналах для каждого графика. Основная цель индикатора - показать нам тренд большинства финансового актива, в который он был помещен. Система передает информацию о тенденциях в разное графическое время, таким образом, пользователь может иметь широкий обзор движения актива, этот тип инструмента позволяет пользователю иметь более высокий процент по
Indicador en MQL5, recibe la información del precio SUAVIZADO, lo procesa anulando los picos inteligentemente, y el resultado lo envía al desarrollo de la escalera que iniciara y subirá o bajara según el peldaño o INTERVALO ingresado Ingreso PERIODO = 50 (variar segun uso) Ingreso MULTIPLICA AL PERIODO = 1 (variar segun uso) Segun la configuración la escalera puede pegarse o separarse de los precios,, Se aplica toda la linea de tiempo, y a todas las divisas, etc.  
Micro  ******************* Секундные графики MT5 ********************** Более точного инструмента для входа в сделку вы не найдёте. Входные параметры: Timeframe, sek - период построения графика, секунды Displayed bars - отображаемые бары Step of price levels, pp, 0-off - шаг отрисовки ценовых уровней, пункты Scale points per bar, 0-off - масштаб в пунктах на бар Show lines - отображение текущих уровней Show comment - отображение комментария Standard color scheme - стандартная цветовая сх
QuantXMarketScanner is a multi assets indicator for MT5 - Mathematical model based on 7 custom moving averages indicators  - Adaptable on Currencies, Stocks and Crypto - Automatic setup, self optimized About QuantXsystem Products: –         Simple installation & integration into MT5   –         Unlimited License after purchase (for one user) –         Automatic pattern recognition to identify the best timing and price levels. –         Trading indicators are displayed directly and automatica
QuantXSTocks Trading Range Indicator for MT5: INSTRUCTIONS TO USE OUR INDICATOR:- User needs to take trade on Arrow or after an Arrow CandleStick, You can achieve up-to 35-125 pips target by this Indicator. Best Timeframes for Stocks and Indices are M30 and H1: AMAZON M30 (50 pips) TESLA M30 (50 pips) APPLE M30 (50 pips) ADOBE M30 (50 pips) NASDAQ100 H1 (125 pips) The above are the approximate amount of pips you can achieve by this Indicator, Green arrow appears to be buy arrow while the Red a
Super Suavizador
Cesar Juan Flores Navarro
Indicador en MQL5 que obtiene el promedio de 10 EMAS que son alineadas y procesadas según Fibonacci luego el promedio es suavizado"  Se ingresa un número de 2 a N que multiplica los EMA-Fibonacci y por consiguiente aumenta los fibonacci, resultando un promedio.   Se ingresa un número que suaviza los EMA-Fibonacci. Considerando los números 1/1 seria la suavización minima. Considerando los números 3/5 seria la suavización media. Considerando los números 10/30 seria la suavización alta.....etc
Trend and Signals MT5  indicator scans  30 trading Instruments (Forex, Metals and Indices).     It uses special algorithm on the  current market   based on   Pure Price Action   and display the overall trend and signal on the dashboard. When signals are produced the indicator sends alert and notification. Strategy for Signals This indicator uses the daily timeframe to determine the direction of the trend. The hourly timeframe is used to identify possible entries. Main trend and is determined by
This indicator is based on the crossing of two Moving Average with the RSI It is intended for scalpers Specially designed for Boom and Crash syhtetic indices from Binary.com/Deriv.com It is easy to use and intuitive. We recommend its use on M1 and is equipped with three types of notification Email alert Sound notification Push notification these parameters can be activated and deactivated.
Этот индикатор предлагает солидный метод анализа рынка, основанный на концепции 'Инструмента регрессионного канала'. Путем использования этого инструмента трейдеры могут получить исключительный контроль над регрессионным каналом своего графика, что позволяет принимать более обоснованные торговые решения. Инструмент регрессионного канала является мощным инструментом в арсенале трейдера. Он разработан для предоставления ценной информации о тенденциях цен и потенциальных уровнях поддержки и сопроти
Другие продукты этого автора
This indicator is a unique, high quality and affordable trading tool because we have incorporated a number of proprietary features and a new formula. With this update, you will be able to show double timeframe zones. You will not only be able to show a higher TF but to show both, the chart TF, PLUS the higher TF: SHOWING NESTED ZONES. All Supply Demand traders beautifully integrated with Moving Average Clouds. I am sure you will love it. Tips User Manual Use my template  Optimize Zone Strength f
This product is designed for the MT5 platform and offers two key features: VWAP (Volume Weighted Average Price) calculation and Volume Profile analysis. Advantages: VWAP Calculation: The product calculates the VWAP, which is a popular indicator used by traders to determine the average price of a security based on its trading volume. It helps identify potential buying or selling opportunities by comparing the current price to the average price weighted by volume. Volume Profile Analysis: The prod
Фильтр:
Нет отзывов
Ответ на отзыв