Market Structure Hh Hl Lh Ll
- Индикаторы
- Vladimir Karputov
- Версия: 1.25
- Обновлено: 27 июля 2024
- Активации: 5
Description :
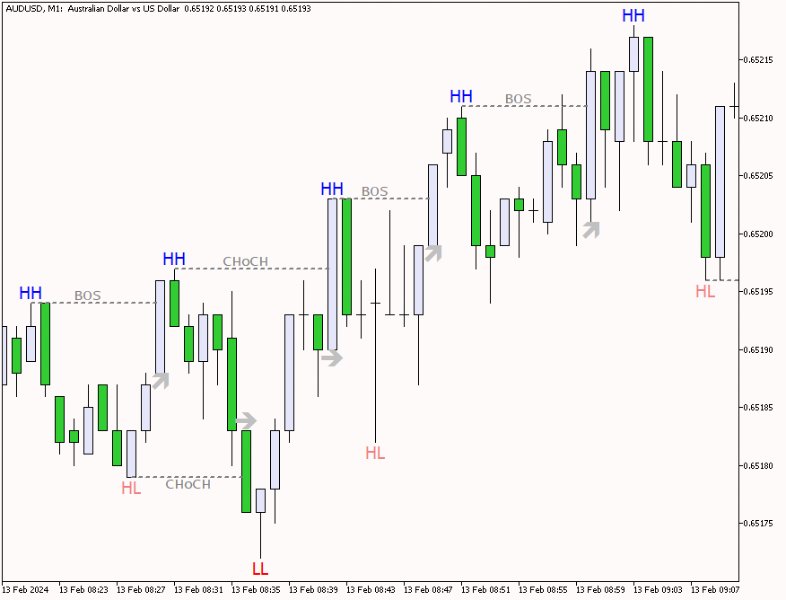
The "Market Structure HH HL LH LL" indicator is a powerful and at the same time simple tool for analyzing price dynamics in financial markets. This indicator helps traders and investors identify changes in trends and identify important points in price time series. Displays "BOS" and "CHoCH" lines.
Key components of the indicator:
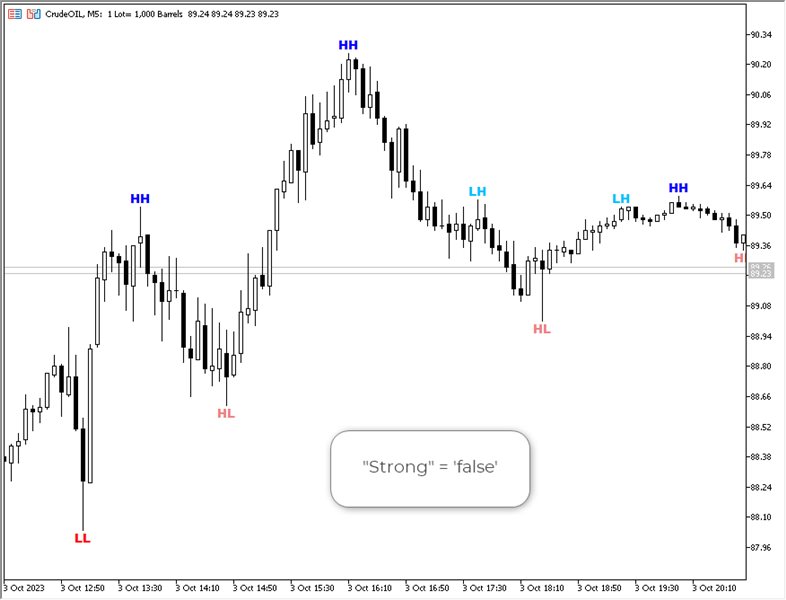
HH (Higher High): The top at which the price closes above the previous high top. HH indicates a strengthening uptrend.
HL (Higher Low): The minimum at which the price closes above the previous low. HL confirms the continuation of the upward trend.
LH (Lower High): A top where price closes below the previous high. LH signals a possible trend reversal.
LL (Lower Low): The minimum at which the price closes below the previous low. LL confirms the beginning of a downtrend.
How to use:
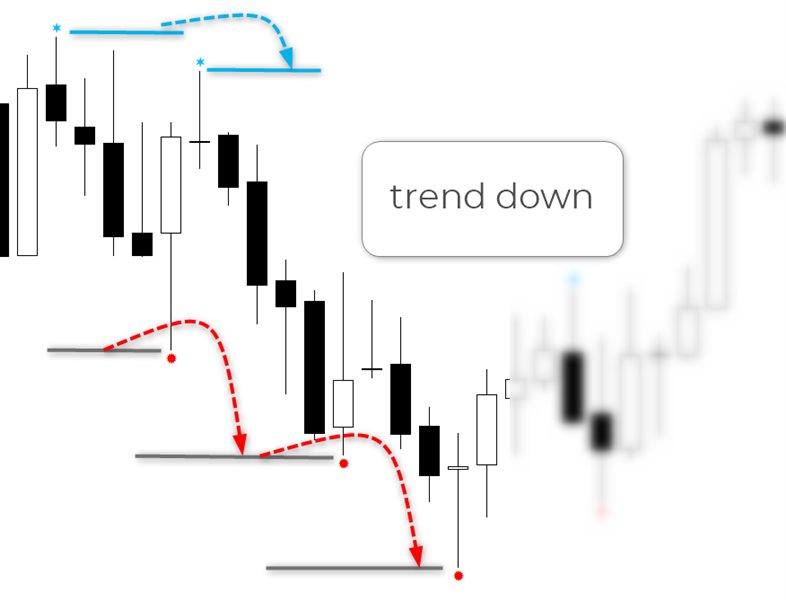
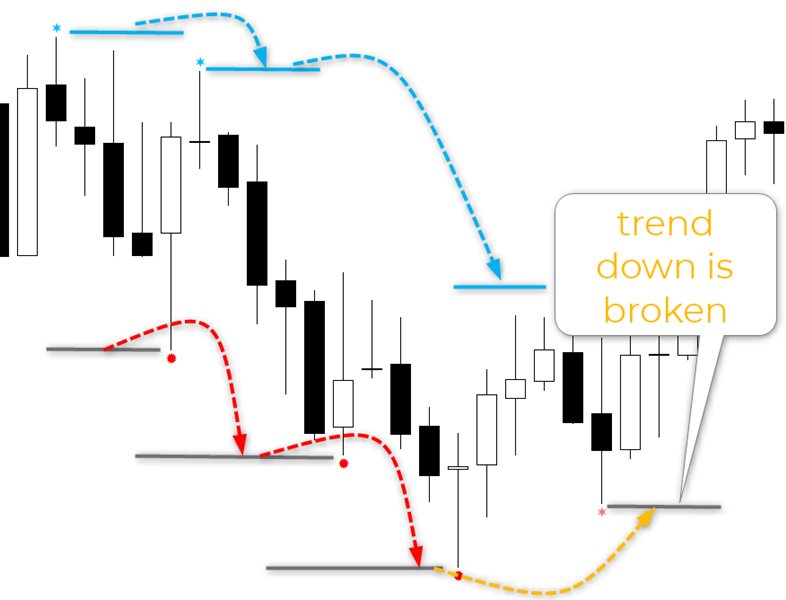
The "Market Stucture HH HL LH LL" indicator helps traders and investors determine the current trend in the market. An uptrend is characterized by a sequence of HH and HL, and a downtrend is characterized by a sequence of LH and LL. When the trend changes, it can be a signal to open or close a position in the market.
Usage example:
Let's say you have a long position in a stock and the indicator shows a sequence of LH and LL, indicating the possible start of a downtrend. This may be a signal to close a position or set a stop limit.
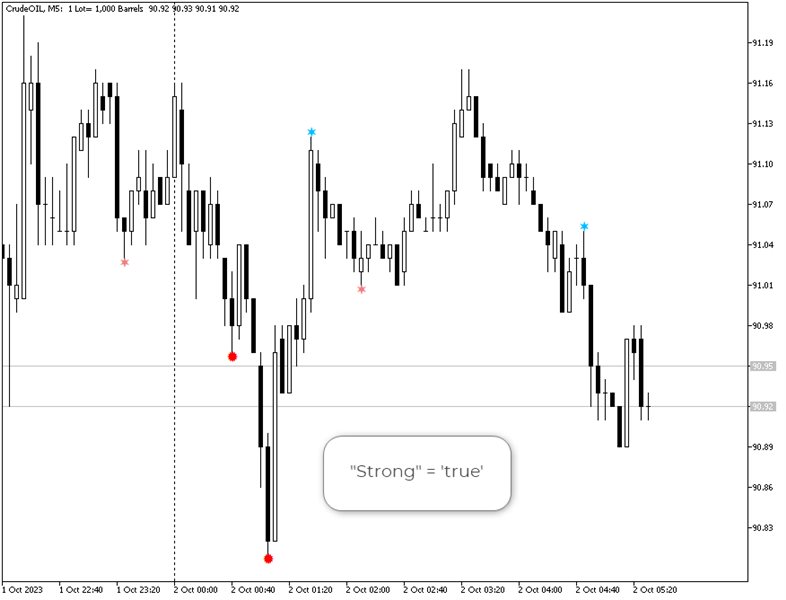
The pictures below show an example of a downward trend and an example of when this trend was broken.

















Пользователь не оставил комментарий к оценке