• Обзор
  • Отзывы (1)
  • Обсуждение (10)
  • Что нового

Investment Castle RSI Divergence MT5

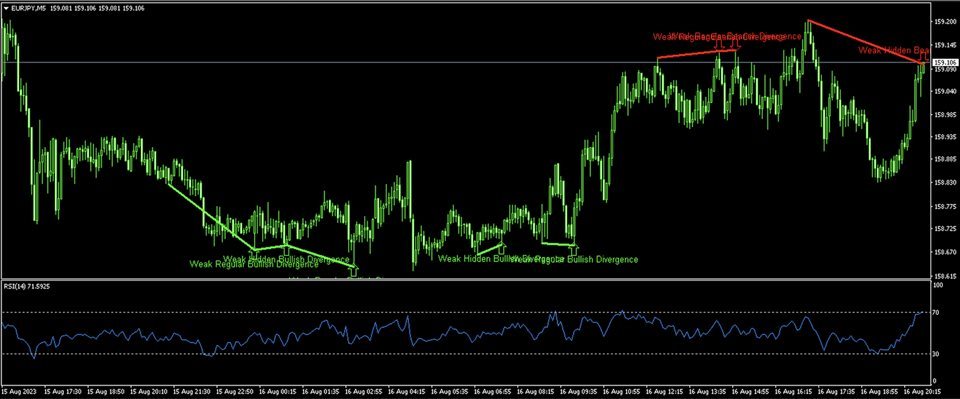
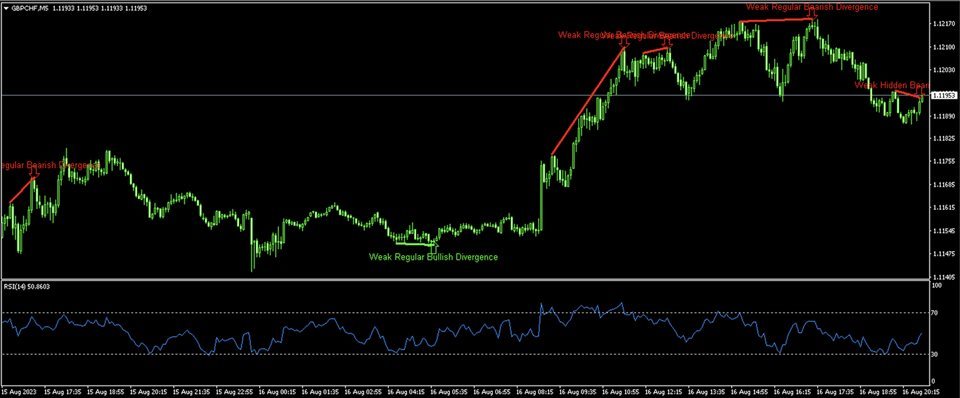
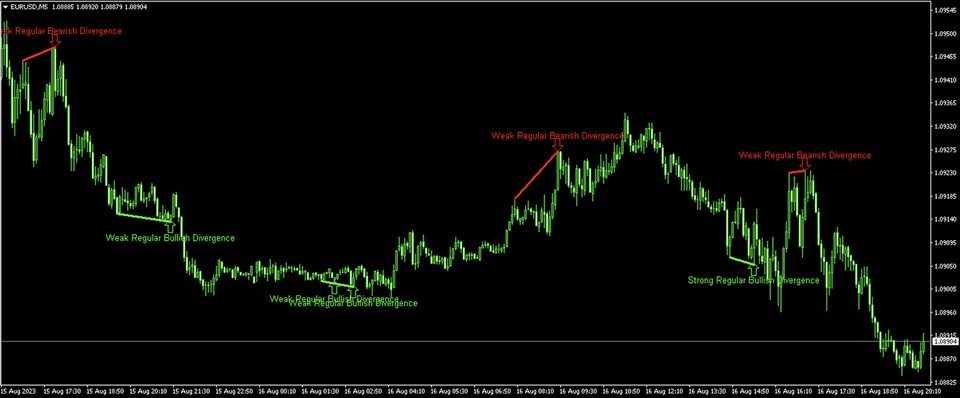
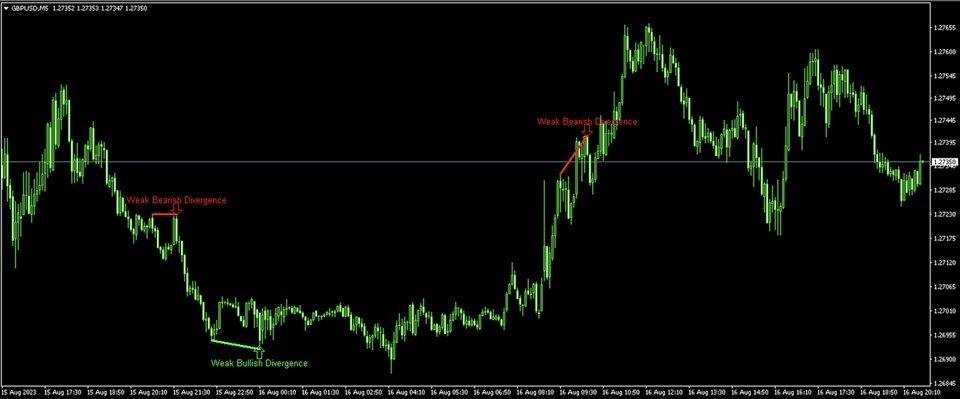
The RSI Divergence Indicator is a powerful tool designed to identify potential reversals in the market by spotting discrepancies between the Relative Strength Index (RSI) and price movement. Divergences can be a significant indication of an impending trend change, either from bullish to bearish or vice versa. This indicator is built for making the task of identifying potential trade opportunities more straightforward and efficient.


Features:

  1. Automatic Detection: The indicator scans the chart for RSI divergences and automatically plots arrows to signal potential trade opportunities.
  2. Buy and Sell Signals:
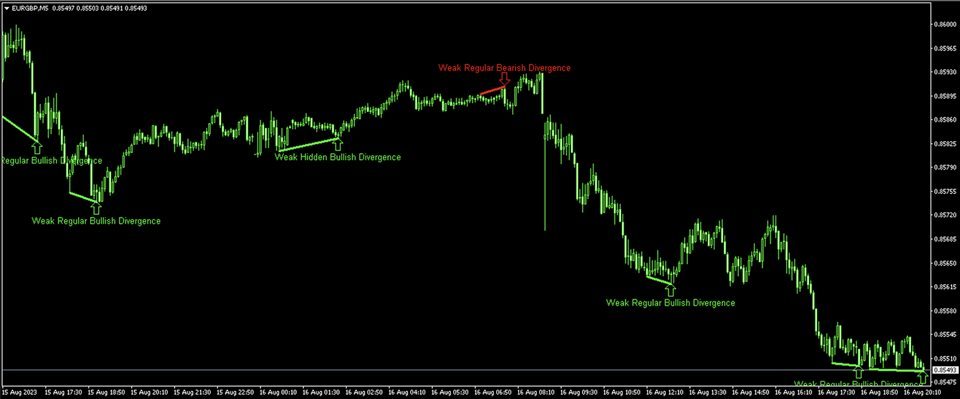
    • Green Upward Arrow: Suggests a potential buy opportunity based on bullish RSI divergence.
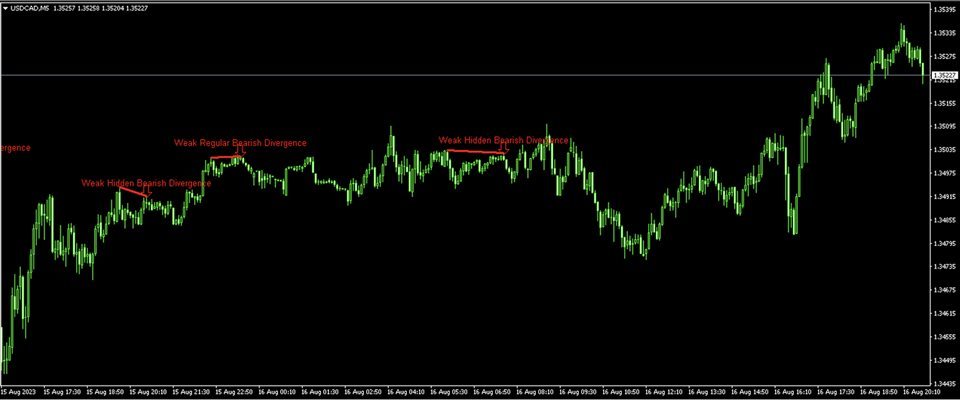
    • Red Downward Arrow: Suggests a potential sell opportunity based on bearish RSI divergence.
  3. Divergence Strength Identification: The indicator differentiates between weak and strong divergences, giving traders more nuanced insight. 
    • Strong Divergence: Denoted by a bold arrow.
    • Weak Divergence: Denoted by a fainter arrow.
  4. Mobile Notifications: Built-in mobile notification feature ensures that you never miss a potential trading signal, even when you're on the move. Once a divergence is spotted, the indicator sends a push notification to your mobile device.
  5. Customizable Settings: Users can adjust the RSI period, overbought and oversold levels, and other settings to tailor the indicator to their trading style and preferences.

How It Works:

  1. Bullish Divergence (Buy Signal): Occurs when the price forms a new lower low, but the RSI forms a higher low. This discrepancy may indicate a potential upward reversal.
  2. Bearish Divergence (Sell Signal): Occurs when the price forms a new higher high, but the RSI forms a lower high. This discrepancy may suggest a potential downward reversal.
  3. Strength of Divergence: The distinction between weak and strong divergences is based on the difference in the price and RSI peaks/troughs. A greater discrepancy denotes a strong divergence, while a smaller one indicates a weak divergence.

Use Cases:

  • Trend Identification: Traders can use RSI divergences to identify potential beginnings or ends of trends.
  • Risk Management: By recognizing potential reversals, traders can adjust stop-loss and take-profit levels accordingly.
  • Strategy Integration: The RSI Divergence Indicator can be integrated with other trading strategies to provide added layers of confirmation.

Note:

Trading on the basis of divergences alone can be risky. It's crucial to utilize other technical analysis tools and methods for confirmation. Always use appropriate risk management techniques to protect your capital.


Рекомендуем также
Just another   Auto Fibonacci Retracement indicator . However, this is the most   Flexible   &   Reliable   one you can find for FREE. If you use this indicator and you like it, please leave a review/comment. If you just looking for a powerful indicator, please check this   Timeframes Trend Scanner indicator ### FEATURES ### Auto-calculate up to 7 Fibonacci levels on your customized frame. Adjust levels as your need. Use High/Low price or  Open/Close price to calculate. Freeze the levels and don
FREE
Introducing the Consecutive Green/Red Candle Alert Indicator for MT5 - Your Trend Spotting Companion! Are you ready to take your trading to the next level? We present the Consecutive Green/Red Candle Alert Indicator, a powerful tool designed to help you spot trends and potential reversals with ease. Whether you're a new trader looking for clarity in the market or an experienced pro seeking additional confirmation, this indicator is your trusted companion. Key Features of the Consecutive Green
FREE
This indicator is an automated version of the Fibonacci retracement (Fib) indicator. Deciding the best areas to use when drawing the fib can be tricky and this  indicator was made with that in mind. When you drop it on the chart it will automatically choose the best points to draw the fib with, but in case you aren't satisfied with those regions, you can adjust it as you wish.
FREE
RSI divergence indicator finds divergences between price chart and   RSI   indicator and informs you with alerts (popup, mobile notification or email). Its main use is to find trend reversals in the chart. Always use the divergence indicators with other technical assets like support resistance zones, candlestick patterns and price action to have a higher possibility to find trend reversals. Three confirmation type for   RSI   divergences: RSI   line cross 50 level Price returns to previous H/L C
FREE
Данный индикатор повторяет широко известную версию индикатора для MetaTrader 4, который есть в интернете в свободном доступе. Индикатор не перерисовывается. Индикатор реализует стратегию прорыва. Стрелки показывают направления рынка. Используйте индикатор на интервалах от M15 и выше. Индикатор рисует две полосы возле ценового действия и генерирует сигналы при закрытии цены под нижней и над верхней полосой. Для расчета нижнего и верхнего порога полос индикатор использует периодические максимумы и
FREE
Мультитаймфреймовый трендовый индикатор, на основе индикатора ADX / ADXWilder c уровнями Фибоначчи Индикатор показывает трендовые участки, используя данные индикатора ADX или ADXWilder с нескольких таймфреймов. Импульсный режим индикатора позволяет поймать начало тренда, а несколько "Экранов" с разными таймфреймами позволяют отфильтровать рыночный шум. На график цены добавляются уровни Фибоначчи, которые имеют гибкие настройки. Принцип работы индикатора: если PDI больше NDI, то устанавливается
FREE
Peak Trough Analysis - отличный инструмент для обнаружения пиков и впадин на графике. Peak Trough Analysis может использовать три разных алгоритма обнаружения пиков и впадин. Эти три алгоритма включают в себя оригинальный индикатор Fractals Билла Вильямса, модифицированный индикатор Fractals и индикатор ZigZag. Вы можете использовать этот инструмент анализа пиков и впадин для обнаружения паттернов, составленных Равновесным Фрактально-Волновым процессом. Для дальнейшего использования имеется хоро
FREE
ZigZag Support Resistance
Emmanuel Tshepang Mosweu
5 (3)
This indicator uses the Zigzag indicator to identify swing highs and swing lows in the price chart.  Once it has identified the swing highs and swing lows, it can use them to determine potential support and resistance levels. A support level is formed when the price drops and bounces back up from a swing low, indicating that there is buying pressure at that level. A resistance level is formed when the price rises and reverses downward from a swing high, suggesting selling pressure at that level.
FREE
Индикатор показывает на графике   круглые уровни . Их еще называют   психологическими , банковскими или уровнями основных игроков. На этих уровнях происходит настоящая борьба быков и медведей, накопление множества ордеров, что приводит к повышенной волатильности. Индикатор   автоматически   подстраивается под любой инструмент и таймфрейм. При пробитии и последующем тесте уровня   80 - покупаем . При пробитии и последующем тесте уровня   20 - продаём . Цель - 00. Внимание. Из-за сильных уровней
FREE
IMA Finder MT5
Mubashir Mohamed Quraish Albarakat
1 (1)
This indicator is designed based on the Moving Origin indicator When the moving origin indicator breaks the price, this indicator gives a signal It is useful for better viewing of signals and analysis on them Attributes: Can be used in all symbols Can be used in all time frames Too many signals Simple and quick settings Easy way to work Settings: period: like moving average settings alarmShow: If you want to receive an alert in Metatrader after receiving the signal, enable this setting alarmS
FREE
Unlock the Secrets of Market Structure with the Golden Key Fibonacci Indicator! The Golden Key Fibonacci Indicator is a meticulously crafted tool for traders who want to harness the power of Fibonacci retracement and extension levels in their trading. Designed for precision, this indicator provides a clear visual framework to identify critical price levels, giving traders the confidence to analyze and execute their strategies. Key Features & Logic Behind the Indicator: 1️⃣ Fibonacci Ret
Basic Harmonic Pattern MT5
Mehran Sepah Mansoor
4.79 (73)
Этот индикатор определяет наиболее популярные гармонические паттерны, которые предсказывают точки разворота рынка. Эти гармонические паттерны представляют собой ценовые формации, которые постоянно повторяются на рынке Форекс и указывают на возможные будущие движения цены /   Бесплатная версия MT4 Кроме того, данный индикатор имеет встроенный сигнал входа в рынок, а также различные тейк-профиты и стоп-лоссы. Следует отметить, что хотя индикатор гармонических паттернов может сам по себе давать с
FREE
RSI on Moving Average Indicator for MT5 Introduction The RSI on MA Indicator integrates Moving Average Crossovers with the Relative Strength Index (RSI) to enhance trend detection and momentum analysis. By merging these technical elements, it improves precision in identifying market movements. The indicator displays two oscillating lines ranging from 0 to 100, making it easier to pinpoint buy and sell opportunities while clarifying trend directions. RSI on Moving Average Indicator Specification
FREE
Данный индикатор рисует линии тренда на графике. У индикатора есть шесть входных параметров. Пользователь может выбрать вид линий. При использовании нескольких копий индикатора вид линий должен отличаться. Пользователь может задать толщину и цвет линий, а также глубину - этот параметр определяет, какие пики и впадины будут использоваться. Например, если ввести Depth=10, то трендовые линии будут построены по текущим пикам и впадинам, справа и слева от которых есть по 10 баров с меньшими/большими
FREE
BUY INDICATOR AND GET EA FOR FREE AS A BONUS + SOME OTHER GIFTS! ITALO LEVELS INDICATOR  is the best levels indicator ever created, and why is that? Using high volume zones on the market and Fibonacci the Indicator works on all time-frames and assets, indicator built after 7 years of experience on forex and many other markets. You know many levels indicators around the internet are not complete, does not help, and it's difficult to trade, but the   Italo Levels Indicator is different , the Ital
Мультитаймфреймовый трендовый индикатор, на основе индикатора ADX / ADXWilder Индикатор показывает трендовые участки, используя данные индикатора ADX или ADXWilder с нескольких таймфреймов. Импульсный режим индикатора позволяет поймать начало тренда, а несколько "Экранов" с разными таймфреймами позволяют отфильтровать рыночный шум. Принцип работы индикатора: если PDI больше NDI, то устанавливается бычье движение; если PDI меньше NDI, то устанавливается медвежье движение; для определения какого-
FREE
Индикатор определяет и отображает на графике паттерн М. Гартли "Бабочка". Выделение паттерна производится по вершинам индикатора ZigZag (включен в ресурсы, не требует допопнительной установки). В момент распознавания паттерна выводится сообщение во всплывающем окне, отправляются оповещения на мобильное устройство и электронный почтовый ящик. Схема паттерна и параметры волн приведены на скриншоте. Параметры, заданные в индикаторе по умолчанию, являются демонстрационными для увеличения количества
Индикатор строит кривую разности значений двух торговых инструментов (валютных пар). Назначение индикатора - наблюдение процессов расхождения и схождения значений двух торговых инструментов. Полученные результаты могут использоваться для торговли по стратегиям статистического арбитража, парного трейдинга, корреляции, и другим. Стратегия торговли Индикатор прикрепляется к графику любого торгового инструмента. Во входных параметрах задаются названия торговых инструментов, разность значений которы
FREE
Free automatic Fibonacci is an indicator that automatically plots a Fibonacci retracement based on the number of bars you select on the BarsToScan setting in the indicator. The Fibonacci is automatically updated in real time as new highest and lowest values appears amongst the selected bars. You can select which level values to be displayed in the indicator settings. You can also select the color of the levels thus enabling the trader to be able to attach the indicator several times with differe
FREE
Moving Average Convergence Divergence (MACD) торговая стратегия - это популярный инструмент технического анализа, который используется для выявления изменений в импульсе и направлении тренда. MACD рассчитывается путем вычитания 26-периодного экспоненциального скользящего среднего (EMA) из 12-периодного EMA. Затем на вершине MACD строится 9-периодное EMA, называемое "линией сигнала", которое действует как триггер для сигналов покупки и продажи. MACD считается находящимся в бычьей территории, когд
FREE
Индикатор определяет, когда происходит расхождение между ценой и индикатором или осциллятором. Он выявляет как регулярные, так и скрытые расхождения. В сочетании с вашими собственными правилами и методами этот индикатор позволит вам создать (или улучшить) вашу собственную мощную систему. Функции Может обнаруживать дивергенции для следующих осцилляторов / индикаторов:       MACD, OsMA, Stochastics, RSI, CCI, RVI, Awesome, ADX, ATR, OBV, композитный индекс, MFI и моментум. Можно выбрать только од
FREE
ADXW Cloud
Shahabeddin Baset
4.6 (5)
This is Wilder's ADX with cloud presentation of DI+ & DI- lines. Features 4 standard lines of the ADX indicator: DI+, DI-, ADX, ADXR cloud presentation of DI+/DI- lines with transparent colors applicable to all time-frames and all markets What Is ADX J. Welles Wilder Jr., the developer of well-known indicators such as RSI, ATR, and Parabolic SAR, believed that the Directional Movement System, which is partially implemented in ADX indicator, was his most satisfying achievement. In his 1978 book,
FREE
ToolBot Probabilistic Analysis - FREE   An effective indicator for your negotiations The toolbot indicator brings the calculation of candles and a probabilistic analysis so that you have more security on your own. Also test our  FREE tops and bottoms indicator: :   https://www.mql5.com/pt/market/product/52385#description Also test our  FREE (RSI, ATR, ADX, OBV) indicator:   https://www.mql5.com/pt/market/product/53448#description Try our EA ToolBot for free:   https://www.mql5.com/market/prod
FREE
Follow The Line MT5
Oliver Gideon Amofa Appiah
4.55 (31)
This indicator obeys the popular maxim that: "THE TREND IS YOUR FRIEND" It paints a GREEN line for BUY and also paints a RED line for SELL. (you can change the colors). It gives alarms and alerts of all kinds. IT DOES NOT REPAINT and can be used for all currency pairs and timeframes. Yes, as easy and simple as that. Even a newbie can use it to make great and reliable trades. NB: For best results, get my other premium indicators for more powerful and reliable signals. Get them here: https://www.m
FREE
Трендовый индикатор на основе индикатора ADX / ADXWilder Индикатор показывает трендовые участки, используя данные индикатора ADX или ADXWilder. Принцип работы индикатора: если PDI больше NDI, то устанавливается бычье движение; если PDI меньше NDI, то устанавливается медвежье движение; если ADX меньше либо равен значению фильтра, указанного в параметрах, то состояние движения отсутствует. Входные параметры индикатора: Calculate Timeframe - таймфрейм для расчета; ADX Type - тип расчета ADX, на
FREE
Индикатор сканирует до 15 торговых инструментов и до 21 таймфрейма на наличие высоковероятностных моделей паттерна Двойная вершина/дно с ложными прорывами . Что определяет этот индикатор: Этот индикатор находит особую форму таких паттернов, так называемые двойных вершин и нижних частей, так называемый Двойная вершина/дно с ложными прорывами . Паттерн "Двойная вершина с ложными прорывами" формируется, когда максимальная цена правого плеча выше левого плеча. Паттерн "Двойное дно с ложными прорывам
FREE
Indicator and Expert Adviser  EA Available in the comments section of this product. Download with Indicator must have indicator installed for EA to work. Mt5 indicator alerts for bollinger band and envelope extremes occurring at the same time. Buy signal alerts occur when A bullish candle has formed below both the lower bollinger band and the lower envelope  Bar must open and close below both these indicators. Sell signal occur when A bear bar is formed above the upper bollinger band and upper
FREE
Данный индикатор является демо версией индикатора "All Harmonics 26" . Индикатор "All Harmonics 26" находит 26 типов гармонических паттернов и выводит их на график в удобном формате. Вы можете ознакомиться с документацией по некоторым параметрам индикатора здесь . Данная демо-версия имеет следующие ограничения: Индикатор ищет только один тип гармонических паттернов из 26 — Gartley. Индикатор выводит новые паттерны с опозданием на 10 баров. 
FREE
Necessary for traders: tools and indicators Waves automatically calculate indicators, channel trend trading Perfect trend-wave automatic calculation channel calculation , MT4 Perfect trend-wave automatic calculation channel calculation , MT5 Local Trading copying Easy And Fast Copy , MT4 Easy And Fast Copy , MT5 Local Trading copying For DEMO Easy And Fast Copy , MT4 DEMO Easy And Fast Copy , MT5 DEMO The homeopathic indicator is also called the CCI indicator. The CCI indicator was proposed
FREE
Это инновационный индикатор измерения силы валют от INFINITY является незаменимым помощником для скальперов и трейдеров торгующих в долгую. Система анализа Силы/слабости валют давно известна и применяется на рынке ведущими трейдерами мира. Любая арбитражная торговля не обходится без этого анализа. Наш индикатор легко определяет силу базовых валют по отношению друг к другу. Он выводит линейные графики по всем или по текущей паре валют, позволяя проводить мгновенный анализ и поиск наиболее сильны
FREE
С этим продуктом покупают
Раскройте силу торговли трендами с помощью индикатора Trend Screener: вашего идеального решения для торговли трендами, основанного на нечеткой логике и мультивалютной системе! Повысьте уровень своей торговли по тренду с помощью Trend Screener, революционного индикатора тренда, основанного на нечеткой логике. Это мощный индикатор отслеживания тренда, который сочетает в себе более 13 инструментов и функций премиум-класса и 3 торговые стратегии, что делает его универсальным выбором для превращения
FX Volume MT5
Daniel Stein
4.72 (18)
FX Volume: Оцените подлинную динамику рынка глазами брокера Краткий обзор Хотите вывести свою торговлю на новый уровень? FX Volume дает вам информацию в реальном времени о том, как розничные трейдеры и брокеры распределяют свои позиции — задолго до появления запаздывающих отчетов типа COT. Независимо от того, стремитесь ли вы к стабильной прибыли или ищете дополнительное преимущество на рынке, FX Volume поможет выявлять крупные дисбалансы, подтверждать пробои и совершенствовать управление риск
Golden Trend Indicator MT5
Noha Mohamed Fathy Younes Badr
4.86 (14)
Golden Trend indicator  is The best indicator for predicting trend movement this indicator never lags and never repaints and never back paints    and give  arrow buy and sell    before the candle appear  and it will help you and  will make your trading decisions clearer its work on all currencies and  gold and crypto and all time frame This unique  indicator uses very secret algorithms to catch the  trends, so you can trade using this indicator and see the trend clear on charts  manual guide and
FX Power: Анализируйте силу валют для более эффективной торговли Обзор FX Power — это ваш незаменимый инструмент для понимания реальной силы валют и золота в любых рыночных условиях. Определяя сильные валюты для покупки и слабые для продажи, FX Power упрощает принятие торговых решений и выявляет высоковероятные возможности. Независимо от того, хотите ли вы следовать за трендами или предсказывать развороты с использованием экстремальных значений дельты, этот инструмент идеально адаптируется под
IX Power MT5
Daniel Stein
4.83 (6)
IX Power: Получите рыночные инсайты для индексов, сырьевых товаров, криптовалют и форекс Обзор IX Power — это универсальный инструмент для анализа силы индексов, сырьевых товаров, криптовалют и форекс. В то время как FX Power предлагает наивысшую точность для валютных пар, используя данные всех доступных пар, IX Power фокусируется исключительно на данных рынка базового символа. Это делает IX Power отличным выбором для некорреляционных рынков и надежным инструментом для форекса, если вам не нуж
FX Levels: Исключительно точные уровни поддержки и сопротивления для всех рынков Краткий обзор Ищете надежный способ определить уровни поддержки и сопротивления для любых инструментов—валют, индексов, акций или сырьевых товаров? FX Levels сочетает традиционный «Lighthouse» метод с современным динамическим подходом, обеспечивая почти универсальную точность. Благодаря сочетанию опыта реальных брокеров и автоматических ежедневных плюс «в реальном времени» обновлений, FX Levels поможет вам выявлят
Важным ключевым элементом в трейдинге являются зоны или уровни, от которых принимаются решения о покупке или продаже торгового инструмента. Несмотря на попытки крупных игроков скрыть свое присутствие на рынке, они неизбежно оставляют следы. Наша задача заключалась в том, чтобы научиться находить эти следы и правильно их интерпретировать. ИНСТРУКЦИЯ RUS         INSTRUCTIONS  ENG           Рекомендуем использовать с индикатором -   TPSpro  TREND PRO -  Version MT4 - Бонус: 6 месяцев подписки н
TPSpro TREND PRO   —  трендовый индикатор, который автоматически анализирует рынок и предоставляет информацию о тренде и каждой его смене а также дающий сигналы для входа в сделки без перерисовки! Индикатор использует каждую свечу, анализируя их отдельно. относя к разным импульсам – импульс вверх или вниз. Точные точки входа в сделки  для  валют, крипты, металлов, акций, индексов! ИНСТРУКЦИЯ RUS         INSTRUCTIONS  ENG       Рекомендуем использовать с  индикатором -  RFI LEVELS Version MT4
Quantum TrendPulse
Bogdan Ion Puscasu
5 (12)
Представляем   Quantum TrendPulse   , совершенный торговый инструмент, который объединяет мощь   SuperTrend   ,   RSI   и   Stochastic   в один комплексный индикатор, чтобы максимизировать ваш торговый потенциал. Разработанный для трейдеров, которые ищут точность и эффективность, этот индикатор помогает вам уверенно определять рыночные тренды, сдвиги импульса и оптимальные точки входа и выхода. Основные характеристики: Интеграция SuperTrend:   легко следуйте преобладающим рыночным тенденциям и п
Скринер поддержки и сопротивления находится в одном индикаторе уровня для MetaTrader, который предоставляет несколько инструментов внутри одного индикатора. Доступные инструменты: 1. Скринер структуры рынка. 2. Зона бычьего отката. 3. Зона медвежьего отката. 4. Ежедневные опорные точки 5. еженедельные опорные точки 6. ежемесячные опорные точки 7. Сильные поддержка и сопротивление, основанные на гармоническом паттерне и объеме. 8. Зоны уровня берега. ПРЕДЛОЖЕНИЕ ОГРАНИЧЕННОЕ ВРЕМЯ: Индикатор подд
Сейчас 147 долл. США (увеличиваясь до 499 долл. США после нескольких обновлений) - неограниченные учетные записи (ПК или Mac) Руководство пользователя + Обучающие видео + Доступ к приватному Discord-каналу + VIP-статус и мобильная версия + Лицензия на 5 ПК с неограниченным количеством аккаунтов и терминалов MT4. Сколько раз вы покупали индикатор торговли с замечательными обратными тестами, доказательствами производительности на живых счетах и зашикарными цифрами и статистикой, но после исполь
Gold Stuff mt5
Vasiliy Strukov
4.92 (173)
Gold Stuff mt5 - трендовый индикатор, разработанный специально для золота, также может использоваться на любых финансовых инструментах. Индикатор не перерисовывается и не запаздывает. Рекомендуемый тайм-фрейм H1.  Свяжитесь со мной сразу после покупки для получения   персонального бонуса!   Вы можете получить бесплатную копию нашего индикатора Strong Support and Trend Scanner, пожалуйста, в личку. мне! Настройки и мануал  здесь ПАРАМЕТРЫ Draw Arrow -   вкл.выкл. отрисовку стрелок на графике. Al
Bill Williams Advanced предназначен для автоматического анализа графика по системе " Profitunity " Билла Уильямса. Индикатор анализирует сразу четыре таймфрейма. Инструкция/Мануал ( Обязательно читайте перед приобретением ) Преимущества 1. Автоматически анализирует график по системе "Profitunity" Билла Уильямса. Найденные сигналы помещает в таблицу в углу экрана. 2. Оснащён трендовым фильтром по индикатору Аллигатор. Большинство сигналов системы рекомендуется использовать только по тренду. 3. На
Эта панель показывает последние доступные   гармонические паттерны   для выбранных символов, так что вы сэкономите время и будете более эффективны /   MT4 версия . Бесплатный индикатор:   Basic Harmonic Pattern Колонки индикатора Symbol:   отображаются выбранные символы Trend   :   бычий или медвежий Pattern   :   тип паттерна (Гартли, бабочка, летучая мышь, краб, акула, шифр или ABCD) Entry   :   цена входа SL:   цена стоп-лосса TP1:   цена первого тейк-профита TP2:   цена второго тейк-профи
Matrix Arrow Indicator MT5
Juvenille Emperor Limited
5 (13)
Индикатор Matrix Arrow MT5   — это уникальный индикатор тренда 10 в 1, следующий за   100% неперерисовывающимся   индикатором с несколькими таймфреймами, который можно использовать на всех символах/инструментах:   форекс ,  товары ,   криптовалюты ,   индексы ,  акции . Индикатор Matrix Arrow MT5  будет определять текущую тенденцию на ранних этапах, собирая информацию и данные от до 10 стандартных индикаторов, а именно: Индекс среднего направленного движения (ADX) Индекс товарного канала (CCI)
Прежде всего стоит подчеркнуть, что этот Торговый Инструмент является Неперерисовывающимся Нерепейнтинговым Индикатором, что делает его идеальным для профессиональной торговли. Онлайн-курс, руководство пользователя и демонстрация. Индикатор Концепций Умного Действия Цены - очень мощный инструмент как для новичков, так и для опытных трейдеров. Он объединяет более 20 полезных индикаторов в одном, комбинируя передовые торговые идеи, такие как анализ Inner Circle Trader и стратегии торговли концеп
FX Dynamic: Отслеживайте волатильность и тренды с помощью настраиваемого ATR-анализа Обзор FX Dynamic — это мощный инструмент, который использует расчёты среднего истинного диапазона (ATR) для предоставления трейдерам непревзойдённой информации о дневной и внутридневной волатильности. Настраивая понятные пороги волатильности (например, 80%, 100% и 130%), вы можете быстро определять потенциальные возможности для прибыли или получать предупреждения, когда рынок выходит за типичные рамки. FX Dyna
Представляем       Quantum Breakout PRO   , новаторский индикатор MQL5, который меняет ваш способ торговли в зонах прорыва! Разработан командой опытных трейдеров со стажем торговли более 13 лет,       Квантовый прорыв PRO       разработан, чтобы поднять ваше торговое путешествие к новым высотам с его инновационной и динамичной стратегией зоны прорыва. Quantum Breakout Indicator покажет вам сигнальные стрелки на зонах прорыва с 5 целевыми зонами прибыли и предложением стоп-лосса на основе поля
Индикатор определения тренда, дополнит любую стратегию, а также может использоваться как самостоятельный инструмент.  ВАЖНО! Свяжитесь со мной сразу после покупки, чтобы получить инструкции и бонус!  Преимущества Прост в использовании, не перегружает график не нужной информацией; Возможность использования  как фильтр для любой стратегии; Имеет встроенные уровни динамических поддержек и сопротивлений, что может использоваться как для фиксации прибыли, так и для установки стоп-лоссов; Индикатор не
Топовый индикатор МТ5, дающий сигналы для входа в сделки без перерисовки! Идеальные точки входа в сделки для  валют, крипты, металлов, акций, индексов !  Смотрите  видео  (6:22) с примером отработки всего одного сигнала, окупившего индикатор. Версия индикатора для MT4 Преимущества индикатора Сигналы на вход без перерисовки Если сигнал появился, он никуда НЕ исчезает! В отличие от индикаторов с перерисовкой, которые ведут к потере депозита, потому что могут показать сигнал, а потом убрать его. Б
Прежде всего стоит подчеркнуть, что эта торговая система является индикатором без перерисовки, без повторной отрисовки и без задержки, что делает ее идеальной как для ручной, так и для роботизированной торговли. Онлайн курс, руководство и загрузка пресетов. «Smart Trend Trading System MT5» - это комплексное торговое решение, созданное для новичков и опытных трейдеров. Он объединяет более 10 премиальных индикаторов и предлагает более 7 надежных торговых стратегий, что делает его универсальным вы
After your purchase, feel free to contact me for more details on how to receive a bonus indicator called VFI, which pairs perfectly with Easy Breakout for enhanced confluence!     Easy Breakout MT5   is a powerful price action trading system built on one of the most popular and widely trusted strategies among traders: the   Breakout strategy ! This indicator delivers crystal-clear Buy and Sell signals based on breakouts from key support and resistance zones. Unlike typical breakout indicators
Gartley Hunter Multi - Индикатор для поиска гармонических моделей одовременно на десятках торговых инструментов и на всех возможных ценовых диапазонах. Инструкция/Мануал ( Обязательно читайте перед приобретением ) | Версия для МТ4 Преимущества 1. Паттерны: Гартли, Бабочка, Акула, Краб. Летучая мышь, Альтернативная летучая мышь, Глубокий краб, Cypher 2. Одновременный поиск паттернов на десятках торговых инструментов и на всех возможных таймфреймах 3. Поиск паттернов всех возможных размеров. От са
Индикатор Trend Line Map является дополнением к индикатору Trend Screener Indicator. Он работает как сканер всех сигналов, генерируемых скринером тренда (сигналы линии тренда). Это сканер линий тренда на основе индикатора Trend Screener. Если у вас нет индикатора Trend Screener Pro, программа Trend Line Map Pro работать не будет. It's a Trend Line Scanner based on Trend Screener Indicator. If you don't have Trend Screener Pro Indicator,     the Trend Line Map Pro will not work . Зайдя в наш
Это, пожалуй, самый полный индикатор автоматического распознавания гармонического ценообразования, который вы можете найти для платформы MetaTrader. Он обнаруживает 19 различных паттернов, воспринимает проекции Фибоначчи так же серьезно, как и вы, отображает зону потенциального разворота (PRZ) и находит подходящие уровни стоп-лосс и тейк-профит. [ Руководство по установке | Руководство по обновлению | Устранение неполадок | FAQ | Все продукты ] Он обнаруживает 19 различных гармонических ценов
Эта панель обнаруживает и отображает на графике зоны   спроса   и   предложения , как в скальпинге, так и в долгосрочном режиме, в зависимости от вашей торговой стратегии для выбранных символов. Кроме того, сканерный режим панели помогает сразу проверить все нужные символы и не пропустить ни одной подходящей позиции /   MT4 версия Бесплатный индикатор:   Basic Supply Demand Особенности Позволяет просматривать торговые возможности по   нескольким валютным парам , давая вам четкое и ясное пред
Contact me  to send you instruction and add you in group. QM (Quasimodo) Pattern is based on Read The Market(RTM) concepts. The purpose of this model is to face the big players of the market (financial institutions and banks), As you know in financial markets, big traders try to fool small traders, but RTM prevent traders from getting trapped. This style is formed in terms of price candles and presented according to market supply and demand areas and no price oscillator is used in it. RTM conc
Special offer : ALL TOOLS , just $35 each! New tools   will be   $30   for the   first week   or the   first 3 purchases !  Trading Tools Channel on MQL5 : Join my MQL5 channel to update the latest news from me Volumatic VIDYA (Variable Index Dynamic Average) — это продвинутый индикатор, предназначенный для отслеживания трендов и анализа давления покупок и продаж в каждой фазе тренда. Используя Variable Index Dynamic Average как основную технику динамического сглаживания, этот инструмент предос
Auto Order Block with break of structure based on ICT and Smart Money Concepts (SMC) Futures Break of Structure ( BoS )             Order block ( OB )            Higher time frame Order block / Point of Interest ( POI )    shown on current chart           Fair value Gap ( FVG ) / Imbalance   -  MTF      ( Multi Time Frame )    HH/LL/HL/LH  -  MTF      ( Multi Time Frame )  Choch  MTF      ( Multi Time Frame )  Volume Imbalance     ,  MTF          vIMB Gap’s Power of 3 Equal High / Low’s  
Dark Absolute Trend   is an Indicator for intraday trading. This Indicator is based on   Trend Following  strategy but use also candlestick patterns and Volatility. We can enter in good price with this Indicator, in order to follow the main trend on the current instrument. It is advised to use low spread ECN brokers. This Indicator does   Not repaint   and   N ot lag . Recommended timeframes are M5, M15 and H1. Recommended working pairs: All. I nstallation and  Update Guide   -  Troubleshooting
Другие продукты этого автора
Squeezer MT4
Ahmed Alaaeldin Abdulrahman Ahmed Elherzawi
The Squeezer indicator simply draws ascending lines with Sell signal in the downtrend and descending lines with Buy signal in the uptrend to catch the pullbacks and sniper entries. This is a common successful trading strategy being used by many successful traders, and the good thing about this strategy is that it works with all time frames. The difference is in the take profit level between them. Buy / Sell signals are triggered at the close of the current candles above / below the ascending or
Investment Castle Supply and Demand
Ahmed Alaaeldin Abdulrahman Ahmed Elherzawi
5 (3)
Supply and Demand indicator does not repaint as it counts the number of tests/retests occurred in the past x number of times. As a trader you need a path to be able to place your buy and sell trades such as: Supply and Demand, Falling & raising channels . Experienced trades will draw the key levels and channels around the timeframes. But, they will not be able to draw them on the small time frames as the price changes too frequent. This indicator is based on Shved supply and demand indicator, b
FREE
Chances
Ahmed Alaaeldin Abdulrahman Ahmed Elherzawi
5 (6)
The Investment Castle Chances indicator will show signals on the chart for entering a buy or sell trade. There are 2 types of signals for each direction as follows: Buy / Sell (Orange colored candlesticks) Strong Buy   (Green colored candlesticks)  / Strong Sell  (Red colored candlesticks) You may place a buy trade once you see the Buy arrow or vise versa, or you might prefer to wait for a further confirmation “Strong Buy” / “Strong Sell”. This indicator works best with the high time frames H1,
FREE
Investment Castle Trend Lines
Ahmed Alaaeldin Abdulrahman Ahmed Elherzawi
5 (6)
All traders should know the trend before making their decision when placing the buy or sell orders. The first step always starts with  supply and demand ,   rising and falling channels , trend lines, engulfing candles etc. All the above contribute to what is called “Price Action” and that is the best and most reliable way in trading and catching the trend and making profits, without stress. The  Investment Castle Trend Line Indicator  will automatically draw the trend lines on the MT5 for you.
FREE
Investment Castle Indicator
Ahmed Alaaeldin Abdulrahman Ahmed Elherzawi
4.83 (6)
ВВЕДЕНИЕ Индикатор Investment Castle был создан с надеждой на решение следующих проблем: 1. Определите правильное направление тренда на разных таймфреймах. 2. Показывает процент попаданий, процент выигрышей на графике. 3. Этот индикатор не перерисовывает график. 4. Индикатор встроен в советник Investment Castle EA . * Посетите веб-сайт для получения установленных файлов, обновлений и многого другого: https://www.investmentcastle.com ОТКАЗ ОТ ОТВЕТСТВЕННОСТИ «Индикатор инвестиционного замк
FREE
Channels Indicator MT5
Ahmed Alaaeldin Abdulrahman Ahmed Elherzawi
4.75 (4)
Channels indicator does not repaint as its based on projecting the falling and raising channels. As a trader you need a path to be able to place your buy and sell trades such as: Supply and Demand , Falling & raising channels. Falling and raising channels can be in any time frame and also can be in all time frames at the same time and the price always flows within these channels. Experienced trades will draw the key levels and channels around the time frames. But, they will not be able to draw
FREE
Investment Castle EA
Ahmed Alaaeldin Abdulrahman Ahmed Elherzawi
ВВЕДЕНИЕ Советник Investment Castle - это трендовый советник, использующий встроенный индикатор. Советник Investment Castle был создан с надеждой на решение следующих проблем: 1. Советник Investment Castle следует за трендом на средних таймфреймах. 2. Советник Investment Castle использует улучшенный механизм восстановления Мартингейла для уменьшения просадки. 3. Пользователи могут выбирать и оптимизировать множество входных данных. Наиболее предпочтительной стратегией является файл с настрой
Investment Castle Trend Lines MT4
Ahmed Alaaeldin Abdulrahman Ahmed Elherzawi
5 (3)
All traders should know the trend before making their decision when placing the buy or sell orders. The first step always starts with  supply and demand , rising and falling channels , trend lines, engulfing candles etc. All the above contribute to what is called “Price Action” and that is the best and most reliable way in trading and catching the trend and making profits, without stress. The  Investment Castle Trend Line Indicator  will automatically draw the trend lines on the MT4 for you. An
FREE
Gold Indicator
Ahmed Alaaeldin Abdulrahman Ahmed Elherzawi
5 (1)
This indicator uses horizontal lines to identify support and resistance levels based on Zigzag legs and On-Balance Volume (OBV) analysis. Here is a summary of how the indicator works: Resistance and Support Lines : A horizontal line above the current price level indicates resistance. A horizontal line below the current price level indicates support. Drawing Horizontal Lines : Draw horizontal lines on every Zigzag leg within the last X legs, where X is a specified number (e.g., 10). Only the most
FREE
Investment Castle Indicator MT4
Ahmed Alaaeldin Abdulrahman Ahmed Elherzawi
4.88 (8)
Investment Castle Indicator has the following features: 1.  Dictates the direction of the trend in different Timeframes . 2.   Shows the hit rate and winning rate on the chart. 3. This indicator does not repaint the chart. 4. This indicator is built-in the Support & Resistance based Investment Castle EA which works with   Psychological Key Levels "Support & Resistance" Indicator.
FREE
Chances MT4
Ahmed Alaaeldin Abdulrahman Ahmed Elherzawi
5 (2)
The Investment Castle Chances indicator will show signals on the chart for entering a buy or sell trade. There are 2 types of signals for each direction as follows: Buy / Sell (Orange colored candlesticks) Strong Buy (Green colored candlesticks)  / Strong Sell  (Red colored candlesticks) You may place a buy trade once you see the Buy arrow or vise versa, or you might prefer to wait for a further confirmation “Strong Buy” / “Strong Sell”. This indicator works best with the high time frames H1, H
FREE
Spots
Ahmed Alaaeldin Abdulrahman Ahmed Elherzawi
The Spots Indicator can be used for Entering and Exiting your trades based on the common candlestick patterns such as: engulfing, hanging man, doji etc. It is designed to publish desktop and mobile notification every time a signal is triggered. However, it is worth noting that this indicator is recommended to be used with other indicator for confirming the entries. It is best to use it with the Investment Castle Trend Lines indicator  and the Supply and Demand indicator .
FREE
Investment Castle RSI Divergence
Ahmed Alaaeldin Abdulrahman Ahmed Elherzawi
RSI Дивергенция Индикатор - мощный инструмент, предназначенный для выявления потенциальных реверсивных движений на рынке путем выявления различий между индексом относительной силы (RSI) и движением цен. Дивергенции могут быть значимым указанием на предстоящее изменение тренда, либо с бычьего на медвежий, либо наоборот. Этот индикатор создан для упрощения и улучшения работы по идентификации потенциальных торговых возможностей. Особенности: Автоматическое обнаружение: индикатор сканирует график на
FREE
Investment Castle Support and Resistance
Ahmed Alaaeldin Abdulrahman Ahmed Elherzawi
5 (5)
Investment Castle Support and Resistance Indicator has the following features: 1.  Dictates the direction of Buy or Sell trades based on Support and Resistance Levels automatically . 2.  Candles stick colors will change to Red for Sell and Blue for Buy (Default settings, user can change from the inputs). 3. This indicator is built-in the Support & Resistance based Investment Castle EA which works with Psychological Key Levels "Support & Resistance".
FREE
Investment Castle EA MT4
Ahmed Alaaeldin Abdulrahman Ahmed Elherzawi
4.5 (2)
Introducing the Investment Castle Expert Advisor - the ultimate trend-based trading tool that comes with built-in Investment Castle and Psychological Key Levels indicators. Whether you're a novice or a seasoned trader, this powerful tool will help you make informed decisions and maximize profits. Features: Automated Support and Resistance Key Levels: Say goodbye to manual chart analysis! Our AI-driven software automatically identifies key levels of support and resistance, allowing you to make s
Investment Castle Support and Resistance MT4
Ahmed Alaaeldin Abdulrahman Ahmed Elherzawi
4.71 (7)
Investment Castle Support and Resistance Indicator has the following features: 1.  Dictates the direction of Buy or Sell trades based on Support and Resistance Levels automatically . 2.  Candles stick colors will change to Red for Sell and Blue for Buy (Default settings, user can change from the inputs). 3. This indicator is built-in the Support & Resistance based Investment Castle EA which works with Psychological Key Levels "Support & Resistance".
FREE
Spots MT4
Ahmed Alaaeldin Abdulrahman Ahmed Elherzawi
The Spots Indicator can be used for Entering and Exiting your trades based on the common candlestick patterns such as: engulfing, hanging man, doji etc. It is designed to publish desktop and mobile notification every time a signal is triggered. However, it is worth noting that this indicator is recommended to be used with other indicator for confirming the entries. It is best to use it with the   Investment Castle Trend Lines indicator  and the   Supply and Demand indicator
FREE
Investment Castle Volatility Index
Ahmed Alaaeldin Abdulrahman Ahmed Elherzawi
5 (2)
Investment Castle Volatility Index has the following features: 1. This indicator shows the volumes of the current symbol and the market volatility. 2. This indicator is built-in in the Investment Castle EA which works as volatility index for the EA dynamic distance and opposite start. 3. Parameters available for optimization for each pairs. 4. Works with any chart.
FREE
Investment Castle Supply and Demand MT4
Ahmed Alaaeldin Abdulrahman Ahmed Elherzawi
Supply and Demand indicator does not repaint as it counts the number of tests/retests occurred in the past x number of times. As a trader you need a path to be able to place your buy and sell trades such as: Supply and Demand, Falling & raising channels . Experienced trades will draw the key levels and channels around the timeframes. But, they will not be able to draw them on the small time frames as the price changes too frequent. This indicator is based on Shved supply and demand indicator, b
FREE
Investment Castle Engulfing
Ahmed Alaaeldin Abdulrahman Ahmed Elherzawi
4.5 (2)
Whether you are a scalper or daily trader, you will always look for bullish / bearish engulfing candles. This can be a bit tricky and stressful when you try to visually identify the engulfing candles on the chart. Not only that, you might be trading on the M15 time frame but the engulfing candle is forming or has already formed in the H4 time frame. This indicator is made to do that on your behalf. You can trade on any time frame and see Engulfing candles of another time frame, this means that
FREE
Investment Castle News
Ahmed Alaaeldin Abdulrahman Ahmed Elherzawi
Investment Castle News Indicator will plot vertical lines before the news on the chart and categorized in three different colors in accordance with the news importance. You can choose to limit the news to the current chosen symbol or show all future news on the same chart. High impact news is marked in Red lines be default. Medium impact news is marked in Orange lines be default. Low impact news is marked in Yellow lines be default.
FREE
Channels Indicator
Ahmed Alaaeldin Abdulrahman Ahmed Elherzawi
4 (1)
Channels indicator does not repaint as its based on projecting the falling and raising channels. As a trader you need a path to be able to place your buy and sell trades such as: Supply  and Demand , Falling & raising channels. Falling and raising channels can be in any time frame and also can be in all time frames at the same time and the price always flows within these channels. Experienced trades will draw the key levels and channels around the timeframes. But, they will not be able to draw
FREE
Investment Castle Volatility Index MT4
Ahmed Alaaeldin Abdulrahman Ahmed Elherzawi
3.67 (3)
Investment Castle Volatility Index has the following features: 1. This indicator shows the volumes of the current symbol and the market volatility. 2. This indicator is built-in in the Investment Castle EA which works as volatility index for the EA dynamic distance and opposite start. 3. Parameters available for optimization for each pairs. 4. Works with any chart.
FREE
Layering
Ahmed Alaaeldin Abdulrahman Ahmed Elherzawi
This tool is very helpful when trading and increasing the profits by placing certain trades (defined in the settings) with equal distances when you place Buy / Sell orders. It helps in securing the account by using the layering method. Once the price hits the first TP, the EA will move the SL to the entry level, then once the price hits the 2nd TP, the EA will move the price to the first TP level. All the TP and SL generated by the EA can be manually adjusted on the chart itself. It works on any
Combined MT4
Ahmed Alaaeldin Abdulrahman Ahmed Elherzawi
Welcome to Investment Castle products   This product is exclusively available in the MQL5 market and is not available and will not be available anywehere else. The Combined indicator is a multi-time frame indicator and it is built using 3 indicators: Bands indicator which draws the support and resistance key levels   using up to 5 different time frames Patterns indicator which draws the chart patterns using up to 6 different time frames Spots indicator which shows the common candlestick pattern
Investment Castle II MT4
Ahmed Alaaeldin Abdulrahman Ahmed Elherzawi
5 (1)
The Investment castle II ea trading robot has a variety of features, including: The ability to remember open positions, their take profit and stop loss levels if the VPS or terminal is restarted. The ability to remember trade buttons and their setup if the VPS or terminal is restarted. The ability to plot profit/loss on a chart, but only when the user runs the visualizer and on live charts. It automatically disables this feature when backtesting or optimizing settings for improved speed and perf
Squeezer MT5
Ahmed Alaaeldin Abdulrahman Ahmed Elherzawi
The Squeezer indicator simply draws ascending lines with Sell signal in the downtrend and descending lines with Buy signal in the uptrend to catch the pullbacks and sniper entries. This is a common successful trading strategy being used by many successful traders, and the good thing about this strategy is that it works with all time frames. The difference is in the take profit level between them. Buy / Sell signals are triggered at the close of the current candles above / below the ascending or
Investment Castle Engulfing MT4
Ahmed Alaaeldin Abdulrahman Ahmed Elherzawi
Whether you are a scalper or daily trader, you will always look for bullish / bearish engulfing candles. This can be a bit tricky and stressful when you try to visually identify the engulfing candles on the chart. Not only that, you might be trading on the M15 time frame but the engulfing candle is forming or has already formed in the H4 time frame. This indicator is made to do that on your behalf. You can trade on any time frame and see Engulfing candles of another time frame, this means that y
FREE
Bundles
Ahmed Alaaeldin Abdulrahman Ahmed Elherzawi
This EA uses the following Built-in indicators: Channels indicator Supply and demand indicator Trend indicator It is based on multi-directional grid system, not the normal martingale you are familiar with. When the price is in supply or demand zones, the EA will wait for a confirmation before entering a position. The confirmation is through the three above indicators together. You don't need to purchase any of the indicators mentioned above if you don't want to see them on the live chart.
The Panel
Ahmed Alaaeldin Abdulrahman Ahmed Elherzawi
The Panel will read the floating profit/loss for the symbol of your chart and will plot the profit/loss numbers on the chart. It will work with manual trades or trades made by any expert advisor. The Panel shows the Max Drawdown in the base currency, floating profit/loss for both buy and sell orders. It will also show the same in Pips. The Panel is movable on the chart, so you can drag it using the mouse cursor.
FREE
Фильтр:
xlxAxlx
1463
xlxAxlx 2024.11.15 20:40 
 

Пользователь не оставил комментарий к оценке

Ответ на отзыв
Версия 1.2 2023.08.25
Copy buffer is now added.