• Обзор
  • Отзывы
  • Обсуждение

SUM Market Profile Heat

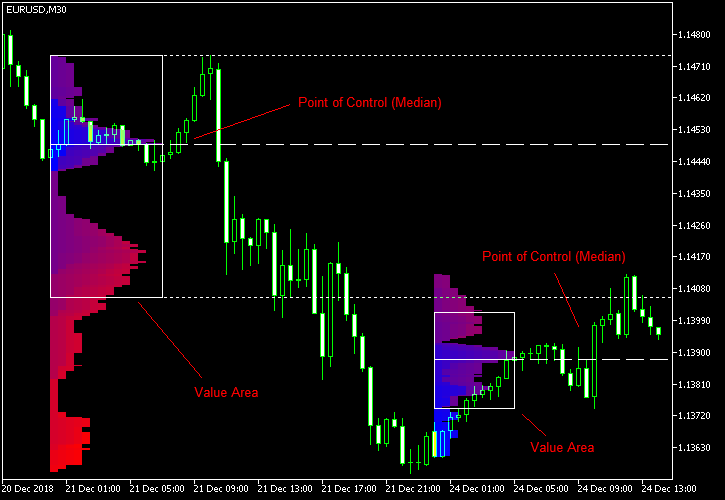
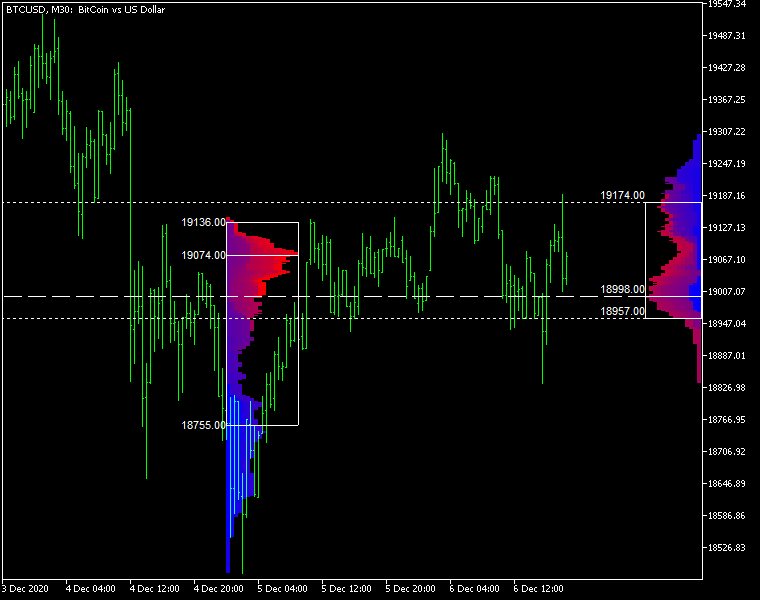
Market Profile Heat indicator — is a classic Market Profile implementation that can show the price density over time, outlining the most important price levels, value area, and control value of a given trading session.
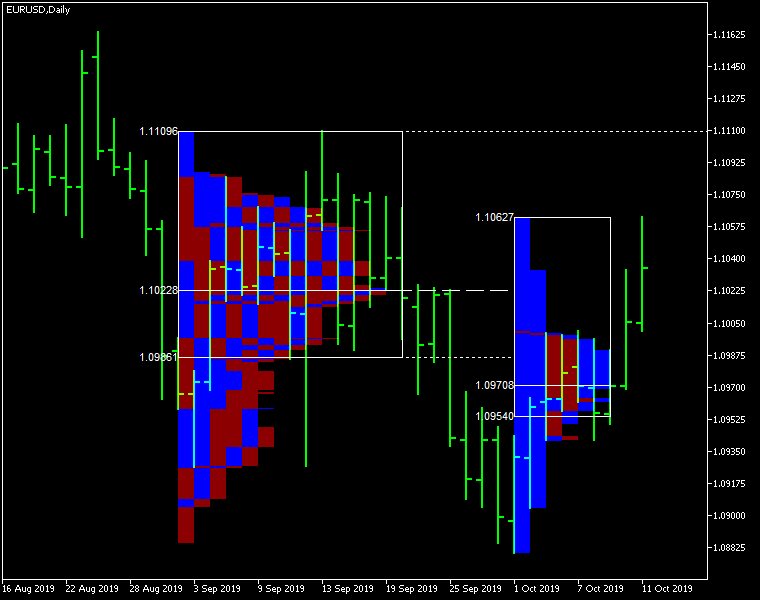
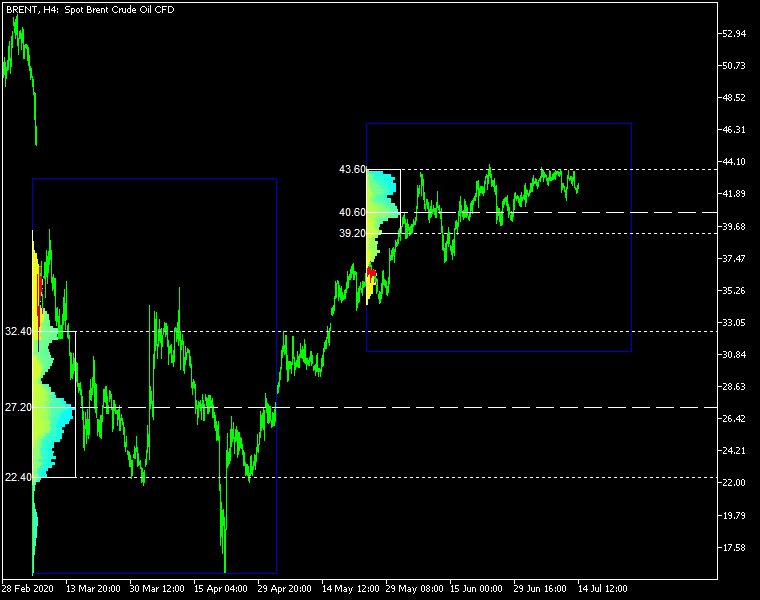
This indicator can be attached to timeframes between M1 and D1 and will show the Market Profile for daily, weekly, monthly, or even intraday sessions. Lower timeframes offer higher precision. Higher timeframes are recommended for better visibility. It is also possible to use a free-draw rectangle session to create a custom market profile on any timeframe. Six different color schemes are available to draw the profile's blocks. Drawing profiles as a plain color histogram is also possible. Alternatively, you may choose to color the profile based on bullish/bearish bars. This indicator is based on bare price action and does not use any standard indicators.

Input parameters

Main

  • Session (default = Daily) — trading session for market profile: Daily, Weekly, Monthly, Intraday, and Rectangle. For a rectangle session to get calculated, a rectangle chart object with the name starting with MPR should be added to the chart. Pressing 'r' on the keyboard will add a properly named rectangle object automatically.
  • StartFromDate (default = __DATE__) — if StartFromCurrentSession is false, then the indicator will start drawing profiles from this date. It draws to the past. For example, if you set it 2018-01-20 and SessionsToCount is 2, then it will draw the profiles for 2018-01-20 and 2018-01-19.
  • StartFromCurrentSession (default = true) — if true, then the indicator starts drawing from today, else — from the date given in StartFromDate.
  • SessionsToCount (default = 2) — for how many trading sessions to draw the market profiles.
  • SeamlessScrollingMode (default = false) — if true, the StartFromDate and StartFromCurrentSession parameters are ignored; the sessions are calculated and displayed starting from the current chart position's rightmost bar. This allows scrolling back in time indefinitely to view past sessions.
  • EnableDevelopingPOC (default = false) — if true, multiple horizontal lines will be drawn to depict how the Point of Control developed through the session.
  • ValueAreaPercentage (default = 70) — a percentage share of the session's TPOs to include in the Value Area.

Looks and colors

  • ColorScheme (default = Blue to Red) — color scheme for profile's blocks:
    • blue to red
    • red to green
    • green to blue
    • yellow to cyan
    • magenta to yellow
    • cyan to magenta
  • SingleColor (default = clrBlue) — if ColorScheme is set to Single Color, this color will be used to draw market profiles.
  • ColorBullBear (default = false) — if true, the color of the profile blocks depends not on the age of the origin bar but on its direction.
  • MedianColor (default = clrWhite) — the color of the control value (median).
  • ValueAreaSidesColor (default = clrWhite) — the color of the value area side borders.
  • ValueAreaHighLowColor (default = clrWhite) — the color of the value area top and bottom borders.
  • MedianStyle (default = STYLE_SOLID) — the Point of Control (median) line style.
  • MedianRayStyle (default = STYLE_DASH) — the Point of Control (median) ray line style.
  • ValueAreaSidesStyle (default = STYLE_SOLID) — the style of the value area side borders.
  • ValueAreaHighLowStyle (default = STYLE_SOLID) — the style of the value area top and bottom borders.
  • ValueAreaRayHighLowStyle (default = STYLE_DOT) — the style of the value area top and bottom rays.
  • MedianWidth (default = 1) — the Point of Control (median) line width.
  • MedianRayWidth (default = 1) — the Point of Control (median) ray line width.
  • ValueAreaSidesWidth (default = 1) — the width of the value area side borders.
  • ValueAreaHighLowWidth (default = 1) — the width of the value area top and bottom borders.
  • ValueAreaRayHighLowWidth (default = 1) — the width of the value area top and bottom rays.
  • ShowValueAreaRays (default = None) — can be set so that the value area's High and Low price levels are projected to the right side of the chart. Can be set to previous session, current, previous and current, all previous, or all.
  • ShowMedianRays (default = None) — can be set so that the median is projected to the right side of the chart. Can be set to previous session, current, previous and current, all previous, or all.
  • RaysUntilIntersection (default = Stop_No_Rays) — defines the way median and value area rays will be cut off when they meet the next trading session's price range:
    • Stop_No_Rays — no rays are stopped anywhere.
    • Stop_All_Rays — all rays are stopped at an intersection with the price of another session.
    • Stop_All_Rays_Except_Prev_Session — all rays except the previous session's rays are stopped at an intersection with the price of another session.
    • Stop_Only_Previous_Session — only rays of the previous session are stopped at an intersection with the price of another session.
  • HideRaysFromInvisibleSessions (default = false) — if true, rays from sessions starting behind the left edge of the screen won't be displayed until you scroll back to them.
  • TimeShiftMinutes (default = 0) — time shift for the sessions, in minutes. Positive value will move the session start to the left; negative — to the right.
  • ShowKeyValues (default = true) — if true, Value Area High, Value Area Low, and Point of Control are displayed on the left of the market profile.
  • KeyValuesColor (default = clrWhite) — the color for Value Area High, Value Area Low, and Point of Control printout.
  • KeyValuesSize (default = 8) — the font size for Value Area High, Value Area Low, and Point of Control printout.
  • ShowSinglePrint (default = No) — can be set to Leftside or Rightside and will mark the single print profile — a part of the profile, which is only one TPO wide.
  • SinglePrintRays (default = false) — if true, single print edges are marked with rays.
  • SinglePrintColor (default = clrGold) — the color for single print marking if ShowSinglePrint isn't set to No.
  • SinglePrintRayStyle (default = STYLE_SOLID) — the single print ray line style.
  • SinglePrintRayWidth (default = 1) — the single print ray line width.
  • ProminentMedianColor (default = clrYellow) — the color for the prominent median (PPOC) if ProminentMedianPercentage is set to 100 or less.
  • ProminentMedianStyle (default = STYLE_SOLID) — the style for the prominent median (PPOC) if ProminentMedianPercentage is set to 100 or less.
  • ProminentMedianWidth (default = 4) — the width for the prominent median (PPOC) if ProminentMedianPercentage is set to 100 or less.
  • RightToLeft (default = false) — if true, the current session's market profile has its histogram drawn from right to left. In case Session is set to Rectangle, market profiles of all sessions are drawn right-to-left.

Performance

  • PointMultiplier (default = 0) — the higher it is, the wider are the profile's price boxes and the fewer are the chart objects. You can use it to reduce the indicator's load on CPU. When the value is zero, an adaptive multiplier is used — the indicator attempts to calculate the optimal value automatically.
  • ThrottleRedraw (default = 0) — a delay in seconds that will be applied before each redraw of the profiles. You can use it to reduce the indicator's load on CPU.
  • DisableHistogram (default = false) — if true, no market profile histogram is drawn, but Value Area and Median are still marked. This makes indicator work extremely fast, but is less useful for thorough market analysis.

Alerts

  • AlertNative (default = false) — if true, the indicator will issue the platform's native pop-up alert when some alert conditions are met.
  • AlertEmail (default = false) — if true, MetaTrader's email alerts will be sent when some alert conditions are met. Email should be properly configured in MetaTrader via Tools->Options->Email
  • AlertPush (default = false) — if true, MetaTrader's push notification alerts will be sent to your mobile device when some alert conditions are met. Notifications should be properly configured in MetaTrader via Tools->Options->Notifications. This alert type is not available in the cTrader version of the indicator.
  • AlertArrows (default = false) — if true, MetaTrader will draw arrows on the chart when some alert conditions are met.
  • AlertCheckBar (default = Previous) — controls the bar to check the alert conditions on. Current — the indicator will check the current unfinished bar; expect a lot of alerts. Previous — the indicator will check the previous (closed) bar; alerts will be delayed but more concise.
  • AlertForValueArea (default = false) — if true, alerts will be issued whenever a Value Area ray (high or low) is crossed by the price.
  • AlertForMedian (default = false) — if true, alerts will be issued whenever a Median ray is crossed by the price.
  • AlertForSinglePrint (default = false) — if true, alerts will be issued whenever a Single Print ray is crossed by the price.
  • AlertOnPriceBreak (default = false) — if true, alerts will be issued when the price breaks any of the trigger levels but then returns back behind it.
  • AlertOnBarClose (default = false) — if true, alerts will be issued when the bar opens on one side the trigger level and closes on the other side of it.
  • AlertOnGapCross (default = false) — if true, alerts will be issued when the trigger level appears inside a price gap between the last two bars.
  • AlertArrowCodePB (default = 108) — arrow code for price break alert arrows.
  • AlertArrowCodeCC (default = 110) — arrow code for candle close alert arrows.
  • AlertArrowCodeGC (default = 117) — arrow code for gap crossover alert arrows.
  • AlertArrowColorPB (default = clrRed) — arrow color for price break alert arrows.
  • AlertArrowColorCC (default = clrBlue) — arrow color for candle close alert arrows.
  • AlertArrowColorGC (default = clrYellow) — arrow color for gap crossover alert arrows.
  • AlertArrowWidthPB (default = 1) — arrow width for price break alert arrows.
  • AlertArrowWidthCC (default = 1) — arrow width for candle close alert arrows.
  • AlertArrowWidthGC (default = 1) — arrow width for gap crossover alert arrows.

Intraday sessions

  • EnableIntradaySessionN (default = true) — if true and Session is set to Intraday, then the indicator will attempt to drawn the intraday market profile #N on the chart.
  • IntradaySessionNStartTime (default = "HH:MM") — start time in HH:MM format for the intraday session #N.
  • IntradaySessionNEndTime (default = "HH:MM") — end time in HH:MM format for the intraday session #N.
  • IntradaySessionNColorScheme (default = Blue_to_Red) — color scheme for the intraday session #N.

Miscellaneous

  • SaturdaySunday (default = Normal sessions) — how to treat Saturday and Sunday sessions:
    • Normal sessions — Saturday and Sunday will be treated as normal sessions with their own daily and intraday sessions.
    • Ignore Saturday and Sunday — Saturday and Sunday candlesticks will be ignored.
    • Append Saturday and Sunday — Saturday candlesticks will be appended to the Friday session; Sunday candlesticks will be appended to the Monday session.
  • DisableAlertsOnWrongTimeframes (default = false) — if true, no pop-up alerts will appear on using Market Profile with wrong timeframe/session combination.
  • ProminentMedianPercentage (default = 101) — percentage of TPOs out of all possible that should occur inside a median for it to be considered prominent (PPOC). For example, if you set it to 50%, a median will be marked as prominent if it contains at least 24 TPOs in a daily session on M30 timeframe. If it is set to 101, no prominent median is possible.


Рекомендуем также
BoxChart MT5
Evgeny Shevtsov
5 (7)
Рынок несправедлив, хотя бы потому, что всего лишь 10% игроков управляют 90% капитала. У рядового трейдера мало шансов, чтобы противостоять этим «хищникам». Но выход есть, необходимо всего лишь перейти на другую сторону, необходимо находиться в числе этих 10% «акул», научиться распознавать их намерения и двигаться вместе с ними. Объем - это единственный опережающий фактор, который безупречно работает на любом периоде и любом торговом инструменте. Сначала зарождается и накапливается объем, и толь
Профиль Рынка (Market Profile) определяет ряд типов дней, которые помогают трейдеру распознать поведение рынка. Ключевая особенность - это область значений (Value Area), представляющая диапазон ценового действия, в котором произошло 70% торговли. Понимание области значений может помочь трейдерам вникнуть в направление рынка и установить торговлю с более высокими шансами на успех. Это отличное дополнение к любой системе, которую вы возможно используете. Blahtech Limited представляет сообществу Me
Индикатор Supply Demand использует предыдущее ценовое действие для выявления потенциального дисбаланса между покупателями и продавцами. Ключевым является определение зон с лучшими возможностями, а не просто вероятностей. Индикатор Blahtech Supply Demand обеспечивает функционал, не доступный ни в одной платформе. Этот индикатор 4 в 1 не только выделяет зоны с более высокой вероятностью на основе механизма оценки силы по множественным критериям, но также комбинирует его с мульти-таймфреймовым ана
"Профиль объема" - это расширенный индикатор, отображающий общий объем торгов на каждом ценовом уровне за указанный пользователем период времени. Основными составляющими профиля объемов являются POC ( Point Of Control - уровень цены, при котором за выбранный период было исполнено максимальное количество контрактов), VAH ( Value Area High - самая высокая цена в области Value Area) и VAL ( Value Area Low - самая низкая цена в Value Area). Когда мы остановились на исходном индикаторе, мы долго с
Market Profile Introducing the Market Profile MetaTrader Indicator—your gateway to mastering market dynamics with precision and insight. This powerful tool delivers a classic Market Profile analysis, revealing price density over time and highlighting crucial levels, including the value area and control value for any trading session.  Compatible with timeframes from M1 to D1, it adapts to daily, weekly, monthly, or even intraday sessions, offering you unmatched flexibility. Lower timeframes pro
VPO Profile MT5
Kyra Nickaline Watson-gordon
5 (2)
Definition : VPO is a Volume Price Opportunity. Instead of using bars or candles with an Open, High, Low, and Close price, each "bar" in a Market Profile is represented by horizontal bars against the price It is called Market Profile terminology. In other words volume-price-opportunity (VPO) profiles are histograms of how many volumes were traded at each price within the span of the profile. By using a VPO chart, you are able to analyze the amount of trading activity, based on volume, for eac
Этот продукт позволит Вам выгодно приобреcти и использовать два самых популярных продукта для анализа объемов заявок и сделок на биржевых рынках: Actual Depth of Market Chart Actual Tick Footprint Volume Chart Данный продукт вобрал в себя всю мощь каждого отдельного индикатора и оформлен в виде одного файла. Функционал продукта Actual COMBO Depth of Market AND Tick Volume Chart полностью идентичен оригинальным индикаторам. Вы оцените удобство объединения этих двух продуктов в один супер-индикато
Description: The Volume Profile displays detailed informations of historical trading activities at certain price levels (Market Profile). Locate the areas with the best prices in the market and get an advantage over other market participants. Features: Customizable Market Profile Shows the "fair" Value Area with 70% of all Volume Shows critical low volume zones Shows VPOC, VAL and VAH Points integrated resource management to reduce the load while working with multiple charts Works on all tim
To get access to MT4 version please click here . This is the exact conversion from TradingView: " WaveTrend" by LazyBear. This is a light-load processing and non-repaint indicator. All input options are available. Buffers are available for processing in EAs. You can message in private chat for further changes you need. The filling area option is omitted to fit into MT5 graphics.
Forex Volume MT5
KEENBASE SOFTWARE SOLUTIONS
KT Forex Volume shows the buying and selling volume of a currency pair in the form of a colored histogram. The volume is made of buying and selling transactions in an asset. In FX market: If the buying volume gets bigger than the selling volume, the price of a currency pair would go up. If the selling volume gets bigger than the buying volume, the price of a currency pair would go down. Features Avoid the bad trades by confirming them using the tick volume data. It helps you to stay on the si
VP hidden
Emr Aljnaby
4.14 (7)
The indicator works to convert normal volume into levels and determine financial liquidity control points. It is very similar in function to Fixed Volume Profile. But it is considered more accurate and easier to use than the one found on Trading View because it calculates the full trading volumes in each candle and in all the brokers present in MetaTrade, unlike what is found in Trading View, as it only measures the broker’s displayed prices. To follow us on social media platforms: tel
FREE
CVD SmoothFlow Pro
Thalles Nascimento De Carvalho
CVD SmoothFlow Pro - Неограниченный анализ объема для любых активов! CVD SmoothFlow Pro — это идеальное решение для трейдеров, ищущих точный и неограниченный анализ объема. Используя расчет Cumulative Volume Delta (CVD) с продвинутой фильтрацией шума, Pro-версия предоставляет гибкость и точность, необходимые для торговли любыми финансовыми активами. Что предлагает CVD SmoothFlow Pro? Четкий анализ : Фильтрует шум и выделяет значимые объемные движения по любым финансовым активам. ️ Точная
Z Score Plus MT5
Eduardo Da Costa Custodio Santos
В финансах Z-баллы являются мерой изменчивости наблюдения и могут использоваться трейдерами для определения волатильности рынка. Z-баллы сообщают трейдерам, является ли он типичным для указанного набора данных или нетипичным. Z-оценки также позволяют аналитикам адаптировать оценки из нескольких наборов данных, чтобы получать оценки, которые можно более точно сравнивать друг с другом. # На практике у нас есть ZScore с нулевой точкой и колебаниями между 2 и 3 для сверхвысоких точек и колебаниями м
Уникальность данного индикатора заключается в алгоритме учёта объёмов: накопление происходит   непосредственно за выбранный период  без привязки к началу дня. Последние бары можно исключить из расчёта, тогда текущие данные будут меньше влиять на  значимые уровни (объёмы),   образованные ранее. Для более точного расчёта по умолчанию используются данные с графика М1. Шаг распределения ценовых объёмов регулируется. По умолчанию правая граница отображения установлена на бар, соответствующий началу и
Before installing the HeatMap indicator make sure you are using a broker that gives you access to the Depth of market (DOM) !! This indicator creates a heatmap on your chart allowing you to see the buy or sell limit orders easily and in real time. You have the possibility to change the setting and the colors of the HeatMap in order to adapt to all markets and all charts. Here is an example of a setting you can use with the NASDAQ100 on the AMPGlobal broker :  https://www.youtube.com/watch?v=x0
Индикатор находит уровни максимального и минимального ценового объема (профиль рынка) на рабочей гистограмме для указанного количества баров.  Композитный профиль. Высота гистограммы полностью автоматическая и адаптируется к любому инструменту и таймфрейму. Используется авторский алгоритм и не повторяет известные аналоги. Высота двух гистограмм примерно равна средней высоте свечи. Умное оповещение (smart alert) поможет вам сообщить о цене, касающейся уровня объема. Концепция Smart Money. Low V
The Volume by Price Indicator for MetaTrader 5 features Volume Profile and Market Profile TPO (Time Price Opportunity). Volume and TPO histogram bar and line charts. Volume Footprint charts. TPO letter and block marker collapsed and split structure charts. Static, dynamic and flexible range segmentation and compositing methods with relative and absolute visualizations. Session hours filtering and segment concatenation with Market Watch and custom user specifications. Graphical layering, positio
Market profile was developed by Peter Steidlmayer in the second half of last century. This is a very effective tool if you understand the nature and usage. It's not like common tools like EMA, RSI, MACD or Bollinger Bands. It operates independently of price, not based on price but its core is volume. The volume is normal, as the instrument is sung everywhere. But the special thing here is that the Market Profile represents the volume at each price level. 1. Price Histogram The Price Histogram
Индикатор позволяет анализировать изменения тиковых объемов в виде кумулятивных дельта-баров (свечей). Он вычисляет на каждом баре тиковые объемы для покупок и продаж (раздельно), а также их разницу. Кроме того, он может выводить объемы в разбивке по кластерам (ячейкам) цен внутри указанного бара (обычно это последний бар). Данный индикатор производит вычисления аналогично VolumeDeltaMT5 , но предоставляет иное отображение результатов. Имеется версия для МетаТрейдер 4 - CumulativeDeltaBars . Это
Volume Profile is a very useful indicator . it allows you to spot the price levels where important price action took place. It is similar to support and resistance levels but with a different logic. ( Check Out  Fixed Range Volume Profile MT5  ) One of the first thing that traders mark up when analyzing a chart is support and resistance. Volume Profile can be used for doing that too. The indicator scans the defined number of previous bars and calculates the volume of activity at each price
A Heatmap with a Volume Profile is like a thermal imager or x-ray machine. It will help you to estimate the relative distribution of volume during the price movement and to understand  the relationship between volume and price. Indicator Volume Profile "Volumos Maxima" is a powerful tool for analyzing this relationship. After simple experimentation with heatmap, you can find that each trading instrument has its own “ characteristic ” way of distributing volume. And this will help you to make a b
The Initial Balance (Initial Balance / Initial Balance) is a concept related to the study of volume (to learn more, study about Market Profile and Auction Market Theory. You can find some videos in English when searching for "Initial Balance Market Profile"). The IB defines a range in which prices were negotiated in the first hour of trading.The amplitude of the range is important and the break in the range defined by the Initial Balance may have occurred due to the movement of several players
VR Grid Mt5
Vladimir Pastushak
3.43 (7)
Индикатор VR Grid разработан для создания графической сетки с настройками, определяемыми пользователем. В отличие от стандартной сетки VR Grid используется для построения круглых уровней . В зависимости от выбора пользователя, шаг между круглыми уровнями может быть произвольным. Кроме того, в отличие от других индикаторов и утилит, VR Grid сохраняет положение сетки даже при изменении временного периода или перезагрузке терминала. Настройки, set файлы, демо версии, инструкции, решение проблем, мо
FREE
Volume Profile เป็นเครื่องมือที่ใช้สำหรับการวิเคราะห์ระดับการซื้อขายของตลาดในแต่ละระยะเวลาโดยใช้ปริมาณการซื้อขาย (volume) ซึ่งช่วยให้เราเข้าใจว่ามีการซื้อขายเกิดขึ้นมากที่สุดที่ราคาใด รวมทั้งช่วยในการหาจุดที่มีความนิยมในการซื้อขาย (Point of Control: POC) และระดับการซื้อขายอื่น ๆ ที่สำคัญ เรียกว่า Value Area. การใช้งาน Volume Profile ในการวิเคราะห์ตลาดมักจะมีขั้นตอนดังนี้: กำหนดระยะเวลาที่ต้องการวิเคราะห์ : เราต้องกำหนดระยะเวลาที่เราสนใจในการวิเคราะห์ Volume Profile เช่น ชั่วโมง, วัน, หรือสัปดาห์
Индикатор   Visual Volatility Clustering   кластеризирует рынок на основе волатильности. Индикатор не перерисовывает и дает точные данные, не использует цены закрытия. Использует цены открытия или цены максимумов или минимумов но предыдущего завершенного бара. Поэтому вся информация будет четкой и однозначной. Суть индикатора – разделить рынок цены на определенные участки по схожему типу волатильности. Это можно делать как угодно. В данном примере индикатор сконфигурирован на временной период W
Индикатор строит текущие котировки, которые можно сравнить с историческими и на этом основании сделать прогноз ценового движения. Индикатор имеет текстовое поле для быстрой навигации к нужной дате. Параметры : Symbol - выбор символа, который будет отображать индикатор; SymbolPeriod - выбор периода, с которого индикатор будет брать данные; IndicatorColor - цвет индикатора; Inverse - true переворачивает котировки, false - исходный вид; Далее идут настройки текстового поля, в которое можн
Автоматический профиль объема с фиксированным диапазоном с оповещениями для MT5 Этот индикатор показывает, где цена провела больше времени, выделяя важные уровни, которые можно использовать в торговле. и может отображать плотность цен с течением времени, выделяя наиболее важные ценовые уровни, области значения и контрольное значение данной торговой сессии. Этот индикатор можно прикрепить к таймфреймам между M1 и D1, и он будет показывать профиль рынка для дневных, недельных, месячных или да
RAD CRITICAL LEVES RAD indicator tracks “Relevant Volume” in real time, identifying accumulation and distribution processes, projecting them in the chart as SUPPORT or RESISTANCE zones. Natural   support   and resistance levels are generated by Volume Accumulation and Distribution processes. As these processes evolve, levels at which the relevant volume in the market place is positioned, become difficult areas to cross upwards or downwards. By using this information, traders can identify very s
Индикатор автоматически рассчитывает уровень и  реальный объем   Point of control, а так же отображает профиль рынка для массива свечей, в границах прямоугольника. Если ваша стратегия основана на взятии прибыли на отскоке от ценовых накоплений, индикатор Range profile станет главным инструментом в торговле скальпингом. Рассчет Point of control осуществляется на основе рассчета суммарного объема для каждого тика или по минутным свечам, в зависимости от настроек и таймфрейма торговли. При отсутств
Отображение стакана цен. Возможно отображения до шестнадцати инструментов. Есть автопрокрутка цен, которую можно отключить нажатием на "А" в верхней части окна. Вполне красивый индикатор, может выступать в качестве заставки, будет не так скучно смотреться как обычный график, в самый раз для медитации, особенно после больших потерь на рынке. Индикатор не для торговли, так будет целее ваш депозит. На видео отображается ускоренное воспроизведение ранее сохранённых данных. Внимание, в тестере страте
С этим продуктом покупают
Важным ключевым элементом в трейдинге являются зоны или уровни, от которых принимаются решения о покупке или продаже торгового инструмента. Несмотря на попытки крупных игроков скрыть свое присутствие на рынке, они неизбежно оставляют следы. Наша задача заключалась в том, чтобы научиться находить эти следы и правильно их интерпретировать. INSTRUCTIONS     RUS   -    ENG                    Рекомендуем использовать с индикатором -   TPSpro  TREND PRO -  Version MT4 Основные функции: Отображения а
IVISTscalp5
Vadym Zhukovskyi
5 (6)
Что нового в индикаторе прогнозов iVISTscalp5 (Версия 10)? iVISTscalp5 – это авторская система прогнозов для любого финансового инструмента на неделю вперед (для быстрого скальпинга по уровням времени). iVISTscalp5 – инструмент для простого изучения и понимания финансового рынка. 1)     Индикатор прогнозов iVISTscalp5 полностью переписан на другой язык программирования ( C ++), что ускорило загрузку и обработку данных. Разное графическое отображение прогнозов на графике будет еще проще для п
note: this indicator is for METATRADER4, if you want the version for METATRADER5 this is the link:  https://www.mql5.com/it/market/product/108106 TRENDMAESTRO ver 2.4 TRENDMAESTRO recognizes a new TREND in the bud, he never makes mistakes. The certainty of identifying a new TREND is priceless. DESCRIPTION TRENDMAESTRO identifies a new TREND in the bud, this indicator examines the volatility, volumes and momentum to identify the moment in which there is an explosion of one or more of these data a
TPA True Price Action indicator reveals the true price action of the market makers through 100% non-repainting signals strictly at the close of a candle! TPA shows entries and re-entries, every time the bulls are definitely stronger than the bears and vice versa. Not to confuse with red/green candles. The shift of power gets confirmed at the earliest stage and is ONE exit strategy of several. There are available now two free parts of the TPA User Guide for our customers. The first "The Basics"
The AT Forex Indicator MT5 is a sophisticated trading tool designed to provide traders with a comprehensive analysis of multiple currency pairs. This powerful indicator simplifies the complex nature of the forex market, making it accessible for both novice and experienced traders. AT Forex Indicator uses advanced algorithms to detect trends, patterns and is an essential tool for traders aiming to enhance their forex trading performance. With its robust features, ease of use, and reliable signal
Сейчас 147 долл. США (увеличиваясь до 499 долл. США после нескольких обновлений) - неограниченные учетные записи (ПК или Mac) Руководство пользователя + Обучающие видео + Доступ к приватному Discord-каналу + VIP-статус и мобильная версия + Лицензия на 5 ПК с неограниченным количеством аккаунтов и терминалов MT4. Сколько раз вы покупали индикатор торговли с замечательными обратными тестами, доказательствами производительности на живых счетах и зашикарными цифрами и статистикой, но после испо
Индикатор Elliott Wave Trend был разработан для научного подсчета волн на основе шаблонов и паттернов, впервые разработанных Чжон Хо Сео. Индикатор нацелен на максимальное устранение нечеткости классического подсчета волн Эллиотта с использованием шаблонов и паттернов. Таким образом индикатор Elliott Wave Trend в первую очередь предоставляет шаблон для подсчета волн. Во-вторых, он предлагает структурный подсчет волн Wave Structural Score, которые помогает определить точное формирование волны. Он
Уровни коррекции Фибоначчи представляют собой метод технического анализа для определения уровней поддержки и сопротивления. Индикатор TSO Fibonacci Chains отличается от стандартных уровней коррекции Фибоначчи тем, что для каждого уровня коррекции дополнительно доступны цели. Другими словами, для каждого уровня коррекции (С) доступен уровень расширения Фибоначчи (D). Индикатор сканирует график для определения точек максимального и минимального ценового уровня. Затем он начинает вычислять цепи Фиб
Happy entries
Godwill Fortune Otieno Juma
The  product gives optimized entries for 3min ,1 hr and day timeframes  Does well with indices  ASIAN- HK50 AND CHINA A50 USA-US30,US100,US500 GER40 ,UK100 For stocks trade with the day timeframes Happy Entry employs advanced algorithms and real-time data analysis to identify optimal entry points with unprecedented accuracy. Its adaptive nature allows it to seamlessly adjust to changing market conditions, ensuring you never miss out on profitable opportunities. Whether you're a beginner or sea
Это, пожалуй, самый полный индикатор автоматического распознавания гармонического ценообразования, который вы можете найти для платформы MetaTrader. Он обнаруживает 19 различных паттернов, воспринимает проекции Фибоначчи так же серьезно, как и вы, отображает зону потенциального разворота (PRZ) и находит подходящие уровни стоп-лосс и тейк-профит. [ Руководство по установке | Руководство по обновлению | Устранение неполадок | FAQ | Все продукты ] Он обнаруживает 19 различных гармонических цен
This indicator belongs to the family of channel indicators. These channel indicator was created based on the principle that the market will always trade in a swinging like pattern. The swinging like pattern is caused by the existence of both the bulls and bears in a market. This causes a market to trade in a dynamic channel. it is designed to help the buyer to identify the levels at which the bulls are buying and the bear are selling. The bulls are buying when the Market is cheap and the bears a
Индикатор предназначен для того, чтобы вовремя закрывать позиции по рынку. Например: досрочно фиксировать прибыль, если цена не достигла TakeProfit, а рынок разворачивается. Индикатор анализирует импульс, а не тренд. О тренде никакой информации он не дает. Индикатор хорошо подходит для поиска дивергенции. Индикатор Ershov 38 Parrots динамически подстраивается под рынок и выявляет импульсы движения цены средней и высокой амплитуды. На мелкие скачки цены почти не реагирует.  Принципиальное о
WHY IS OUR FXACCCURATE LS MT5 THE PROFITABLE ? PROTECT YOUR CAPITAL WITH RISK MANAGEMENT Gives entry, stop and target levels from time to time. It finds Trading opportunities by analyzing what the price is doing during established trends. POWERFUL INDICATOR FOR A RELIABLE STRATEGIES We have made these indicators with a lot of years of hard work. It is made at a very advanced level. Established trends provide dozens of trading opportunities, but most trend indicators completely ignore them!
MetaForecast M5
Vahidreza Heidar Gholami
5 (2)
MetaForecast предсказывает и визуализирует будущее любого рынка на основе гармонии в данных о ценах. Хотя рынок не всегда предсказуем, если существует узнаваемый паттерн в ценах, то MetaForecast способен предсказать будущее с наибольшей точностью. По сравнению с другими аналогичными продуктами, MetaForecast способен генерировать более точные результаты, анализируя тренды на рынке. Входные параметры Past size (Размер прошлых данных) Указывает количество баров, которые MetaForecast использует дл
Индикатор Gann Squares представляет собой мощный инструмент для анализа рынка, основанный на математических концепциях, представленных W.D. Gann в его статье "Математическая формула для прогнозирования рынка." Этот индикатор включает в себя техники Ганна, связанные с квадратными числами, такими как 144, 90 и 52, а также Квадрат 9. Кроме того, он включает метод по использованию Квадрата 9 в сочетании с каналами и паттерном звезды. Руководство пользователя и использование: Перед использованием это
Ищете мощный индикатор для торговли на рынке Форекс, который поможет вам с легкостью определить прибыльные торговые возможности? Не ищите ничего, кроме Beast Super Signal. Этот простой в использовании индикатор, основанный на тренде, постоянно отслеживает рыночные условия, ищет новые развивающиеся тренды или отслеживает уже существующие. Beast Super Signal дает сигнал на покупку или продажу, когда все внутренние стратегии совпадают и на 100% совпадают друг с другом, что устраняет необходимость
«Пиранья» - автономная торговая система, определяющая уровни перекупленности и перепроданности на графике. Красная и синяя зоны отображают уровни перекупленности и перепроданности соответственно. Вход в сделку обозначен стрелками: стрелка вниз в красной зоне для "sell" и стрелка вверх в синей зоне для "buy". Уровень Тейк профита обозначен зеленой средней скользящей. Важные особенности: Регулировка уровня Тейк профита при изменении положения зеленой средней скользящей. Возможность усреднения пр
Currently Price  20% OFF  ( for unlimited use ) Indicator   USER MANUAL , trade setups, solving issues, etc :  Direct Download Here     (  for users only  ) Hello World! Introducing.. SMCpro tool and Indicator for  MetaTrader 5 , a cutting-edge feature designed to revolutionize your trading experience. With innovative ICT Smart Money Concept, you gain unparalleled insight into market dynamics, empowering you to make informed trading decisions like never before. SMC Indicator built on th
Introduction to Fractal Pattern Scanner Fractal Indicator refers to the technical indicator that makes use of the fractal geometry found in the financial market. Fractal Pattern Scanner is the advanced Fractal Indicator that brings the latest trading technology after the extensive research and development work in the fractal geometry in the financial market. The most important feature in Fractal Pattern Scanner is the ability to measure the turning point probability as well as the trend probabil
Native Channels
BeeXXI Corporation
5 (1)
Данный индикатор распознает все уровни поддержки и сопротивления. Применены ряд уникальных высокопроизводительных методик, которые сделали возможным существование данного индикатора. Естественным образом видны все сформированные каналы:   горизонтальные линейные линейные параболические кубические (Полином 3 степени - Волна) Это происходит благодаря связке аппроксимирующих каналов. Сформированные каналы в иерархической последовательности образуют "стоячие волны". Таким образом видны все уров
Introduction to X3 Chart Pattern Scanner X3 Cherart Pattern Scanner is the non-repainting and non-lagging indicator detecting X3 chart patterns including Harmonic pattern, Elliott Wave pattern, X3 patterns, and Japanese Candlestick patterns. Historical patterns match with signal patterns. Hence, you can readily develop the solid trading strategy in your chart. More importantly, this superb pattern scanner can detect the optimal pattern of its kind. In addition, you can switch on and off individu
Способ применения Pair Trading Station Рекомендуется использовать Pair Trading Station на таймфрейме H1 с любой валютной парой. Чтобы получить сигналы на покупку и продажу, следуйте указанным ниже инструкциям по применению Pair Trading Station в терминале MetaTrader. При загрузке Pair Trading Station на график индикатор оценит доступные исторические данные на вашей платформе MetaTrader для каждой валютной пары. В самой начале на графике отобразятся исторические данные, доступные для каждой валют
This is an indicator that includes the best basic forex indicators, without redrawing. Based on this data, a sell or buy signal is generated. It does not disappear anywhere after the signal, which gives us the opportunity to see the results on the history. It can be used on any currency pair, crypto, metals, stocks It is best used on an hourly chart, but other periods are also acceptable. The best results for the period H1,H4,daily If customers have any questions, I will answer them and
WHY IS OUR FXACCCURATE TCT MT5 THE PROFITABLE ? Gives entry, stop and target levels from time to time. It finds Trading opportunities by analyzing what the price is doing during established trends. We have made these indicators with a lot of years of hard work. It is made at a very advanced level. Established trends provide dozens of trading opportunities, but most trend indicators completely ignore them! The trend reveals trading indicator represents an average of 10 different trades per trend
PTS - Divergence Buy Finder от Precision Trading Systems Precision Divergence Finder был разработан для точного определения дна рынка и часто успешно справляется с этой задачей. В техническом анализе искусство выбора дна обычно намного проще, чем выбор вершины, и этот инструмент разработан именно для этой задачи. После обнаружения быстрой дивергенции мудро подождать, пока тренд не изменится вверх, прежде чем покупать. Для входа можно использовать высокий уровень за 10 или 20 баров или скользящее
Price Action Scanner Pro is an indicator that identifies price behaviors and provides alerts, offering more features and customization compared to Price Action Scanner. This indicator can simultaneously detect signals for up to 15 symbols across different timeframes. You can configure it to detect signals during specific trading sessions such as Asian, European, and US sessions, using different timeframes. This allows you to use lower timeframes for active trading periods and higher timeframes
GannRS Trend Scalper   GannRS is an advanced trading tool based on Gann Law and Supports and Resistances. designed to have an   active trading at any time not lagging Indications are given at the beginning of a new candle Please watch the full tutorial video. How to use GannRS Very easy to set up... Put it on your chart Adjust inputs Inputs Show Resistance and support : [bool]  true = Shows R/S on chart false = does not show Show Levels :[bool]  true = Shows levels on the chart false = doe
Matreshka
Dimitr Trifonov
5 (2)
Самотестируемый и самооптимизируемый и ндикатор Matreshka: 1. Я вляется интерпретацией Теории Волнового Анализа Элиотта. 2. За основу взят принцип индикатора типа ZigZag, а волны строятся на принципе интерпретации теории ДеМарка. 3. Фильтрует волны по длине и высоте. 4. Рисует до шести уровней ZigZag одновременно , отслеживая волны разных порядков. 5. Отмечает Импульсные и Откатные волны. 6. Рисует стрелки для открытия позиций 7. Рисует три канала. 8. Отмечает уровни поддержки и сопротивления. 9
The iChannels
BeeXXI Corporation
5 (2)
Сверхбыстрое распознание параболических каналов ( а также линейных, горизонтальных и волнообразных) на всей глубине истории, создавая иерархию каналов. Необходима настройка: Max bars in chart: Unlimited Данный индикатор предназначен в первую очередь для алгоритмического трейдинга, но можно использовать и для ручной торговли  Данный индикатор будет иметь в ближайшем будущем очень активную эволюцию и подробные описания, как применять для создания роботов
Translated with google from english ---- Этот индикатор создает тепловую карту на основе глубины рынка текущего или другого символа. Другой символ полезен, когда вы торгуете на фьючерсном рынке, а контракт имеет "мини" и "полный" сплит. Например, в Бразилии (B3 - BMF&Bovespa) WDO и DOL являются будущими валютными контрактами BRL/USD (где 1 DOL = 5 WDO), а крупные банки работают в основном с DOL (где важна ликвидность). Пожалуйста, используйте с таймфреймом M1, объекты слишком малы, чтобы отобр
Другие продукты этого автора
Indicator for fast navigation through financial instruments. When you click on the button, you go to the chart of the financial instrument, the name of which was written on the button. In other words, the indicator opens or unfolds an existing chart window. For each chart, you can customize the name of the financial instrument, text color and background color; in total, you can customize symbols buttons that you trade often. The indicator can be installed on any charts for which you need to swit
FREE
This indicator labels swing highs and swing lows as well as the candle pattern that occurred at that precise point. The indicator can detect the following 6 candle patterns:   hammer ,  inverse   hammer ,   bullish engulfing ,   hanging man ,   shooting star   and   bearish engulfing . The notations HH, HL, LH, and LL you can see on the labels are defined as follows: HH : Higher high HL : Higher low LH : Lower high LL : Lower low Setting Length: Sensitivity of the swing high/low de
Lets dabble a bit into Elliot Waves. This is a simple indicator which tries to identify Wave 1 and 2 of Elliot Impulese Wave and then projects for Wave 3. Ratios are taken from below link: https://elliottwave-forecast.com/elliott-wave-theory/ - Section 3.1 Impulse Wave 2 is 50%, 61.8%, 76.4%, or 85.4% of wave 1 - used for identifying the pattern. Wave 3 is 161.8%, 200%, 261.8%, or 323.6% of wave 1-2 - used for setting the targets Important input parameters MaximumNumBars : To calculate
Market Profile Heat indicator  — is a classic Market Profile implementation that can show the price density over time, outlining the most important price levels, value area, and control value of a given trading session. This indicator can be attached to timeframes between M1 and D1 and will show the Market Profile for daily, weekly, monthly, or even intraday sessions. Lower timeframes offer higher precision. Higher timeframes are recommended for better visibility. It is also possible to use a f
This indicator labels swing highs and swing lows as well as the candle pattern that occurred at that precise point. The indicator can detect the following 6 candle patterns:   hammer ,  inverse   hammer ,   bullish engulfing ,   hanging man ,   shooting star   and   bearish engulfing . The notations HH, HL, LH, and LL you can see on the labels are defined as follows: HH : Higher high HL : Higher low LH : Lower high LL : Lower low Setting Length: Sensitivity of the swing high/low de
Lets dabble a bit into Elliot Waves. This is a simple indicator which tries to identify Wave 1 and 2 of Elliot Impulese Wave and then projects for Wave 3. Ratios are taken from below link:   https://elliottwave-forecast.com/elliott-wave-theory/   - Section 3.1 Impulse Wave 2 is 50%, 61.8%, 76.4%, or 85.4% of wave 1 - used for identifying the pattern. Wave 3 is 161.8%, 200%, 261.8%, or 323.6% of wave 1-2 - used for setting the targets Important input parameters MaximumNumBars : To calc
Фильтр:
Нет отзывов
Ответ на отзыв