Смотри обучающее видео по маркету на YouTube
Как купить торгового робота или индикатор
Запусти робота на
виртуальном хостинге
виртуальном хостинге
Протестируй индикатор/робота перед покупкой
Хочешь зарабатывать в Маркете?
Как подать продукт, чтобы его покупали
Платные торговые роботы и индикаторы для MetaTrader 5 - 54
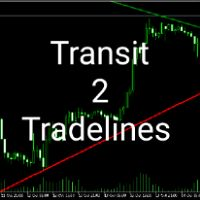
Transit2Trendline this indicator system is made to reduce the job of analyzing and to help those who can't or don't know how to draw trendlines.Transit 2 Trendlines draws only two important trendlines, support and resistance. The diagonal support is drawn in red color .The diagonal resistance is drawn in green color. Note this are very important trendlines which can easily be traded with the classic strategy of trendlines, breakout and retest. The Transit 2 Trendlines will draw patterns selected
RSI Traffic Light Indicator tracks several RSI ( Relativ Streng Index) Periods and informs you, if the trend is changing. Trend is you friend, one of the classical Trend following is the Relativ Streng Index (RSI). With RSI Traffic Light Indicator you will get information about trendchange. The RSI Traffic Light Indicator alerts you if the trend is changing for your pair. Different trendchange criterials and visualisation themes inclusive. Your can adjust the indicator Trendchange criterials by

This EA helps chart pattern traders to automate thier task of placing trades. All you need to do is to draw your trend lines and name your trendlines to match the object name input in the EA.
The EA is safe to turn off anytime.
The input parameters are as follows: UpperBorderline : Upper border line of chart UpperEnteryLine: For entering trades UpperTPLine: Trendline for Take profit LowerBorder: Lower border line of chart LowerTPLine: Take profit line for lower trend line BorderChannel:

Hello;
Tw79 time zone pivot strategy indicator finds important breakdowns and ensures the continuity of the total profit target by maintaining the profit margin in the same direction after the breakdowns.
Indicator input descriptions;
Start Hours: Indicates the start and reference point. Use a number zero or one.
Offset: It expresses the number of bars to be calculated after the reference. Average values are between 55-144.
Number of bar: It represents the last candle to be calculated

Приготовьтесь революционизировать свой торговый опыт с помощью советника Intraday News для платформы MT5! Этот передовой инструмент специально разработан для торговли новостями и позволяет вам извлечь выгоду из таких важных событий, как отчет о занятости в несельскохозяйственном секторе (NFP). Вы никогда не пропустите ни одной детали на валютном и фондовом рынках. Настройте свою торговую стратегию с помощью настраиваемых входных данных для лотов, времени торговли, движения цен и множителей март

This indicator draws a price area in which the volume percentage was traded the day before. The chart shows the days with vertical lines and two horizontal lines to indicate the upper price and the lower price of the percentage of volume was traded the day before. The upper/lower lines start and end with the day calculated. But they are referred with the values of the day before. NOT the day in which are. With this indicator you can see where the volume moved in the day before. It uses percenti

Promotion $66 lifetime for you.
The principle of this indicator is very simple: detecting the trend with Moving Average, then monitoring the return point of graph by using the crossing of Stochastic Oscillator and finally predicting BUY and SELL signal with arrows, alerts and notifications. The parameters are fixed and automatically calculated on each time frame. Example: If you install indicator on EURUSD, timeframe M5: the indicator will detect the main trend with the Moving Average on this t

Check out the new pull back strategy Expert Advisor that I'm working on right now. Get it while it's still free!
https://www.mql5.com/en/market/product/97610
Before you buy this expert adviser I strongly recommend to download FREE DEMO and test it in your Strategy tester few times. When you are satisfied with the results, you can come back to this page to buy full version for your real account.
This expert adviser was designed specifically for Volatility 75 index ( VIX75 ), also shows o

Xtrade Trend Detector is an indicator capable of finding the best opportunities to take a position in any stock market. Indeed, it is a great tool for scalpers but also for Daytraders. You could therefore use it to identify areas to trade, it fits easily on a chart. I use it to detect trends on Big timeframes and take positions on Small timeframes. Don't hesitate to give me a feedback if you test it.

The Squeezer indicator simply draws ascending lines with Sell signal in the downtrend and descending lines with Buy signal in the uptrend to catch the pullbacks and sniper entries. This is a common successful trading strategy being used by many successful traders, and the good thing about this strategy is that it works with all time frames. The difference is in the take profit level between them. Buy / Sell signals are triggered at the close of the current candles above / below the ascending or

Expert Advisor for Automatic Stop Loss and Take profit , calculated by Pips and cover all major pairs . you can activated the EA in your chart then place orders manually and the EA will be place TP and SL automatically for all opened orders , covered Buy market , Sell Market , Buy stop , Sell Stop , Buy limit , Sell limit . it is an easier tool that help you manage your order without effort . 10 Pips = 100 Points Pending orders SL and TP will be placed once order is activated . MT4 Version : ht

This indicator draws the high intraday price and the low intraday price of the first n minutes of the day. The chart shows the days with vertical lines and two horizontal lines to indicate the max and the min close price of the n first minutes of the day. The max/min lines start and end with the day calculated. With this indicator you can see how starts the day compared with the previous days. It is valid for any market inasmuch as the start time is calculated with the data received.
Paramete

MACD Scanner provides the multi symbols and multi-timeframes of MACD signals. It is useful for trader to find the trading idea quickly and easily. User-friendly, visually clean, colorful, and readable. Dynamic dashboard display that can be adjusted thru the external input settings. Total Timeframes and Total symbols as well as the desired total rows/panel, so it can maximize the efficiency of using the chart space. The Highlight Stars on the certain matrix boxes line based on the selected Scan M
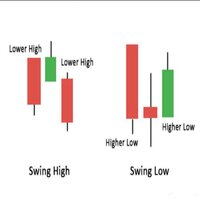
This indicator plots any and every swing high or swing low on your chart.
A swing high or low candle formation comprises of a minimum of 3 candles whereby the middle candles high/low is the highest or lowest point amongst the three candles. The direction (bullish/bearish) of the middle candle is irrelevant. Swings are very useful patterns that can be used to determine market structure as well as potential price reversal points on a chart.
This indicator is derived from the Bill Williams Frac
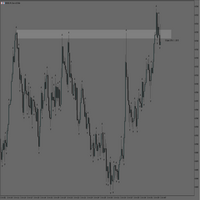
MT5 Rectangle Extender Indicator is a simple and easy tool that automatically extends any box/rectangle drawn on the chart to the right edge of the screen. This tool can be used for easy drawing of zones and can help with determining future areas of interest on the chart once price trades back to those levels. Very suitable for supply and demand, order blocks, POI's (Points of Interest) mapping on charts. Sometimes its better to have a zone than a single price level as price can shoot above or
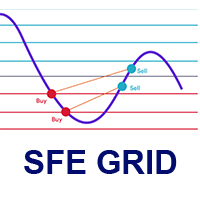
This EA is an Utility for define and execute a grid strategy. Join to the telegram group you can find in my profile page for have access to the different strategies proposed by the SFE community. BACKTEST AND LIVE The EA must be used on a M5 timeframe chart.
The current version works only in the Long side, and with symbols like BTC, ETH, GOLD, Stock Indices, STOCKS.
Do not work on Forex symbols.
This is a deliberate restriction, because the idea behind is use the strategy under 'reas

Scanner and Dashboard for Money Flow Index MT5 The Money Flow Index (MFI) is a technical oscillator that uses price and volume data for identifying overbought or oversold signals in an asset. It can also be used to spot divergences which warn of a trend change in price. The oscillator moves between 0 and 100.
Advantages of the Scanner: - Full Alert Options. - Multi Timefrare - Works for all instruments including Currencies, Indices, Commodities, Cryptocurrencies and Stocks. - Fully customisab

Black Cat MT5 is a fully automated scalping robot that uses a breakout strategy. The minimum deposit is $100 for a 1:100 leverage and use account with low spread and a fast VPS . Requirements Trading pairs EURUSD
Timeframe H1
Minimum deposit
$100
Leverage
1:100 Brokers
Hedging account with low spreads
Features - Works by pending orders.
- Does not use averaging or martiangle.
- Always use strict stoploss management, so there will be no big DD.
- Can be g

Symbol: XAUUSD Attach to any timeframe Min deposit: 1500$ - Calculate profit by month
If you want daily trade, this product maybe not suit with you. Because, Too frequent deals may negatively impact copying results
Please use cent account if you not enough money
Important : Please withdraw all profit weekly or monthly
Risk Warning: Trading Forex and Leveraged Financial Instruments involves significant risk and can result in the loss of your invested capital. You should not invest m
This indicator compares volumes from the same period to previous days instead of calculating the average of previous candles, so it is possible to detect volume anomalies more accurately.
I have always been bothered by seeing very large volumes at the beginning of a trading day and almost no volume throughout the day, making volume-based strategies very limited. This indicator can verify the strength of the volume of candles based on previous days, so it is possible to perceive volumes that ar

MACros is based on Exponential Moving Average Crossover:
It can be used for: All Pairs: Forex, Cryptocurrencies, Metals, Stocks, Indices. All Timeframe All Brokers All type of Trading Style like Scalping, Swing, Intraday, Short-Term, Long-Term etc. Multiple Chart
*** MT4 Version-->> https://www.mql5.com/en/market/product/87538
Notification Setting: All type of notifications and Pop-Up available with this Indicator. (Can manually ON/OFF the notification as per requirements.)
Special Not

Good money/risk management is more than just position sizing, it's much more. Successful traders analyze your trading activities and keep an eye on your key figures. With the help of AccountMan you can also do this very conveniently, analyze your trading activities for the purpose of professional money / risk management. Evaluate your trades by trade symbol to see if trading is profitable overall with these. Would you like to keep an eye on your individual strategies? e.g. which strategy works b
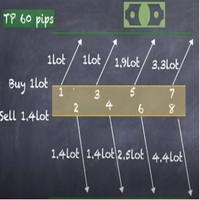
Strategy description can be seen in the attached video( https://www.youtube.com/watch?v=JzN1fEZmc40 ).
This hedging strategy strictly follows what is presented in the video.
The strategy works on any pair of forex, crypto, indices and other derivatives.
Through the settings, you can customize the size of lots, add pairs for operation, and profit and loss points.
The distance between sell and buy orders must be configured according to the number of decimal places of the pairs that will be
This EA is designed to automate Larry Connor’s System TPS - ( Time Position & Scale ) first described in his book “High Probability ETF Trading ” https://www.amazon.com/High-Probability-ETF-Trading-Professional/dp/0615297412 The operation of TPS can be summarized as follows: 1. Trade an ETF or Cash Index 2. The Index trades above its 200-day moving average 3. Open a 10% long position, if the 2-period RSI is below 25 for two days in a row 4. Increase position size by 20

Monitor your favorite Symbols My #1 Utility: includes 65+ functions, including this tool | Contact me if you have any questions This tool opens in a separate window: it can be moved (drag anywhere), and minimized [v]. You can adjust the Watchlist on the panel: Click [edit list] to add / remove the Symbols from the Watchlist. Calculated value: it may either be the last [closed bar], or the current [floating bar]. Select the [timeframe] for calculation. There are 2 types of the value sorti

The purpose of the Combo OnOff indicator is combine differerent tecniques and approachs to the market in order to spot signals that occur simultaneosly. A signal is more accurate if it is validate from more indicators as the adaptive expectations can be used to predict prices.The On-Off feature and alarms help to look for the better prices to enter/exit in the markets
Moving Averages are statistics that captures the average change in a data series over time
Bollinger Bands is formed by upp

Trailing Stop toolbox MQL5, better and friendly. Trailing Stop tool box using Moving Average, Parabolic SAR, Ichimoku Kijun-sen, trailing stop normal, trailing stop by candle, trailing stop by targets and trailing stop by lowest, highest candle numbers. Manage orders by currency pairs and comments, trailing one or many orders at same time. Mql4 versition: https://www.mql5.com/en/market/product/68181
Workflow: Set your comment, profit, stoploss, lotsize, t imeframes and chose indicator for beg

Strategy Name: Horse Trader Robot HT01 Description: Horse Trader Robot HT01 is a fully automated robot. This uses a price action strategy, advanced money management. It is most effective in trend reversal. Maintained excellent risk- reward. Tested in real accounts with profits and guarantee of profit in future. Suitable for both beginners and experienced traders. It will put trade at market price once signal generated. Once trade is activated stoploss is placed as per strategy and take

Potential loss on all active and pending trades: if SL levels will be reached (or the current floating loss if the SL level is not set) My #1 Utility: includes 65+ functions, including this indicator | Contact me if you have any questions In the input settings you can adjust: Calculateion method : account currency / pips / points / % of the balance Position on the chart: bottom left / bottom right / top left / top right corner
Font: color, size and style Optionally you can includ

Fast Trade Detector (FTD) - Самый правдивый индикатор, который показывает истинное
настроение Большого Игрока.
На бирже есть Игрок, у которого есть всё для того, чтобы быть в первых рядах в книге торговых
приказов (биржевом стакане). Эти сделки как индикатор рыночного настроения сильного игрока.
Вы поймёте, что всё не совсем так, как представляли раньше. Вам откроются алгоритмы и стратегии
крупного участника рынка. Исполнение индикатора в виде гистограммы в подвале графика. Гистогра

Good Day,
"Horse Trader" is an Expet Advisor and Trding Robot which is based on Technical Analysis Indicator. This Algorithm is developed with extensive research to give best results over a period of time. It is based of low loss high return principle that helps to cut losses when trade goes wrong and during profits it keeps running a trade so that maximum profits can be taken out through the same. there are two kind of "Horse Trader" algorithms one focuses only on buy side trades with smal
Absolute volatility for each day for the last 4 weeks My #1 Utility: includes 65+ functions, including this indicator | Contact me if you have any questions The indicator is displayed in a separate window, it can be moved to any place on the chart. In the input settings you can adjust: Interface theme : dark / white; Calculation method: price, pips, points, % change;
Panel size Font size

Supply / demand zones: observable areas where price has approached many times in the past. My #1 Utility: includes 65+ functions, including this indicator | Contact me if you have any questions The indicator shows where the price could potentially be reversed again. Usually, the more times the price has been rejected from the level, the more significant it is. In the input settings you can adjust: Enable or disbale Weak zones; Show or hide zone description; Font size; Set the bas
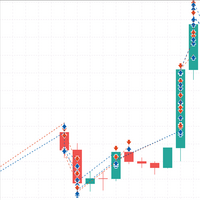
MT4 Version : https://www.mql5.com/en/market/product/87060 Matrix Hacker предназначен только для хеджированных счетов и использует случайное блуждание, прошлое не имеет значения. Советник поддерживает стабильную позицию на рынке и покрывает как запросы, так и запросы. Покупает и продает биды и аски с разным размером и объемом в зависимости от трейдера. Это не рекомендуется для новичков, так как все еще требует знаний об оптимизации, а не о чрезмерном использовании. Я рекомендую использовать н
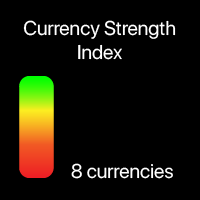
Current strength of the 8 major currencies My #1 Utility: includes 65+ functions, including this indicator | Contact me if you have any questions The indicator is displayed in a separate window, it can be moved to any place on the chart. In the input settings you can adjust: Interface theme : dark / white; Prefix and Suffix, if the currency pairs on your broker have it:
(e.g. if Symbol is "EURUSD .pro ", please set " .pro " as a Suffix); Panel size Font size

Ichimoku Aiko MTF is a collection of technical indicators that show support and resistance levels, as well as momentum and trend direction. It is a multi-timeframe indicator so you don't need to change the chart timeframe when you want to see the ichimoku clouds on a higher timeframe. eg. The chart timeframe is M15 and you want to see on the M15 timeframe chart the H1 ichimoku indicators (the ichimoku in Metatrader can't do that) that's why you need to use Ichimoku Aiko MTF.
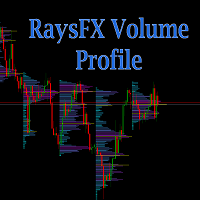
Calculation method The calculation method is summing the number of deals performed at a certain price. Alternatively, the volumes at a certain price can be summed if the real volume type is set in the parameters. The trade data is interpolated based on the most accurate terminal data available (М1 timeframe data). Each bar is divided into several trades based on the estimated price movement inside the bar. This is a distinguishing feature of the product setting it apart from other ones that hav

Harpoon :It is a fully functional automated system that uses a tested strategy to exit statistically significant price levels and adapts to different conditions. This system is adjusted taking into account the delay in the execution of orders at different stages of the transaction. Expert Advisor uses price action to determine levels, which is an undeniable advantage compared to constantly lagging indicators. Signal : https://www.mql5.com/en/signals/1251860
Considering that this expert mus

Discount on all my products until 01.05. Gold Veritas — полностью автоматический советник для работы на рынке Форекс в спокойные часы. Мониторинг работы советника: https://www.mql5.com/ru/users/bayburinmarat/seller Правильная настройка GMT: https://www.mql5.com/ru/blogs/post/743531 Все параметры, необходимые для максимально понятной и простой оптимизации, доступны всего в 6 пунктах настроек.Вы можете адаптировать советник под свои предпочтения: настроить уровни риска или настроить его самос
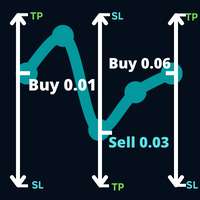
Откройте направление в сделке, за которой рынок намеревается следовать, и сделку, которая произошла в вашей сделке.
Пример: операция покупки с лотом 0,01 по цене 0,03 пункта, покупка с лотом 0,01 по цене 0,01.0930, затем будет принято решение о стоп-приказе на продажу 0,03. выставляется новый стоп-ордер на покупку с лотом 0,06 по цене 1,0930.
Параметры: Громкость -> Громкость первой операции.
Take Profit -> Гарантированная прибыль в количестве пунктов.
Max Hedge -> Контролирует
Algo Bot is an expert advisor that is designed and optimized for GBPUSD. It is extremely easy to use, just open the GBPUSD pair, load the bot and activate Algo Trading. You can leave the default values. This bot does not use any technical indicator, its algorithm is based on price action, placing BuyLimit and SellLimit orders in optimal zones for GBPUSD.
The parameters of the EA are: Magic number: Number to identify the positions of this EA. Points to place the next order: Points at which the

The KT Tether Line is a trend-following tool consisting of three indicators that work together to generate trading signals. It can correctly identify market trends while signaling trade entries. It was first introduced by Bryan Strain in the Stock & Commodities magazine in 2000 in "How to get with the trend and out at the end."
The Concept
When a market trend is confirmed, the most challenging part is determining the timing of the entries. This indicator alerts you to potential trend reversal

The BSI stands for Bar Strength Index. It evaluates price data using a unique calculation. It displays readings in a separate window. Many financial investors mistake this indicator for the Relative Strength Index (RSI), which is incorrect because the BSI can provide an advantage through its calculation method that the RSI indicator does not. The Bar Strength Index (BSI) is derived from the Internal Bar Strength (IBS), which has been successfully applied to many financial assets such as commodit

KT Price Border creates a three-band price envelope that identifies potential swing high and low areas in the market. These levels can also be used as dynamic market support and resistance. The mid-band can also be used to identify the trend direction. As a result, it also functions as a trend-following indicator. In addition, its ease of use and more straightforward conveyance of trade signals significantly benefit new traders.
Features
It works well on most of the Forex currency pairs. It
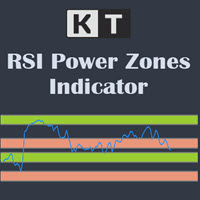
The KT RSI Power Zones divides and shows the movement of RSI into four different power zones to identify the potential support and resistance zones using the RSI.
Bull Support The bull support ranges from 40 to 50. The price is expected to reverse to the upside from this zone.
Bull Resistance The bull resistance ranges from 80 to 90. The price is expected to reverse to the downsize from this zone.
Bear Support The bear support ranges from 20 to 30. The price is expected to reverse to the

Мультивалютный торговый робот для комфортной работы на Forex. Имеет минимум настраиваемых параметров и поэтому подходит как для начинающих, так и для опытных трейдеров. Просто установите торговый робот на одну валютную пару к примеру на "EURUSD" и наблюдайте за результатами, никаких манипуляций больше делать не требуется. Не требователен к VPS-серверу и брокеру. Надежный бот который не нуждается в постоянной оптимизации - один раз установил, настроил и забыл . *напишите мне после покупки, что

KT Forex Trend Rider uses a trend following algorithm developed specifically for the Forex market to provide reliable buy & sell signals across the major currency pairs. It works best on major FX pairs and all time-frames.
Features
It comes with a Multi-Timeframe scanner that can search for upcoming signals across all the time-frames. It comes with four preset profiles to facilitate trading for scalpers, tick-trend, swing, and trend traders. It marks the potential reversal points in the mark

In MetaTrader, plotting multiple horizontal lines and then tracking their respective price levels can be a hassle. This indicator automatically plots multiple horizontal lines at equal intervals for setting price alerts, plotting support and resistance levels, and other manual purposes. This indicator is suitable for Forex traders who are new and looking for chances to make quick profits from buying and selling. Horizontal lines can help traders find possible areas to start trading when the

The KT De Munyuk is a trend-based indicator that uses Parabolic SAR to identify the market direction. The indicator shows the PSAR in the form of green/red dots using a separate window. Buy Signal: When a green dot appears after a series of at least three red dots. Buy Exit: When a red dot appears on the current or next higher time frame. Sell Signal: When a red dot appears after a series of at least three green dots. Sell Exit: When a green dot appears on the current or next higher

Вы знаете, что такое стратегия голубого океана? Это когда предприниматель выходит на совершенно новый рынок без согласования, потому что о нем никто не знает.
Таким образом, предприниматель находится в ситуации монополии и может наслаждаться этой ситуацией до тех пор, пока никто не выйдет на рынок.
И знаешь, что ?
Эта ситуация воспроизводится в бот-трейдинге благодаря советнику Blue Ocean Strategy MT5.
Я трейдер проп-фирмы и сам использую его для совершения всех своих сделок. Посл

KT Forex Blau Balance combines elements of momentum and volatility. It helps you identify entry and exit points.
Blau Balance consists of two moving averages (a slow-moving average and a fast-moving average) intersecting key transition points in market price. The indicator turns green or red when one is above or below the other, signaling to buy or sell trade signals.
It can be used in currency pairs and other markets that your MT4 or MT5 platform supports. Both short-term and long-term tra

2 copies left at 49 USD. Next price is 99 USD . set file
- This is a very aggressive trading strategy, based on a modified MACD indicator. It is used to analyze the anomalous zones of the market + author's methodology to restore the critical movement.
The strategy was developed taking into account the movement of the currency pair USDCHF and the best rates of trade just on it.
Recommendations:
- H1 USDCHF - Leverage of 1:500 or higher (ideally 1:1000 or 1:2000) - Minimum deposit 100 uni
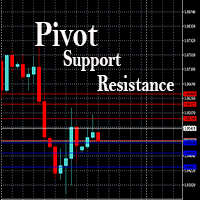
This EA is designed to calculate and draw Pivot Point, Support and Resistance for your selected time frame on the chart.
Works on all currency pair and on any time frames available on MT5.
To make sure the EA works, you need to select the pivot time frame as well as the candle shift that you want to calculate the pivot.
0 = Current candle on chart
1 = Previous 1 candle on the chart
A very good indicator for experienced and professional traders . A practical approach to trading. Easy to understand. A helping tool for traders looking for price movements .
Signals: Signal Number 1: When yellow line which is a signal line crossing the zero line towards downward direction is a selling opportunity. Signal Number 2:
When yellow line which is a signal line crossing the zero line towards upward direction is a buying opportunity.
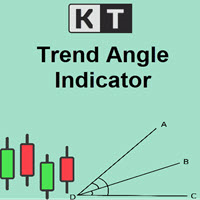
The KT Trend Angle helps to identify ranging and trending markets. The idea is to only enter a trade following the market trend if the slope is steep enough.
An angle is the ratio of the number of bars to the number of points: The bars mean the time offered by standard (M1, M5, etc.) and non-standard time frames. Points represent the unit of price measurement with an accuracy of 4 or 5 decimal places.
Input Parameters Period: An integer value to define the intensity of angled trendlines. A
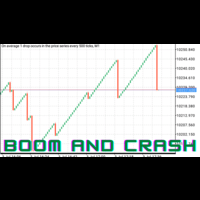
The BoomAndCrashEA , based on vector machine learning, is an advanced trading tool that uses the latest advances in computing technology to analyze the forex market and predict future price movements. The Expert Advisor will use vector machine learning to learn huge amounts of historical data and quickly and efficiently detect patterns in the market. It will use a sophisticated and complex proprietary algorithm which uses advanced mathematical calculations to solve complex problems and optimize

Средний дневной диапазон (ADR) - это индикатор, который показывает, как далеко валютная пара может продвинуться за день. Автоматически отображает верхний и нижний уровни ADR. Автоматически рассчитывает процент и расстояние ADR, достигнутый валютной парой за день. Меняет цвет и толщину линии ADR, при достижении его ценой. Расчет производится за 14 дней. Отображается на таймфреймах от М1 до М30.
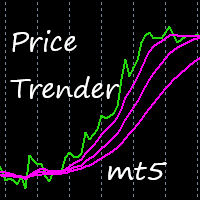
This indicator uses a special algorithm to plot the 4 lines for trading. Great for scalping. Features alerts. Settings for trend filters. How to use: Simply attach to any chart with default settings. Buy when the three pink lines converge below the green line. Sell when the three pink lines converge above the green line. Best results when looking at three or more time frames, and the three blue lines have just converged below or above the green line.
Use as you see fit for your strategy. Best r
5 EMA Scalping Strategy Multi Symbol Scanner
This EA utility will scan all symbols which are selected in marketwatch and alert when such condition is formed in chart when Candle low is above EMA 5 for Sell alert and Candle high is lower from EMA5 so you can be ready before selling or buying for scalping purpose on 5min chart For more details watch attached video Logic : When a candle closes above 5 EMA in 5 mins chart, Wait for its low to break and Sell when low is broken by wick, Your SL sh

Overview This expert advisor is based on statistic model created using historical data. Our model lead to prepare parameters to drive Martingale strategy. It plays on USDCAD pair. To work proper with full strategy EA should be able to open total positions of 3.62 lots (sum of all possible open positions at the same time) and some margin for safety. For example it can be approximately at least 1200GBP with 500:1 leverage on account. It must be able to play 0.01 lots positions. Screenshots presen

Seven copies left at $99 USD. Next price is 149 USD . set file Smooth Lift is an indicator-based trading system that includes 7 indicators, including trend indicators, volume indicators and indicators of possible price movement strength. They are used to confirm the analysis of the main Smooth Lift trading system. The trading is performed on 24/5. The strategy was developed taking into account the movement of the currency pair USDCHF and the best trading performance is on it.
Recommendations:
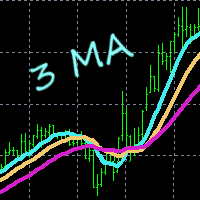
This indicator gives you a modified version of three Moving Averages. Great for scalping. Does not feature any alerts, and is best used manually after confirming multi line displays. Settings: Period1 Period2 Period3 Period4 How to use: Simply attach to any chart with default settings. Buy when the 4 lines converge below the price. Sell when the 4 lines converge above the price. Take note of the slope of Period4. See example pictures below. Best results when looking at three or more time frames
Grid Trading is a fully automated trading system that doesn't require any special skills from you. Just fire up this EA and rest. You don't need to set up anything, EA will do everything for you. EA is adapted to work on big deposit over $5000 for good work.
Timeframe: 1 Min
Currency pairs: EURUSD PROFITABILITY AND RISK The expected estimated profitability according to the backtest data is about 200% - 400% per year. The expected maximum drawdown is about 90% or more . Attention!!! This

Robot Trading Gold is a fully automated trading system that doesn't require any special skills from you. Just fire up this EA and rest. You don't need to set up anything, EA will do everything for you. EA is adapted to work on small deposit over $100 for good work.
Timeframe: 15 Min
Currency pairs: XAUUSD PROFITABILITY AND RISK The expected estimated profitability according to the backtest data is about 300% - 600% per year. The expected maximum drawdown is about 90% or more . Attention!

Индикатор работает с объектами "Трендовая линия", "Прямоугольник", "Текст" и позволяет их создавать и копировать с одного графика на другой. Является более удобной альтернативой автоматическим копировщикам, т.к. позволяет более гибко выбирать что и куда должно быть скопировано. Горячие клавиши: '1,2,3,4,5,6' - создание тонких горизонтальных линий (цвет задается в настройках), тоже самое с SHIFT - толстая линия ' ~ ' - создание линии со случайным цветом ))) '7,8,9' - создание закрашенных прямо

Optimize for time frame and asset before back test and use, use last year or monthly for parameters. XAU/USD 1 HR recommended. Parabolic works on any asset or time frame. This EA uses parabolic sar as the signal. Percentage of margin is used for entries. So for low risk it would be 1% of margin and for medium risk it would be 5-10% and high risk would be above these amounts. Also taking into account the smaller time frame or larger time frame + asset for risk management assessment.
Risk

Cоветник для ручной торговли и для управления открытыми позициями. Встроенный трейлинг стоп имеет пять режимов и семь инструментов. Есть виртуальный стоп лосс и виртуальный тейк профит, которые можно свободно передвигать по графику. С помощью встроенного симулятора торговли, вы можете проверить, как работает советник в тестере стратегий. Руководство к советнику UTrailingMinMT5 можно найти в разделе "Обсуждение". В тестере стратегий МТ5, ручное передвижение виртуальных линий SL и TP по графику не
Утилита для ручной торговли, для управления открытыми позициями. Встроенный трейлинг стоп имеет три режима и семь инструментов: по пунктам, по экстремумам баров, по MA, по фракталам, по объёмам, по Parabolic SAR и по ATR. С помощью встроенного симулятора торговли, вы можете проверить, как работает советник в тестере стратегий. Руководство к советнику UTrailingMiniMT5 можно найти в разделе "Обсуждение". Преимущества 3 режима трейлинг стопа: обычный, общий и мобильный стоп лосс; 7 инструментов для

Theoretical Foundation The Keltner Channels are channels ploted using volatility deviations above and bellow a moving average. The indicator is an excellent tool to help the trader build trend and mean-reversion strategies. Parameters The Orion Dynamic Keltner allows the user to select the Volatility Calculation Type, being ATR or Average Range (not considering price gaps). Also, the user can select the Calculation Period, Number of Deviations, Moving Average Mode and the Moving Average Ca

Theoretical Foundation Similar to the well-known Average True Range (ATR), the Average Range indicator is a volatility measure that is calculated using only the range of the bars (high – low), not considering the Gaps, as with the ATR. The Average Range can be very useful for day traders as it allows one to get the measure of the volatility of the last N bars. Parameters You can select the calculation period of the indicator.
Узнайте, как легко и просто купить торгового робота в MetaTrader AppStore - магазине приложений для платформы MetaTrader.
Платежная система MQL5.community позволяет проводить оплату с помощью PayPal, банковских карт и популярных платежных систем. Кроме того, настоятельно рекомендуем протестировать торгового робота перед покупкой, чтобы получить более полное представление о нем.
Вы упускаете торговые возможности:
- Бесплатные приложения для трейдинга
- 8 000+ сигналов для копирования
- Экономические новости для анализа финансовых рынков
Регистрация
Вход
Если у вас нет учетной записи, зарегистрируйтесь
Для авторизации и пользования сайтом MQL5.com необходимо разрешить использование файлов Сookie.
Пожалуйста, включите в вашем браузере данную настройку, иначе вы не сможете авторизоваться.