Смотри обучающее видео по маркету на YouTube
Как купить торгового робота или индикатор
Запусти робота на
виртуальном хостинге
виртуальном хостинге
Протестируй индикатор/робота перед покупкой
Хочешь зарабатывать в Маркете?
Как подать продукт, чтобы его покупали
Платные торговые роботы и индикаторы для MetaTrader 5 - 19

All Symbols AND All Time frames Scan
Document Introduction
A breakout refers to when the price of an asset moves above a resistance zone or moves below a support zone. A breakout indicates the potential for a price trend to break.Break provides a potential business opportunity. A break from the top signals to traders that it is better to take a buy position or close a sell position. A breakout from the bottom signals to traders that it is better to take sell positions or close the

Индикатор добавляет алерты к вашим объектам " Линии Фибоначчи " (Fibo Retracement) и " Расширение Фибоначчи " (Fibo Expansion) на графике. Также предусмотрено удобное меню для легкого и быстрого изменения настроек объектов Фибоначчи! Обратите внимание, данный продукт не работает в триал-версии. Пожалуйста, смотрите видео.
Особенности Алерты к линиям и расширениям Фибоначчи. Аудиоалерты, уведомления на мобильные устройства и электронную почту. До 15 уровней Фибоначчи. Постоянное звуковое оповещ

移動平均線クロス、ボリンジャーと移動平均線のクロス、移動平均線の角度でサイン表示
MT5インジケータ こちらに サイト があります。 このインジケータは3つのパターンでサインを表示(切り替え可能)します。 ① 移動平均線のクロス ② ボリンジャーバンドと短期移動平均線とのクロス ③ ボリンジャーバンドと短期移動平均線とのクロスと、中期移動平均線と長期移動平均線の角度 ⓸ ボリンジャーバンドと短期移動平均線とのクロス(サインを交互に表示) 移動平均線のクロス 指定した短期移動平均線と長期移動平均線のゴールデンクロスでは買いサイン、デットクロスでは売りサインを表示します。 ディフォルトでは短期は5,長期は20となっています。 もちろん変更可能になります。 移動平均線の種類をEMA(指数平滑移動平均線)やSMMA(平滑化移動平均)などに変更可能で適する価格も変更可能になります。 ボリンジャーバンドと短期移動平均線のクロス ボリンジャーバンド(以降BB)と短期移動平均線のクロスでサインを表示します。 ディフォルトではBB+1σと5MAのゴールデンクロスで買いサイン、BB-1σと5MAのデ

Optimize before use in back test or live for better results for you and don't forget to account for spreads and slippage in optimization. This Expert is for 1 minute charts trading BTC/USD. Bitcoin on 1 minute use MACD, CCI and RSI for entry and exit logic. This EA was back tested and traded out of sample. Each trade has a stop loss and take profit. BTC compared to the indexes and Gold have huge differences, look at the example of traditional investing vs. Bitcoin. Yellow line represents
Этот советник находит фигуры технического анализа, которые часто появляются перед разворотом тренда: "Двойное дно", "Тройное дно", "Голова-плечи" и их противоположные аналоги. Советник умеет определять их на графике валютной пары и торговать, когда фигура была сформирована и произошло её пробитие. Также, чтобы торговать исключая лишние сигналы (например при слабой волатильности), можно настраивать и оптимизировать показания некоторых индикаторов (Stochastic, ADX) и фильтр по свечам. Кроме того

Торговая система разработана для работы с золотом на временных периодах: 30M, 1H. Индикатор позволяет подстраиваться под рыночную ситуацию.
Параметры для 1H : PERIOD=9F , FILTER=300 .
Параметры для 30M : PERIOD=22B , FILTER=450 .
Допускается небольшая подстройка под конкретного брокера .
При изменении количества отображаемой истории, также может потребоваться подстройка параметров.
Индикатор не перерисовывается .
В "Gold n XAU" используются разные правила для входа

Эта долгосрочная торговая система работает на 10 парах и М5 таймфрейме, использует различные торговые системы, такие как торговля по тренду, против тренда и другие. Это увеличивает шансы на устойчивый рост и уменьшает влияние одной пары или конкретных сделок. Риск жестко контролируется. Настройки очень просты, и их не требуется менять. Оптимизация тоже не нужна. Советник умеет самостоятельно корректировать свою работу. Вместо поиска значений, удовлетворяющих историческим ценам на каждой паре, со

1. What is this Due to the limitation of MT5 software, we can only see the minimum 1-minute candlestick chart. Sometimes this is not enough for high-frequency traders, or we want to see a more detailed candlestick chart. This tool allows you to see: A candlestick chart composed of N ticks, which allows you to better understand the price fluctuations. For example, each candle line has 20 ticks, or 70 ticks.
2. Parameters: NTick = 70; // The tick cnt for one candle BandsPeriod = 20;
Thank you users for all your great reviews !
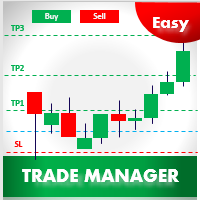
Enter the Risked Amount or Lot size or % of Balance (New!) Drag the RED line on the chart to fix the Stop-Loss. Drag Blue line (New!) for Limit/Stop orders automatically ! Adjust TP1, TP2 and TP3 lines You are ready to Buy/Sell > Adjust the lines even after the trade Reviews - https://tinyurl.com/etmreviews
Check the user video - https://tinyurl.com/etmmt4ea Check updated information on - easytrademanager.com
Automatic Breakeven TP1/2 | Book
Heikin Ashi candlesticks smooth out the price data to help traders spot trends and patterns in the market. By averaging the price values, these candlesticks provide a clearer visual representation, making it easier to identify trends and predict future movements without the noise of standard candlesticks. We at Minions Labs are revisiting this topic because of our fellow Swing Traders, who love Heikin Ashi.
WHY SHOULD I CARE about the Smart Heikin Ashi? The Smart Heikin Ashi is an innovative
This is Boleta Long & Short NT-HDG, an Expert Advisor created with the function that will make operations carried out in Long & Short much easier.
> With just one click it is possible to mount a position in two assets simultaneously, further accelerating your actions right after the decision has been made.
> With it, it is also possible to operate in Hedge accounts, being able to set up positions in the same asset, for those who have strategies for this purpose.
> Can be used in multiple
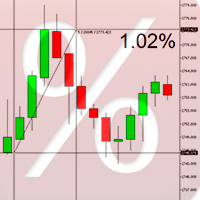
Percent Crosshair представляет собой мощный и простой инструмент измерения процентов. Быстрое измерение процентов на графике! Прекратите тратить время понапрасну! Просто прикрепите индикатор Percent Crosshair к графику, выберите на панели инструментов режим "Перекрестие" или нажмите "Ctrl+F" и используйте перекрестие привычным для вас способом! Проценты будут отображаться рядом с индикативной ценой. Настройте свой индикатор так, как удобно вам! Вам предлагаются 4 параметра для входа: Positive %

The Heikin Ashi Delta Pro leverages the refined elegance of Heikin Ashi candlesticks, renowned for their ability to filter market noise and highlight clearer trends and reversals. Building on a solid foundation, this advanced indicator integrates the Hull Moving Average method, enhancing its precision and responsiveness. Alongside an intuitive alert system, it transforms raw market data into actionable trading insights, empowering traders to make more informed decisions swiftly. Learn more about
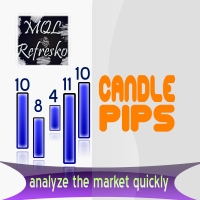
Индикатор "Candle Pips" - инструмент, позволяющий быстро увидеть размер свечи в платформе. Это хороший инструмент для трейдеров, желающих тщательно изучить рынок, а также полезный индикатор для стратегий, основанных на размере свечи. Индикатор отображает округленный размер в пипсах каждой свечи на текущем графике.
Его входные параметры просты Candle Type - часть свечи, которую необходимо измерять. "High__Low" - расстояние между максимумом и минимумом каждой свечи. "Open__Close" - размер тела с

Warren Buffett famously said: "Be greedy when others are fearful. Be fearful when others are greedy." This expert advisor captures the very essence of this wisdom.
Indeed, since 1871, the U.S. stock index S&P500 has been growing at an average annual rate of 10%. That is why Warren Buffett has been advocating investing in it.
This EA boosts the annual return to 150% (or 8% monthly) by utilizing a grid approach. Simply attach it to the S&P500 chart (or "US500" / "US500Cash" for some brokers)
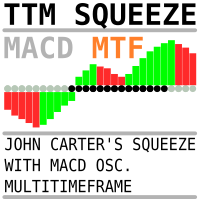
Тот же индикатор, размещённый здесь https://www.mql5.com/ru/market/product/105089?source=Site+Market+My+Products+Page , но с возможностью выбора таймфрейма. Удобно для отображения картины с разных периодов на одном графике. При использовании нескольких таймфреймов рекомендуется (А.Элдер "Как играть и выигрывать на бирже в XXI веке") придерживаться коэффициента 5 или 6. То есть два старших тайфрейма для 5-минутного графика будут 30 минут и 3 часа.

You can see Binance Spot data instantly in Metatrader 5 and it allows you to use all the features that Metatrader has provided to you. You can access the data of all symbols listed on Binance Futures. Don't forget to set the timezone. Binance it's 00:00 UTC. You need to fix it according to your own country You need to install the free Binance Spot Symbol List plugin. https://www.mql5.com/tr/market/product/83507 After loading, it automatically downloads the data of the cryptos in the market obser

You can see Binance Futures data instantly in Metatrader 5 and it allows you to use all the features that Metatrader has provided to you.
You can access the data of all symbols listed on Binance Futures. Don't forget to set the timezone. Binance it's 00:00 UTC. You need to fix it according to your own country You need to pre-install the free Binance Future Symbol List plugin. https://www.mql5.com/tr/market/product/82891 After loading, it automatically downloads the data of the cryptos in the

Здравствуйте, уважаемые трейдеры. Советник Индекс 24! Аналогов не существует! Стартовая цена советника снижена! Советник торгует 24 часа в сутки! Устанавливается на график US30. Алгоритм советника основан на анализе поведения фондовых индексов на доступной истории. Открытие сделок происходит при дивергенции фондовых индексов в истории. Уникальный алгоритм хеджироавния по двум индексам одновременно! За счет чего советник торргует с минимальными просадками. Используйте виртуальный сервер кото

Это мультивалютный и мультитаймфреймовый индикатор, который рассчитывает угол между двумя точками. Точки, для измерения угла, могут браться из индикатора ЗигЗаг (две последние точки), или из индикатора Moving Average (между двумя указанными барами), или это могут быть цены закрытия баров.
Измерение угла возможно в градусах или в радианах. Можно выбрать масштаб для расчета. Для лучшего понимания работы индикатора, вы можете изучить бесплатный индикатор Angle High Low . В параметрах вы можете

This indicator will draw a label above or below each candle based on Rob Smith's The Strat as they develop over time on your chart.
As price evolves, a candle can switch between three states. When the candle first opens, if it sits completely within the previous candles high and low, then it will start as a Type 1. As time moves on, if it breaks either the high or low of the previous candle, it will be come a type 2, and should the price action be volatile and directionless, it may then

Theoretical Foundation The Keltner Channels are channels ploted using volatility deviations above and bellow a moving average. The indicator is an excellent tool to help the trader build trend and mean-reversion strategies. Parameters The Orion Dynamic Keltner allows the user to select the Volatility Calculation Type, being ATR or Average Range (not considering price gaps). Also, the user can select the Calculation Period, Number of Deviations, Moving Average Mode and the Moving Average Ca

The main idea behind Zone Recovery is to enter trades with the trend, and if it does not reach the takeprofit, a hedging trade will be opened in the other direction with a much bigger volume to cover the losses from the first trade
Setting the time to run the expert magic number capital management trailing stop tp and sl reset line no trade at spread max Adjustable ratio

This indicator/dashboard , is place on a single symbol. It shows the percentage of movement withing all time frames from M1 to W1.The text will change green if all % are in the positive for a buy signal.The text will change red if all % are below zero and in negative for a sell signal. There are audible notifications, as well as on screen notifications along with push notifications that can be turned on and ON/OFF in the settings.
This is a sure way to Find trends quickly and efficiently, with

RTS5Pattern-touch-mouse -EN is a revolutionary statistical indicator designed for the MetaTrader 5 platform, bringing an innovative approach to technical analysis and market movement prediction. This indicator combines advanced mathematical methods, including normalization and historical data analysis, with a user-friendly interface and precise trading capabilities. RTS5Pattern-touch-mouse -EN is an ideal tool for traders looking to improve their trading strategies and achieve better results.
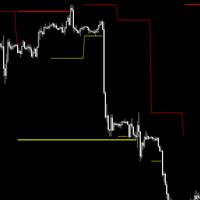
## Check screenshots to see proof that this indictor is a must! ##
Do you hate having to have a Monthly, Weekly, Daily chart when looking at your lower timeframes? I hated it too, so I made this. It will show you the High and Low of other timeframes on your chart, so you will always be aware where some support/resistance may be! Even on the 1 minute chart!
I recommend you use it 3 times, one with Day, Week and Month selected with different line widths.
I use this on every chart I look at

up down v6 for mt5 is no repaint all timeframe and all pairs indicator. red histogram cros trigger that is up point,and put a red point on histogram. and blue histogram cros trigger that is deep point.and put blue point on histogram. this indicator need to sometimes zoom out .for thise pres + button. if newly comes signal is too high makes before invisible.red and blue points are there.to see the signals. indicator is no repaint and can use all time frame and all pairs. only need minimum 500 bar

Trading Utility for Forex Currency Pairs Only not for Gold Functions Auto Lot Calculation based on Risk Auto stoploss Auto TakeProfit Breakeven Auto Close Half % Close in percentage with respect to the PIPs Pending Orders BuyLimit Sell Limit with distances BuyStop Sell Stop with distances Trading Informations Risk in percentage For Multiple trades Combine Takeprofit and Combine Stoplosses

The Binary Tend Follower indicator has been designed especially for Binary options trading. The best time frame to use the indicator on is a 1M chart with 1Min expiry's as soon as the signal candle closes. There is no need to over complicate your trading as all the thinking has been done for you. The indicator was designed as simple as possible to take out all the subjectivity of trying to follow a complicated strategy, and allowing the trader to focus on extremely simple entry's. Buy: When the

Grid trading is when orders are placed above and below a set price, creating an order grid with increasing and decreasing prices. Grid trading is most commonly associated with the foreign exchange market. In general, the technique seeks to capitalize on the normal volatility of an asset's price by placing buy and sell orders at certain regular intervals above and below a predefined base price. For example, a forex trader can place buy orders every 15 pips above a set price, while also placing se
RSI Trade X MT5 is an EA based on Relative Strength Index. Relative Strength Index parameters such as Period, BuyShift, BuyValue, SellShift and SellValue can be adjusted. RSI Trade X MT5 applies BTN TECHNOLOGY's state-of-the-art intelligent technology to help you create optimal results for your trades. May your dreams come true through RSI Trade X MT5. Good luck. === Inquiries === E-Mail:support@btntechfx.com

The market price usually falls between the borders of the channel .
If the price is out of range , it is a trading signal or trading opportunity .
Basically , Fit Channel can be used to help determine overbought and oversold conditions in the market. When the market price is close to the upper limit, the market is considered overbought (sell zone). Conversely, when the market price is close to the bottom range, the market is considered oversold (buy zone).
However, the research ca

This EA will open buy or sell orders depending on any buffer indicator just but Buy buffer and sell buffer there is a lot of settings in EA like take profit stop loss trailing stop duration time auto lot double lot required profit dollars to close close it reverse
and more you can download demo version and try it back test
Good luck -------------------------------------------------------------- السلام عليكم هذا الاكسبيرت سيفتح شراء او بيع اعتمادًا على اي مؤشر بفر الاكسبيرت يحتوي على الكثير

Hello You can copy orders between terminals for any computer via Internet (MT4 to MT4) or (MT4 to MT5) or (MT5 to MT4) or (MT5 to MT5)
it's fast Open orders Modification Stop Loss and Take Profit Close Orders This is EA (slave) put it in Experts folder you must buy (Copy orders for any computer via Internet Master) EA too from this link if you want to copy from MT4
https://www.mql5.com/en/market/product/55096 if you want to copy from MT5
https://www.mql5.com/en/market/product/56397

Introducing Project 1 RSI, an expert advisor designed to simplify your trading experience. This powerful tool offers a user-friendly interface, making it easy to modify according to your specific trading strategies. With its lightning-fast backtesting capabilities, you can swiftly evaluate different scenarios and make informed decisions. Whether you are a seasoned trader or just starting your journey, Project 1 RSI empowers you to make data-driven decisions with confidence. Experience the simpl

NO MARTINGALE, NO HEDGE, NO GRID, NO SCALP, YES TP/SL , YES Pending Order, Easy to install This is a 2 in 1 EA, you can choose the trading method at will This EA takes 200-300 Trades per year Best results are on Low Spread ECN Broker ( Important )
In this version, you can find advance settings for time filter. It also has an equity protection and margin protection for when trading. This robot works best in a low spread pair with a low slippage. It works best on H1 timeframe. This version

Our Spike Detector is specifically engineered to cater to the unique needs of traders in the Boom and Crash indices markets. This tool is optimized for M1 (1-minute) and M5 (5-minute) timeframes, ensuring you receive timely and actionable insights.
Key Features:
1. **Non-Repainting**: Our detector guarantees accuracy with non-repainting signals, ensuring your data remains consistent and reliable. 2. **Push Notifications**: Stay updated with real-time push notifications, so you never miss a

Introducing the BlackWing Signal Provider—an advanced EA designed to enhance your trading experience by facilitating seamless communication between your MetaTrader 5 platform and Telegram channels, groups, or individual users.
Key Features:
1. Real-Time Event Notifications: Receive instant alerts on new trades, modified orders, closed positions, and deleted orders. Stay informed and make well-timed decisions.
2. Interactive Chart Snapshots: Share chart snapshots along with new trades and

Технический индикатор широко известен читателям и поклонникам стратегии «черепах». Отображается линией по нижней/верхней точке цены за определенный интервал времени. Значение ценового канала также используют для определения зон поддержки и сопротивления. Если котировки актива прорывают и закрываются ниже/выше канала, то это является сигналом работы в сторону пробоя. Способы применения: Индикатор является самодостаточным и не требует дополнительных фильтров для начала работы. Однако для надёжност
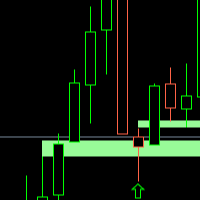
FVG WATCHER is an indicator that helps traders identify fair value gaps in the market. The indicator draws fair value gaps and alerts the user when the fair value gap has been swept. It allows users to specify how it should be swept, what time range to alert, and the size of the fair value gap to alert. It also allows the user to apply a moving average trend filter for better choice of alerts. The indicator also allows push mobile notifications. What makes FVG Watcher special is that it can be

In the ever-evolving world of Forex trading, understanding the different trading sessions is paramount to making informed trading decisions. Each trading session brings its own unique characteristics, opportunities, and challenges, and recognizing these can greatly enhance your trading strategies. Whether you're a novice or a seasoned trader, the Forex market's three main trading sessions – Asian, London, and New York – are crucial milestones that dictate market behavior and potential trade set

READ BEFORE TESTING! This EA works with EURUSD Best inputs already chosen. This is a simplified version of my other ea "The 3bar high ea". It as shown better results since I took out the macd filter. Below I present to you a 4 year backtest using a 10k account, trading 0.5 every time. The results are astonishing, check it out: 2020 --- 30 July 2024
2050 trades 1571 profitable (76,63%) 24 consecutive winning trades Low drawdown, (
EXPERT ADVISOR DESCRIPTION
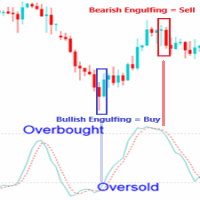
- Expert Advisor Engulfing in OBOS (Overbought Oversold) is an expert advisor consisting of a combined candle engulfing pattern and Stochastic Oscillator indicators. A Buy position occurs when engulfing are formed when the signal stochastic indicator is in the oversold area, A sell position occurs when engulfing are formed when the signal stochastic indicator is in the overbought area. - You can combine engulfing that form in certain timeframes with a signal stochas

The indicator helps the trader in identifying potential liquidity levels. The algorithm used in this indicator checks the behavior of the asset taking into account the price levels, momentum and volume analysis. Features:- Parameters for signal optimization and alerts. Usage:- The levels formed by the indicator can be helpful to traders in identifying potential entries, breakouts or reversals. it can assist traders of technical trading background or even pure price action trading.
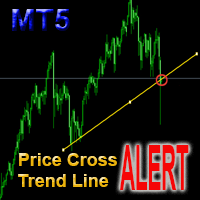
This is a support tool that will notify you when the price crosses a trend line, you can draw any trend line by manual, and you can change or drag it on chart in working time This tool will automatically update the new location of the trend line to alert you How to use: after added it on chart, you will draw a trend line and set name of the trend line same as in input of the tool (the parameter LineName ) There are 3 notification methods : Pop Up Alert, Send Email or Notification You can choose
This EA trails your stops based on percentage of current TP, for both manually and auto-opened trades. You can edit the percentage value in the inputs. Trailing stop is a more flexible variation of a normal exit order. T railing stop is the practice of moving the stop-loss level closer to the current price when the price moves in your favor. Trailing the stop-loss allows traders to limit their losses and safeguard their positive trades. It is a very popular practice. This EA will manage you

This indicator converted from Squeeze Momentum Indicator [LazyBear] version on TradingView [---- Original Notes ----]
This is a derivative of John Carter's "TTM Squeeze" volatility indicator, as discussed in his book "Mastering the Trade" (chapter 11). The Squeeze Momentum Indicator (or TTM Squeeze) is an indicator that measures volatility and momentum, based on price movement within a tight range for a period of time and then breaking out sharply to initiate large moves.
The most popular ver

MACD is probably one of the most popular technical indicators out there. When the market is trending, it actually does a pretty good job, but when the market starts consolidating and moving sideways, the MACD performs not so well. SX Impulse MACD for MT4 is available here . Impulse MACD is a modified version of MACD that works very well for trading Forex, stocks, and cryptocurrencies. It has its own unique feature which perfectly filters out the values in a moving average range and enables it

The Schaff Trend Cycle indicator is the product of combining Slow Stochastics and the moving average convergence/divergence (MACD). The MACD has a reputation as a trend indicator, but it's also notorious for lagging due to its slow responsive signal line. The improved signal line gives the STC its relevance as an early warning sign to detect currency trends. this indicator is converted from Trading View code of STC Indicator - A Better MACD [SHK]

Fully featured Pivots and Levels indicator Pivots: Floor (normal), Woody, Camarilla, Fibonacci Levels: ATR, Historical Volatility with standard deviations, Close Price Volatility with standard deviations
Features: - 4 +/- levels
- MTF, pivots/levels based on Daily, Weekly, 4hr or even 15min - Hour and minute time offset
- Texts with prices and pip distances to central pivot/level - Inputs for Camarilla/Fibonacci/ATR/Volatility levels
- Alerts, popup, push, email, sound, live or completed ca
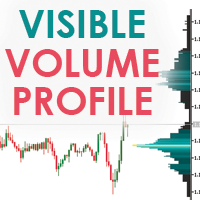
Visible Market Profile graphically represents the amount of trades made on each price level. This indicator in particular, unlike the daily market profile , is calculated on the visible area of the chart.
Visible Market Profile cannot be considered an indicator of operational signals, but it can be a good support for reading the market, in addition to what is already used by every trader in his work process. The Visible Market Profile is able to determine with a good approximation the pric
This EA will set breakeven or breakeven-plus for your trades, whether you have manually or automatically set stop loss or not. If your broker charges commissions per trade, you need to set breakeven plus, not just breakeven, in order to cover up those charges and properly let your trades run at zero risk. Inputs:
In the inputs section , set BEPoffsetPips to 0, to use it as a "breakeven" EA. Or set BEPoffsetPips to any amount of pips you want, to use it as a "breakeven-plus" EA. "OnPro
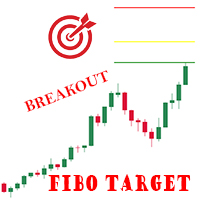
Indicator shows 3 Fibonacci expansion levels, based on the last pivot breakout. Pivots are calculated based on volatility (ATR), works on every Timeframe and Symbol. Lines are displayed only after the pivot breakout. A comment on the upper left side shows the minimum calculated value (in points) for pivots. Parameters: Variation: minimum variation for the pivot. ATR multiplication factor. (default 3) ATR Period: Period for ATR value calculations. (default 60)
Ex.: ATR on TimeFrame H1 = 100po

This indicator uses the metaquotes ZigZag indicator as base to plot fibonacci extension and fibonacci retracement based in the Elliot waves. A fibonacci retracement will be plotted on every wave draw by the ZigZag. A fibonacci extension will be plotted only after the 2nd wave.
Both fibonacci will be updated over the same wave tendency. Supporting until 9 consecutive elliot waves.
Parameters:
Depth: How much the algorithm will iterate to find the lowest and highest candles Deviation: Amoun

Любой финансовый инструмент, торгуемый на рынке, - это отношение определенного актива к какой-либо валюте. Форекс отличается от других рынков только тем, что в качестве актива используется другая валюта. В результате на Форексе мы всегда имеем дело с отношением одной валюты к другой, называем валютной парой.
Проект, начатый более года назад, помог разработать группу индикаторов под общим названием кластерные индикаторы. Их задача состоит в том, чтобы из валютных пар вычленить отдельные валюты.

Мультитаймфреймный индикатор Relative Strength Index отображающий информацию одновременно с разных периодов в одном подокне графика.
Параметры Period of averaging — период усреднения. Type of price — тип цены для расчета RSI. Timeframes for RSI— перечень периодов, через пробел или запятую или точку с запятой. Number of bars for each period — количество отображаемых баров для каждого периода. Sort periods — сортировать периоды если они указаны в перемешку. Current period first — отображать теку

Индикатор предоставляет замену реальным торговым объемам, построенную на основе тиковых объемов. Он рассчитывает по специальной формуле близкую к реальности оценку распределения торговых объемов, что может пригодиться для инструментов, для которых доступны только тиковые объемы. Обратите внимание, что абсолютные значения индикатора не соответствуют никаким данным о реальных объемах, но само распределение, включая общую форму и поведение, повторяет общую форму и поведение реальных объемов связанн

Стохастический осциллятор отображающий информацию одновременно с разных периодов в одном подокне графика.
Параметры %K Period — K-период (количество баров для расчетов). %D Period — D-период (период первичного сглаживания). Slowing — окончательное сглаживание. Method — тип сглаживания. Price field — способ расчета стохастика. Timeframes for Stochastic — перечень периодов, через пробел или запятую или точку с запятой. Number of bars for each period — количество отображаемых баров для каждого пе

This indicator is the mql version of the Twin Range Filter indicator. Description of TradingView version: An experiment to combine two range filters and plot the average of both to smooth out the signals.
This works significantly better than the typical ATR set-up, but there's still too much noise here to set and forget with bots. Use it as the basis of your own system with additional filtering on top. I welcome your suggestion for improving the indicator

Higher Timeframe Chart Overlay will display higher timeframe candles, including the number of candles high/low you specify.
You no longer need to switch timeframes to check the candles. Everything can be shown in one chart. MT4 Version : https://www.mql5.com/en/market/product/115680 Almost everything can be change as you want. You can change/set:
- Choose different colors for the body and top/bottom wicks.
- Panel's height and width.
- The width of the body and wicks
- Change backgrou

Скрипт в виде эксперта создан для возможности автоматической установки отложенных ордеров типа Stop Close Only , которых нет в МТ5 по умолчанию. Этот тип ордеров предусматривает вход в длинную позицию в случае закрытия цены выше заданного ценового уровня и открытие короткой позиции, если цена закроется ниже заданной трейдером цены. При этом не учитываются проколы уровней. Эксперт линиями указывает на графике уровни, преодоление, которых активирует позицию в ту или иную сторону. Если цена за
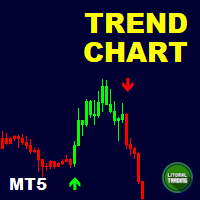
Are you the trend surfing type? Do you like to follow the big sharks? Nope? So you are the type that trades reversion? Awaiting the trend exhaustion and entering on trade?
So this indicator is for you ! With it is extremely easy to identify the trend and when it reverses because the chart is automatically colored according to a defined moving average. You can change it settings and make it your own (or hide it).
In addition it is possible to have indicative arrows on chart and also popup and
Automatic stops monitors your account and automatically sets the values you enter in the EA for stop loss, take profit and also trailing stop. As long as the EA is attached on a chart it will set stops and offer automatic trailing to any new trades for that currency pair so you wont have to manually enter them every time you open a trade. Features include: Ability to select which trades should be monitored via magic number. You can leave the value to 0 to only monitor manual trades or to any one

Introducing the 'No Nonsense Reversal Megaprofits' indicator for MetaTrader 5 (MT5), your ultimate tool for identifying trend reversals with precision and confidence. This powerful indicator is designed to cut through the noise of the markets and pinpoint crucial turning points with ease. Powered by advanced algorithms, 'No Nonsense Reversal Megaprofits' analyzes price action and key market dynamics to accurately detect when a trend is about to reverse. Whether you're a novice trader or a season

This is a utility that helps you close market orders and pending orders (optional), using keyboard shortcuts. For me, it's more convenient and faster than clicking a button on the chart. You can set: Keyboard Shortcut Hotkey: You can change and use most of the keys on the keyboard.
Key combination (Ctrl, Shift) also available in case you want to use
(Note that not all combinations work). Magic Number Symbol: All Symbol, or Current Chart Symbol, or Select Symbol List Close Pending or
This is very simple strategy based on martingale and reverse martingale strategy. When Ea keeps on winning it multiplies with winning multiplier ,when it has a loosing streak it multiplies with loosing multiplier. Whenever cycle goes from winning to loosing or vice versa the lot size will be reset to default one. This will keep the risk minimized as we are using it for both side. Also when we are in loosing streak we keep on changing the order type from its previous example. For detailed documen

EA scalp Hedge is trading on trend reverse if open on loss site it will hedge opposite to recover loss until win and close all positions to rebalance. There are 2 mode to hedge single and double both of this is the same just working on different market direction, Last hope you all MM your capital carefully. Robot features: Lot = Starting Lot sizes when start robot. Lot_Martingale = Lot multiply when hedging on loss site. HEDGE_TYPE = type to hedging single or double. Hedge_Distance = Distance t

Chandelier Exit для MT5 Индикатор Chandelier Exit предназначен для динамического определения уровней стоп-лоссов на основе волатильности рынка, измеряемой через Average True Range (ATR). Он помогает трейдерам фиксировать позиции при изменении тренда, основываясь на экстремумах цены и динамических стоп-лоссах для длинных и коротких позиций. Основные характеристики: Основы на ATR : Индикатор рассчитывает уровни стоп-лоссов для длинных и коротких позиций на основе скользящего среднего истинного диа

MetaCOT 2 - набор индикаторов и специализированных утилит для анализа отчетов американской комиссии по товарным рынкам CFTC (U.S. Commodity Futures Trading Commission). Благодаря отчетам, издаваемым комиссией, можно анализировать размер и направление позиций крупных участников рынка, что выводит точность долгосрочного прогнозирования цены на новый, более качественный уровень, недоступный большинству трейдеров. Данные индикаторы, относящиеся к фундаментальному анализу, также можно использовать ка
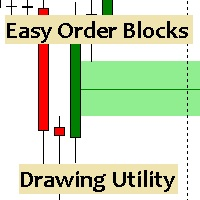
Esta utilidad dibuja Order Blocks y otros bloques fácilmente mediante el trazado rápido de lineas y rectángulos con 1 click y 1 tecla. Las teclas Hotkeys son programables y son 5: Order Blocks Fair Value Gaps (o Liquidity Void) Rejection Blocks Mitigation/Breaker Blocks Fast Object Delete (Borrado Rápido de objetos) Las 4 teclas de dibujo toman las coordenadas de la barra donde se clickeo y trazan 1 linea horizontal y 1 rectángulo delimitando la zona de OTE (Optimal Trade Entry). Automáticamente
А знаете ли вы, почему MetaTrader Market - лучшее место для продажи торговых стратегий и технических индикаторов? Разработчику у нас не нужно тратить время и силы на рекламу, защиту программ и расчеты с покупателями. Всё это уже сделано.
Вы упускаете торговые возможности:
- Бесплатные приложения для трейдинга
- 8 000+ сигналов для копирования
- Экономические новости для анализа финансовых рынков
Регистрация
Вход
Если у вас нет учетной записи, зарегистрируйтесь
Для авторизации и пользования сайтом MQL5.com необходимо разрешить использование файлов Сookie.
Пожалуйста, включите в вашем браузере данную настройку, иначе вы не сможете авторизоваться.