Смотри обучающее видео по маркету на YouTube
Как купить торгового робота или индикатор
Запусти робота на
виртуальном хостинге
виртуальном хостинге
Протестируй индикатор/робота перед покупкой
Хочешь зарабатывать в Маркете?
Как подать продукт, чтобы его покупали
Платные торговые роботы и индикаторы для MetaTrader 5 - 148

The Market Sessions Indicator for MT5 helps you predict market turnarounds by detecting major supply and demand areas. These pivot points tend to occur after a new session has started and the previous one is still open. It is also used to gauge how many points or pips the market moves on average during a session. This helps us to place better our take profits and stop losses. The indicator works on all forex pairs, gold, silver, commodities, stocks, indices and any other instrument that your

Описание
Money Zones - индикатор, определяющий зоны накопления/распределения на рынке. Зеленые зоны позволяют искать точки входа в покупку или точки выхода из продажи. Красные зоны, напротив, определяют возможность продажи или закрытия покупок. Индикатор имеет возможность определять денежные зоны для двух временных интервалов одновременно на одном графике.
Как использовать?
Используйте этот индикатор, чтобы определить рыночные зоны как зоны поддержки/сопротивления, чтобы определить наилучшие

Telegram Simple
- это приложение, которое позволяет вам отправлять свой технический анализ или операции прямо в ваш канал Telegram, быстро и просто, без осложнений. - Прокрутите символы на панели - Полностью настраиваемый список символов - Быстрая смена таймфрейма с панели - Отправлять комментарии и скриншоты
для более подробной информации: tradingxbots@gmail.com

RSI ALARM (для Metatrader 5)
Этот индикатор работает как обычный RSI со всеми его настройками (периодичность, цвета, уровни и т. Д.),
но, кроме того, сигналы тревоги могут быть установлены на верхнем и нижнем уровнях (Примеры 70 и 30), с возможностью регулировки этих уровней, перемещая синюю и красную линии, чтобы установить верхний и нижний уровни.
Вы также можете включать и выключать дополнительную функцию, которая создает стрелку на графике при достижении ожидаемого верхнего или нижнего з

As simple as title, this is a telegram notificator to be always updated about your open position. It send basically 3 message: When you reach a stop loss; When you reach a take profit; When you reach a margin call; If you want I'm available to do all customization for you, like send chart pictures, particular message or to interact with Metatrader with Telegram custom command.
How to configure: Go to Metatrader, "Windows->Options->Expert Advisor-> WebRequests for URL" and write "https://api.tel

GIVE A LOOK TO MY OTHER PRODUCTS !
100 % PER MONTH PROFIT---- MY NEW SIGNAL HERE -------> https://www.mql5.com/en/signals/2162238?source=Site+Signals+My# BROKEN TRENDLINE ALERT IS A SIMPLE TOOL INDICATOR. JUST DRAW IN YOUR CHART A DYNAMIC OR STATIC TRENDLINE,AND THE INDICATOR WILL SEND YOU ALERT WHENEVER THE PRICE CROSSES BELOW OR ABOVE YOUR DRAWN TRENDLINE. IT WORKS IN ANY TIMEFRAME AND ANY CHART YOU WANT.JUST GOT A VPS AND DON'T STRESS IN FRONT OF YOUR COMPUTER.
FOR ANY KIND OF QUESTION ,

Это инновационный индикатор измерения силы валют от INFINITY является незаменимым помощником для скальперов и трейдеров торгующих в долгую.
Система анализа Силы/слабости валют давно известна и применяется на рынке ведущими трейдерами мира. Любая арбитражная торговля не обходится без этого анализа.
Наш индикатор легко определяет силу базовых валют по отношению друг к другу. Он выводит линейные графики по всем или по текущей паре валют, позволяя проводить мгновенный анализ и поиск наиболее сильны

>>> Comment ajouter des indicateurs personnalisés ou des EA à MT5 <<< > Ouvrez MT5, > allez dans Fichier> Ouvrir le dossier de données, > puis sélectionnez MQL / 5> 'Experts' ou 'Indicateurs' > et collez votre fichier MQL4 / EX4 ou MQL5 / EX5 dans ce dossier.
Lorsque vous redémarrez la plate-forme, vous devriez maintenant voir votre EA / indicateur personnalisé dans la fenêtre du navigateur.
Vous pouvez le faire glisser et le déposer sur le (s) graphique (s) de votre choix.
>>> Pour rec

Control Panel iForex The script allows users to easily one click for adjust lot order, buy, sell and close positions if their profit/loss reaches or exceeds a value specified in USD. BUY - Click for order long position. LOT - standard 0.1 lot. You can adjustable in control panel. SELL - Click for order short position. CLOSE ALL - Click for close all position. CLOSE BUY - Click for close all only long position. CLOSE SELL - Click for close all only short position. TAKE PROFIT (USD) - stan
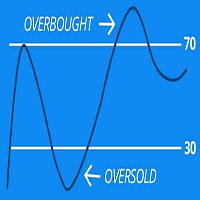
Scan all your favorite pairs with RSI, and get notified on your preferred time frames.
Settings are Customizable
Click to change time frame or open new pairs
Notification: Phone/Popup/Email The relative strength index (RSI) is a technical indicator used in the analysis of financial markets. It is intended to chart the current and historical strength or weakness of a pair/stock based on the closing prices of a recent trading period. The RSI is most typically used on a 14 period, measured on a
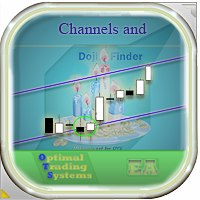
Этот советник находит каналы движения цен на графике, а также определяет свечи "Доджи" и "Поглощение". Советник торгует при появлении такой свечи на границе канала (может не только на отбой от границ, но и на пробой канала), и может отображать каналы и свечи, по которым торгует. Для показа примеров свечей и для некоторых настроек сделано меню слева на графике. Советник также имеет фильтрацию сигналов по стохастику и скользящей средней, в нём есть множество настроек для оптимизации нахождения

==== Live Results ==== Stock Trader Hedge - CFD Mode: here >> (Admiral Markets Live)
> Stock Trader Hedge v.1.6 Presets: Download >> > Stock Trader Hedge v.1.2 Backtests : Download >> Stock Trader Hedge is a fully automated trading advisor designed to work at US Stock Market . The system is based on the author’s trading strategy. Unlike Forex systems, Stock Trader Hedge opens only LONG positions by the global direction of trend on price on price falls (dips), analyzing data

Join Deriv link on profile>>>
BOOM AND CRASH EA PRO BOOM AND CRASH EA PRO is a 100% adaptive expert advisor based on price movement. It has a built-in unique Smart Recovery algorithm. Only one trade at a time. Every trade has Stop Loss and Take Profit from very beginning, and they do not change. This is for those, who are looking for stable growth over the long run. SETTINGS Lot size 0.2 Stop loss 5000 take profit 10000 Recommended pairs BOOM1000,CRASH1000 Recommended TimeFrame 15m Recommende

Leave a review for this product, and receive another "Free" product that you choose. You can see my other products here: https://www.mql5.com/en/users/zakri/seller
Trend Detective is an advanced trend detection indicator which shows accurate entry points in direction of trend. It uses smart technology in order to detect entry points, trend changing points, and TP points. It also shows hit rate for current chart using selected parameters. Hit rate for this indicator on different charts can be 8
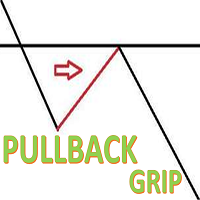
PULLBACK GRIP , is a trading system that uses price action levels support and resitence to determine market pullback and init the grip mode whit lot and risk control. if the trade is in the correct direction have a anti-martingala algoritm to take the best profit of the trend market. PULLBACK GRIP is a system that detects an entry point and initiates an operational algorithm whit multilot algorithm.
Detecting and operating the pullbacks on the wrong entries using a price action, is the most
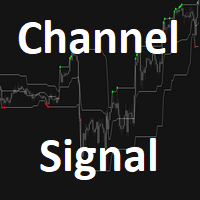
Индикатор Channel Forex разработан с учетом экстремальных ценовых значений за определенный период.
Индикатор состоит из трех четко окрашенных линий, которые напоминают полосы Боллинджера.
Основные торговые сигналы
Сигнал на покупку: открывайте длинную позицию, когда цена открывается и закрывается выше средней средней линии индикатора, и торгуется вдоль верхней границы канала.
Сигнал на продажу: открывайте короткую позицию, когда цена открывается и закрывается ниже средней средней синей лини

FRACTALS GRIP CONTROL , is a trading system that uses fractals an levels of price to determine market corrections and init the grip recovery mode whit lot and risk control. FRACTALS GRIP CONTROL is a system that detects an entry point and initiates an operational algorithm whit multilot algorithm.
This algorithm is different if the input is correct or wrong.
From the inputs you can control the initial lot of the algorithm, if the trade goes against you the lotage is maintained to the cont

EA Ordem Fácil helps you open pending buy and sell orders (buy or sell stop) using the SHIFT, CTRL keys and mouse left button click.
To create a buy stop order, press the SHIFT key (only once) and click on mouse left button on the chart above the price.
To create a sell stop order, press the CTRL key (only once) and click on mouse left button on the chart below the price.
While the order is not opened, when you moving the mouse cursor on the chart, on the left and above corner of the chart ap

Titan Boom Crash is meant to be traded on 6 Symbols of the Boom and Crash Stnthetic Indexes. There are 3 versions of both these symbols which are the 1 Spike per 300 ticks and 500 ticks and 1000 ticks. The Titan Boom Crash utilises mathematical equations to select trades. Use the strategy tester to select your preferred timeframe and settings, taking into account that a breakeven function and trailing stoploss have been incorporated into its code.
Signal Settings
the user can now select

DYJ GlobalForexTradeWarMAPools is based on indicator MA . It can be used for any currency pair and timeframe.
The Indicator is based on the following idea: crossing of two Moving Average lines (Fast and slow ) is used as a signal for opening and closing a position together. Go Long when Fast MA (MA1) crosses above Slow MA (MA2). Go Short when Fast MA (MA1) crosses below Slow MA (MA2). The EA uses dynamic allocation MA period. The MA1 and MA2 period is the Fibonacci sequence, such as InpMAArr
The moving average is the easiest indicator to recognize changes in the price of a currency.
It is excellent to set multiple indicators for each period or type and see the transition.
However, setting multiple moving averages is very troublesome, isn't it?
Moreover, displaying multiple currency pairs will increase the time and effort.
It is an indicator that saves you the trouble.
You can display multiple moving averages at once.
You can freely set up to 4 lines, line thickness, color a

Shadow Legends MT5 EA.-it's a fully automated expert Advisor designed to trade EURUSD. It is based on machine learning analysis and genetic algorithms. The Expert Advisor contains a self-adaptive market algorithm that uses price action patterns. The expert Advisor showed stable results for EURUSD in the period 2000-2021. No dangerous money management techniques, no Martingale, no netting, scalping or hedging. Suitable for any brokerage conditions.Test only on real accounts.Recommended broker

Feel the Power , is a trading system that uses fractals an levels of price to determine market corrections. Feel the Power , is a system that detects an entry point and initiates an operational algorithm whit multilot algorithm. This algorithm is different if the input is correct or wrong.
From the inputs you can control the initial lot of the algorithm, if the trade goes against you the lotage is maintained to the control power, but if it goes in your favor the lotage is increased to impr

Это полностью автоматизированная система, отслеживающая тренд и уровни. Возникли вопросы или предложения по улучшению ? - Свяжитесь со мной! О стратегии: Для каждого трейдера: эта торговая система подходит как для опытных трейдеров, так и для новичков.
100% тест качества: стресс-тестирование со 100% тиковыми данными с переменным спредом
Рекомендации:
Валюта: любая. По умолчанию - USDCHF
Таймфрейм: любой.
Минимальный остаток на счете: 200 $.
Брокер: Любой.
Тип счета MT5: хеджирование. Параме

QuantXSTocks Trading Range Indicator for MT5:
INSTRUCTIONS TO USE OUR INDICATOR:- User needs to take trade on Arrow or after an Arrow CandleStick, You can achieve up-to 35-125 pips target by this Indicator. Best Timeframes for Stocks and Indices are M30 and H1: AMAZON M30 (50 pips) TESLA M30 (50 pips) APPLE M30 (50 pips) ADOBE M30 (50 pips) NASDAQ100 H1 (125 pips) The above are the approximate amount of pips you can achieve by this Indicator, Green arrow appears to be buy arrow while the Red ar

Механизм ровно такой же как у бесплатной версии https://www.mql5.com/ru/market/product/50090 за исключением огромного количества дополнительных настроек поддержки, которые помогут вам обуздать мартингейл систему. В отличии от бесплатной версии данный советник не даст вам разом слить весь депозит, да и вообще при правильных настройках его и не получится слить). Начинать можно даже со 100$. Есть особенность тестирования Jast Martingale, в MT5 на данных предоставляемых терминалом, тиковые данные
Советник GRV Grid - это обычный сеточник торгующий в обе стороны. Особенностью данного сеточника является то что последующие ордера в сетке открываются не только по достижению выставленного шага но и на основе сигнала, что позволяет не накапливать множество ордеров которые могут очень быстро слить весь депозит. Принимает решение советник на основе сигналов от индикатора MA и трендового фильтра. Советник торгует практически нон-стоп, т.е. практически всегда есть открытые ордера, поэтому для стаби

Данный советник основан на стратегии «Серфинг». НЕ ИСПОЛЬЗУЕТ МАРТИНГЕИЛ. Советник ловит моменты пересечения предыдущей свечи с индикатором moving average и отсеивает ложные пробои при помощи индикатора RSI+MA, при этом анализируя направления тренда. Советник торгует отложенными ордерами, что так же позволяет избежать ложных движений, если же отложенный ордер не был задействован и график развернулся, то советник удаляет отложенный ордер. Также, по стратегии, в советнике используется Trailing Sto

Индикатор определяет состояние рынка: тренд или флэт.
Состояние рынка определяется с учётом волатильности.
Жёлтым цветом отображается флэт(торговый коридор).
Зелёным цветом отображается тренд вверх.
Красным цветом отображается тренд вниз.
Высота метки соответствует волатильности на рынке.
Индикатор не перерисовывается .
Настройки History_Size - размер рассчитываемой истории.
Period_Candles - количество свечей для расчёта индикатора. Send_Sound - звуковое оповещение. Send_Mail - отпр

QuantXMarketScanner is a multi assets indicator for MT5
- Mathematical model based on 7 custom moving averages indicators - Adaptable on Currencies, Stocks and Crypto - Automatic setup, self optimized
About QuantXsystem Products: – Simple installation & integration into MT5 – Unlimited License after purchase (for one user) – Automatic pattern recognition to identify the best timing and price levels. – Trading indicators are displayed directly and automaticall

The Last Fractals , is a trading system that uses fractals to determine market corrections. The Last Fractals, is a system that detects an entry point and initiates an operational algorithm. This algorithm is different if the input is correct or wrong.
From the inputs you can control the initial loting of the algorithm, if the trade goes against you the lotage is maintained, but if it goes in your favor the lotage is increased to improve your profit.
You can download the demo and test it y

Tenha a boleta do ProfitChart no seu Metatrader! ........................
Agora é possível ter a boleta do profit no seu Metatrader. Envie ordens de compra e venda, acompanhe o mercado e simule estratégias em momentos de mobilidade, diretamente do seu Metatrader5. Gestão de riscos e otimização de lucros são dois princípios básicos de qualquer operação bem-sucedida. Nesse sentido, utilize as ferramentas de STOPMOVEL, TRAILING STOP, STOPGAIN E ORDENS PARCIAIS DE SAÍDA.
Funcionalidades do

This is a momentum Indicator adapted to work on lower timeframes for Boom and Crash Indeecies. However the indicator can work with other Synthetic Indecies.
The indicator trend colour is set default to Aqua, then sell signal, the colour changes to red and blue signifies buy signals. .
For non Boom nor Crash Indecies use a smaller period and slightly increase the deviation.

Description :
VWAP (Volume-Weighted Average Price) is the ratio of the value traded to total volume traded over a particular time horizon. It is a measure of the average price at which pair is traded over the trading horizon. Read More.
All Symbols and All Timeframes are supported.
Indicator Inputs :
VWAP Mode : Mode of VWAP Calculation. Options can be selected : Single,Session,Daily,Weekly,Monthly
Volumes : Real Volumes,Tick Volumes
Price Type : Used price for calculating. O

While M5 trend is reverse, it opens the first position according to H1 trend. It targets to get "take profit points" determined by the user. In case of reversal, it enlarges the position under certain conditions and aims to close at the break-even point.
Only for Meta Trader 5 Netting (Generally default) Accounts. The recommended currency is "EURCAD" and the recommended minimum balance is 500.
Screenshot Settings are: Take Profit Point: 300 0.01 Lot Size for Each Free Margin: 500 Maximum O

Всем привет,
Я разработчик .NET (C #), cTrader (C #), Ninja Trader 8 (C #), MetaTrader4 (MQL4) и MetaTrader5 (MQL5) с 5-летним опытом программирования. Я разработал советник для платформы MetaTrader 5, который в тестере стратегий стабильно приносит деньги. У меня есть отчеты тестера стратегий по EURUSD H4 с 2003.06.01 по 2020.03.31 с качеством исторических данных 99% от Dukascopy Bank. К сожалению, я могу прикрепить максимум 12 скриншотов, поэтому я приложу отчеты тестера стратегий за 12 лет.
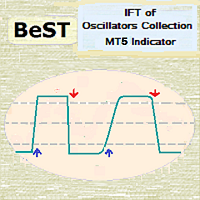
BeST_IFT of Oscillators Collection is a Composite MT4/5 Indicator that is based on the IFT ( Inverse Fisher Transformation ) applied to RSI , CCI , Stochastic and DeMarker Oscillators in order to find the best Entry and Exit points while using these Oscillators in our trading. The IFT was first used by John Ehlers to help clearly define the trigger points while using for this any common Oscillator ( TASC – May 2004 ). All Buy and Sell Signals are derived by the Indicator’s crossings of the Bu
Description:
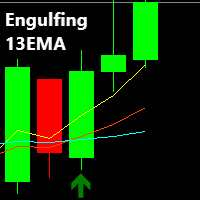
The Engulfing 13EMA is a Multi Timeframe Indicator that scans Multiple Symbols which will help you to identify potential trade set ups. As well as Forex, it can scan Crypto, Exotics, Metals, Indices, Energies or what ever else you have in your Market Watch list. You also have the option to enable/disable the time frames you want to scan. (M1,M5,M15,M30,H1,H4,D1,W1,MN1)
An alert is presented when the 13EMA passes through certain Engulfing candles, based on certain parameters with

Lost in the market is a system that detects an entry point and initiates an operational algorithm.
This algorithm is different if the input is correct or wrong.
You can operate with low capital and margin.
You can download the demo and test it yourself. Very stable growth curve as result of smart averaging techniques.
"Safety first" approach in development. Stress-tests on historical data for multiple pairs. Fully automatic. Broker type: Low spread, fast execution, low commission fast an
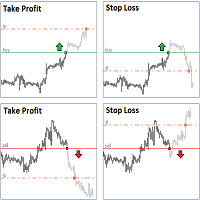
StopLoss and TakeProfit Utility MT5 for automatic setting of stop loss and take profit levels. Created by a professional trader for traders. The utility works with any market orders opened by a trader manually or using advisors. Can filter trades by magic number. The utility can work with any number of orders simultaneously.
WHAT THE UTILITY CAN DO: Set virtual stop loss and take profit from 1 pip Real stop loss and take profit W ork with each order separately ( stop loss and take prof
Risk Control Utility MT5 designed for manual trading. It helps to calculate and control your risks, transfer transactions to breakeven and accompany positions with trailing stop. Easy to set up and use. It can be used for calculating a trading lot, calculating stop loss and take profit levels. Works with currency pairs, CFDs, stocks, indices, futures, cryptocurrencies Displays volume, potential loss and profit before placing an order Ability to set the expiration time of a pending order Tr
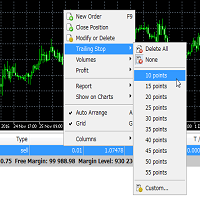
Trailing Stop Utility MT5 for automatic closing of deals by trailing stop levels. Allows you to take the maximum from the profit. Created by a professional trader for traders. Utility works with any market orders opened manually by a trader or using advisors. Can filter trades by magic number. The utility can work with any number of orders simultaneously.
WHAT THE UTILITY CAN DO: Set virtual trailing stop levels from 1 pip Set real trailing stop levels W ork with each order separat
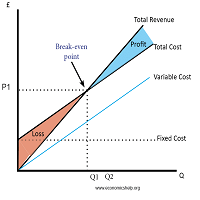
Breakeven Utility MT5 automatically setting breakeven levels, transfers trades to breakeven when passing a given distance . Allows you to minimize risks. Created by a professional trader for traders. Utility works with any market orders opened manually by a trader or using advisors. Can filter trades by magic number. The utility can work with any number of orders simultaneously.
WHAT THE UTILITY CAN DO: Install virtulnoe levels bezubytka from 1 pip I nstall real levels of

Market Zones MT5 Este indicador proporciona una lectura fácil del mercado basado en niveles estadísticos de Gauss, al igual que la metodología Market Profile. Utilizando una formula exclusiva el indicador estima dinámicamente las zonas que mejor representan dónde los movimientos del mercado permanecerán la mayor parte del tiempo (aprox. 70% del tiempo). Esto nos permite mirar el mercado de una forma más simple evitando caer en movimientos no relevantes. El precio se mueve despacio dentro de la
Launch price $ 299 - 8 of 10 copies left at this price
Next 10 copies $34 9
Final price $999 This EA has 39 strategies taken on my real portfolio. All these strategies passed at least 6 months of out of samples in real. The stragegies are not martingale or grid systems and are made manually (no uses of machine learning or genethic algorithms). The basic idea on my develops is thinking the forex market as a unique market, so all strategies are applied to all changes and crosses,

'Quick Close Panel' is an easy to use interface for managing orders. It has a button for closing all winning trades on the current chart, a button for closing all losing trades and another button for closing all running trades (Losing and Winning) on the current chart. It is very responsive and quick to execute operations due to the effective time complexity of the algorithm used in the program. Vist this link to download demo: https://www.mql5.com/en/market/product/62901?source=Site+Mark

Советник предназначен для парной торговли 2-мя выбранными инструментами с автоматическим расчетом коэффициента корреляции и определения одного из 8-ми возможных входов по 4 для положительной и отрицательной корреляции. Используемые входы задаются в настройках: 1 и 3 для торговли на понижение дельты между инструментами, 2 и 4 - для торговли на рост дельты (более опасный вариант торговли). Есть кнопки управления торговлей, информационная и статистическая панели. Большой выбор вариантов управления

Smoothing Oscillator is an ea based on the Smoothing oscillator indicator. https://www.mql5.com/es/market/product/59188 This ea uses the indicator's trend exhaustion signal to initiate a countertrend strategy. The system has a costly lotage, although it can have more than one operation open at a time It does not require large capital or margin requirements to be operated.
You can download the demo and test it yourself. Very stable growth curve as result of smart averaging techniques.
"Safet

Control Trading Support And Resistance
Es un indicador independiente del TimeFrame que permite proyectar niveles más relevantes del mercado en función del plazo de tiempo de la operativa. Los colores del indicador están escogidos para diferenciar entre los diferentes tipos de niveles y destacar a los más relevantes. Este indicador permite visualizar en un mismo gráfico los posibles objetivos relevantes que los diferentes traders pueden emplear siguiendo diferentes tipos de operativas en funció

We Can Do IT MT5 is a Secure Automated Software for Generation of Daily Profits for Forex Market. The architecture is a Fully Automatic Autonomous Robot Expert capable of independently analyzing the market and making trading decisions.
The Trading system is Multi-currency and is able to trade on H1 charts: EURUSD, GBPUSD, USDJPY, SPX500, DAX30, GOLD NOT Martingale! NOT GRID, Averaging and other dangerous strategies are NOT used! This is a full compliance with the FIFO method ! The trading s

Gold Hedge EA MT5 is an Expert Advisor designed specifically for trading Gold and Forex (EURUSD, GBPUSD, GBPJPY). The EA have DD Reduction Algoritm - drawdown reduction algorithm it when last order with profit will be close with first order series with loss. SETTINGS Open new series - on / off beginning of a new series of orders. Start lots - start lot. Trade Buy - allow the adviser to buy. Trade Sell - allow the adviser to sell. Use hedge - allow the adviser to trade both direction buy and sell

The DYJ GlobalForexTradeWarLaguerreMT5 is based on Laguerre indicator. It can be used for any currency pair and timeframe. It also uses MA indicator filtering false signals.
open long order when FastMA crosses above the SlowMA and Laguerre's oversold. open short order when FastMA crosses below the SlowMA and Laguerre's overbought.
Most trading strategies put their emphasis on finding out when to enter the market. Whether it’s technical or fundamental, everyone is looking for an e

Smoothing Oscillator , is a powerful indicator that vibrates along with the market, resulting in a very useful tool to improve and decide your trading. This indicator is a smoothed version of the Super Oscillator MT5 that you can download at this link https://www.mql5.com/es/market/product/59071 The idea of this indicator is to smooth and limit the aggressiveness of the previous indicator, it has less power in terms of pullback points but has more power to detect trends and consolidations Yo

Индикатор строит гибкие уровни поддержки и сопротивления (точками). Для построения используется особая фаза движения. Уровни формируются динамически, то есть, каждая новая свеча может продолжить уровень или завершить.
Уровень может оказывать сопротивление или поддержку цене даже там, где его уже нет. Также уровни поддержки и сопротивление могут меняться ролями.
На значимость уровней влияют: количество времени формирования уровня и количество касаний.
Важность уровней заключается в том, что п

Object replicator is an indicator that allows you to replicate an object in one or as many charts as you like. This indicator is the solution to replicate part of your analysis in exactly the same position and price of a trend line, Fibonacci, vertical line, horizontal line, etc. Download the MT4 version here
Install the indicator on the source chart and follow the steps below: To activate the indicator, simply press the (Activate) button. Once the (Activate) button is pressed, a (Receive o

O que é “QUANT TRADE FREEDOM” ? EA QUANT TRADE FREEDOM é um software de negociação totalmente automatizado, especialmente projetado para negociação lucrativa com a plataforma de negociação METATRADE 5 (MT5). Pode negociar Forex, Commodities, Índices, Crypto, Energies. Como funciona o robô EA QUANT CORRELATION FOREX ? EA QUANT TRADE FREEDOM é um software 100% automatizado que define a melhor tendência para entrar em ordens de negociação no lugar de um trader humano. O QUANT TRADE FREEDOM entra e

Индикатор Long & Short - Версия Pro: Разблокируйте Неограниченный Потенциал Вашего Рыночного Анализа! Без Ограничений для Любого Актива
Версия Pro индикатора Long & Short предоставляет полную свободу использования на любом финансовом активе. Больше никаких ограничений – применяйте один и тот же индикатор ко всем вашим любимым активам! Без Ограничений
Пользуйтесь всеми функциями индикатора без каких-либо ограничений. Версия Pro предлагает полный и неограниченный опыт, позволяя вам ма
Super Oscillator is an ea based on the super oscillator indicator. https://www.mql5.com/es/market/product/59071 This ea uses the indicator's trend exhaustion signal to initiate a countertrend strategy. The system has a costly lotage, although it can have more than one operation open at a time It does not require large capital or margin requirements to be operated.
You can download the demo and test it yourself. Very stable growth curve as result of smart averaging techniques.
"Safety first"

Индикатор строит графический анализ на основании теории Фибоначчи.
Фибо-Веер служит для анализа импульсов и коррекций движения.
Разворотные линии (2 линии у основания веера фибоначчи) служат для анализа направления движений.
Индикатор отображает 4 целевых линии в каждом направлении.
Индикатор учитывает волатильность на рынке.
Если цена выше разворотных линий, имеет смысл рассматривать покупки, если ниже, то продажи.
Открывать позиции можно после пробоя, отбоя или тестирования с обр

Photocopy MT5 is an Copier of transactions through Telegram channel. Will help you instantly publish your trade in Telegram channel or copy trades from Telegram channel. The utility can work in two directions by receiving signals in MT5 and transmitting signals to Telegram . No more missed deals No more panic Capital Management Ease of use You can use it for: Copying your own deals through Telegram channel (via the Internet); Copying trades from MT5 to MT4 and vice versa. Propagation of signa
Super Oscillator , is a powerful indicator that vibrates along with the market, resulting in a very useful tool to improve and decide your trading.
You can download the demo and test it yourself.
In a versatile indicator that in a single graph shows us information about four different aspects of the market
1) 4 operational zones. The indicator divides the screen into 4 zones that allows us to properly assess the moment of the market. a) Pullback Buy Trend. If the indicator is above

The Universal Dashboard is a tool for multidimension technical analysis of the market. It allows you to collect a customizable set of trading signals and important performance indicators, and display them in a single table. Multiple symbols, timeframes, and conditions can be monitored and alerted at once. The conditions are specified as expressions which support all built-in indicators, custom indicators, math functions, arithmetic operators and more. The dashboard is implemented as a non-tradi
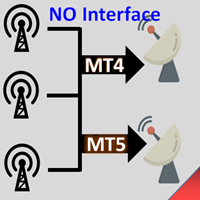
Interfaceless documentary EA. It has been operating stably and efficiently for more than 5 years, and has accumulated many customers. Copier Advanced Version (On sale) Copier-MT4-FULL(click to download) Copier-MT5-FULL(click to download) MT4->DEMO Try(click to download) MT5->DEMO Try(click to download) Copier Interface Version Copier-MT4-FULL(click to download) Copier-MT5-FULL(click to download) MT4->DEMO Try(click to download) MT5->DEMO Try(click to download) Copier No Interface Version Copier

Multi Strat is an fully custimizable Expert Advisor. It opens a sell/buy trade when a 'trigger' signal is activated. Triggers are only activated if it meets the filter criteria. Once a trigger passes, a trade is opened with a maximum Take Profit (customizable) of a daily ATR percentage. That range is divided by the number of trades so the Take profit levels are divided among the trades (also customizable). The parameters should be self explanatory. In short, everything you would/could change is
T D Sequential indicator consist of two components. TD Setup is the first one and it is a prerequisite for the TD Countdown – the second component.
TD Setup TD Setup compares the current close with the corresponding close four bars earlier. There must be nine consecutive closes higher/lower than the close four bars earlier.
1- TD Buy Setup - Prerequisite is a bearish price flip, which indicates a switch from positive to negative momentum.
– After a

The indicator scans for TD Sequential signals in multiple timeframes for the all markets filtered and shows the results on Dashboard. Key Features Dashboard can be used for all markets It can scan for signals on MN1, W1, D1, H4, H1, M30, M15 ,M5, M1 timeframes Parameters UseMarketWatch: Set true to copy all symbols available in market watch MarketWatchCount : Set the number of symbols that you want to copy from the market watch list. CustomSymbols: Enter the custom symbols that you want to be a

TD Combo is better when you have sharp directional moves, because it requires only thirteen price bars from start to finish compared to TD Sequential which needs at least 22 bars. The criteria for a Setup within TD Combo are the same with those required for a Setup within TD Sequential. The difference is that the count starts at bar 1 of the setup and not from bar 9 and TD Combo requires four conditions to be satisfied simultaneously.
Requirements for a TD Combo Buy Countdown
- Close lower or

The indicator scans for TD Combo signals in multiple timeframes for the all markets filtered and shows the results on Dashboard. Key Features Dashboard can be used for all markets It can scan for signals on MN1, W1, D1, H4, H1, M30, M15 ,M5, M1 timeframes Parameters UseMarketWatch: Set true to copy all symbols available in market watch MarketWatchCount : Set the number of symbols that you want to copy from the market watch list. CustomSymbols: Enter the custom symbols that you want to be availa
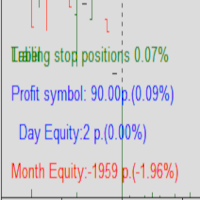
Protected profit это логическое продолжение проекта Equity monitor. Исправлены недочёты и внесены дополнительные моменты. В данном продукте разработан процентный Traling stop, как на отдельную позицию, так и на дневную прибыль в целом. Есть возможность закрыть позицию по заданному проценту убытка, а так же можно закрыть все позиции по проценту дневной прибыли. Настройки просты и понятны. Например: Риск на позицию 1% Позиция закроется если процент убытка превысит 1%. Traling 3% допустимое сниже

Crash 1000 Alert is an indicator that alerts trader when price is in the CRASH ZONE. The defaults settings work best only on Crash 1000 Index but are also fully customizable.
How to use: When price enters the crash zone, the indicator will send out messages of a potential crash. Traders can use this info to enter sell trades and capitalize on the spike down. Notifications and alerts are sent to your mobile device and platforms respectively. NB: please make sure notifications are enabled
MetaTrader Маркет - лучшее место для продажи торговых роботов и технических индикаторов.
Вам необходимо только написать востребованную программу для платформы MetaTrader, красиво оформить и добавить хорошее описание. Мы поможем вам опубликовать продукт в сервисе Маркет, где его могут купить миллионы пользователей MetaTrader. Так что занимайтесь только непосредственно своим делом - пишите программы для автотрейдинга.
Вы упускаете торговые возможности:
- Бесплатные приложения для трейдинга
- 8 000+ сигналов для копирования
- Экономические новости для анализа финансовых рынков
Регистрация
Вход
Если у вас нет учетной записи, зарегистрируйтесь
Для авторизации и пользования сайтом MQL5.com необходимо разрешить использование файлов Сookie.
Пожалуйста, включите в вашем браузере данную настройку, иначе вы не сможете авторизоваться.