Смотри обучающее видео по маркету на YouTube
Как купить торгового робота или индикатор
Запусти робота на
виртуальном хостинге
виртуальном хостинге
Протестируй индикатор/робота перед покупкой
Хочешь зарабатывать в Маркете?
Как подать продукт, чтобы его покупали
Новые торговые роботы и индикаторы для MetaTrader 5 - 82

This indicator helps to identify market sessions, It's High/Low, Open Range (OR), range of the sessions in pips and percentage of previous day (change%) under OHLC.
It is also editable for any brokerage market watch time. For traders who use session trading strategies such as Mark B. Fisher ACD it can be super effective, where they can edit OR from the settings to either line or box. We tried to make the settings easier to edit, for traders' use on different markets, charts and brokerage t

Hello, Every one
This is "Close All Button" future 2
A script to manage order and close all market positions and/or pending orders.
----------------------------------------------------------------------------------- This is Close All Market positions and/or pending orders button
You can close all or manage orders in 1 second by one click
------------------------------------------------------------------------------------
Download for Demo Account: Demo version: Close 1s manage v1.7 D

!!BLACK FRIDAY!! - PRICE MIGHT CHANGE DUE TO DEMANDS - THE BEST BREAKOUT EA TREND FOLLOWING !! Breakout EA Beast is a Full Algorithm Expert Advisor This EA operate based on Break Out of high or low of the last candles, you could change all the setting up to your preferences. The EA also have Time Management, you could time your orders based on time start and finish of let it run the whole time. There are Fix Lot and Auto Lot (Please adjust to your Risk Profile) There is Spread Input in order to

Trader Station:
A wave expert using bitwise analysis of an array of price data, confirmed performance by a real account since 2019; SIGNAL - https://www.mql5.com/en/signals/1667614
Back Testing the Expert: By default, the settings that are included in the SET 1;
Only for EURUSD M5 ;
Settings
LOT - set the required lot size or select AUTO RISK; RISK AUTO - quick risk selection or select manual risk entry; custom value RISK - entering a custom risk value; Expert ID - enter the Expe

Breakout EA based on advanced strategy , generates market entry signals when the price crosses a border of a certain price ranges. Data has been collected for over 15 years to produce model strategy. The strategy, filters out false signals and performs technical analysis and considers only the breakouts that show the best result.
It uses a system of filtering false signals. The EA uses advanced adaptive trailing stop. specifically optimized for EURUSD,GBPUSD,USDJPY,EURJPY,GBPJPY The
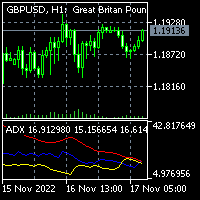
This is a two in one indicator implementation of Average Directional Index based on heiken ashi and normal candles. Normal candles and Heiken Ashi is selectable via input tab. The other inputs are ADX smoothing and DI length. This indicator lets you read the buffers: +di: buffer 6 -di: buffer 7 -adx: buffer 10 Note: This is a non-repaint indicator with light load processing. - You can message in private chat for further changes you need.
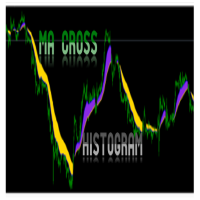
MA Histogram is MT5 Indicator for beginners which plot a histogram after Moving Average Crossover of 2 MAs. The Indicator does not have arrow or alert. It will simply plot on chart the potential Up and Down trend when trend is beginning or ending. It will show a Blue color for potential up trend and Gold color for potential down trend. Recommended Pairs: ALL Pairs including Indices for MT5 FOREX BROKERS Recommended Pairs On Deriv: BOOM 1000, Boom 500, Boom 300 and CRASH 1000, Crash 500, Cra
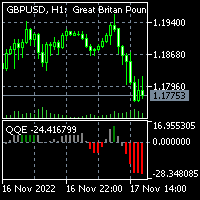
To download MT4 version please click here . - This is the exact conversion from TradingView: "QQE mod" By "Mihkel00". - It can be used to detect trend direction and trend strength. - Gray bars represent weak trends. You can set thresholds to achieve better accuracy in detecting trend strength. - There is buffer index 15 to use in EA for optimization purposes. - The indicator is loaded light and non-repaint. - You can message in private chat for further changes you need.
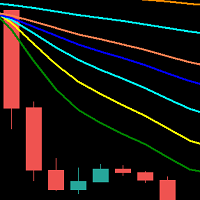
Multicolor moving average (8x). Define period, color, line width. Set period =0 to off moving average.
The moving average (MA) indicator is one of the most used technical indicators for forex traders. It's a formula used to calculate the averages of a market's movements over a longer time period (usually weeks or months rather than days) to identify trends , which is vital for a good forex trading strategy.

- This is an implementation of OCC ==> open close cross - This indicator applies twelve different averaging methods to open and close prices separately to signal the trend switching. - All MA methods are set as input as well as period and different offsets applied to linear regression and ALMA averaging. - Buffers 16 and 17 can be used in EAs to detect trend direction. - You can message in private chat for further changes you need.

The Scalping Project EA (Mainly for EURUSD and USDJPY Pairs M15 Timeframe) follows a scalping breakout strategy to the highs and lows.
Main Pairs: : EURUSD and USDJPY
Timeframe: : Only M15 Timeframe work
Since the strategy works with small average profits it is highly suggested to trade with a low spread and commission broker . The backtests shown in the screenshots were done with the default settings. There might be better or worse settings. Please download the free demo to do you

Expert Name : SWING BREAK _____Swing Break is a multicurrency pair EA that looks on the breakout on Daily Timeframe, this EA is using pending orders to see to it that it wont take false entry._____ Note !!!!!!DON'T USE Default Settings Below, USE THE RECOMMENDED SETFILES LINK BELOW.
Timeframe : D1
Variable
Value
Autolots
0.1
SL
5
TP
10
Expire
0
Trading Days
-----Filters-----
Monday
True
Monday Symbol
Tuesday
True
Tuesday Symbol
Wednesday
True
Wednesday Symbol
T

I automated trading strategy based on my HEIKEN+ Indicator which is included in this EA, and it worked out very well !
"HEIKEN PLUS is the only indicator you really need to be a successful trader , without in depth knowledge of the forex trading or any tools."
Very suitable tool for new traders or advanced traders too. Check my seller page to see info about the indicator.
HEIKEN+ is a combination of 2 indicators : normal Heiken Ashi and Heiken Ashi smoothed.
It sends signal when thes
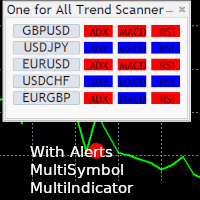
One for All Trend Scanner is a trend following multi-symbol indicator that can be used with any input: forex, stocks, commodities,... The panel shows three indicators and six symbols with the trend for every pair (symbol/indicator): up, down or no trend. The indicators are: Average Directional Movement Index (ADX) Moving Average Convergence Divergence (MACD) Relative Strength Index (RSI) You can choose which indicators will use for entry/exit and can adjust the parameters of each indicator sepa

Big Bang is a result of months and months of development. It perfectly presents the combination of my trading & coding skills. This is a fully automated, multicurrency Expert Advisor with a bunch of customizable inputs that can be optimized if you wish to do so. This algorithm has been tested on a number of currency pairs and the best performing are in the defaults: CHFJPY,GBPUSD,AUDUSD,EURGBP,USDCAD,NZDCAD,GBPNZD. Even though you are able to add other pairs I do not recommend you doing so. Prem
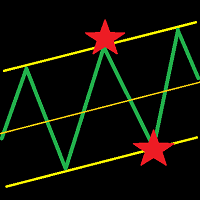
This indicator draws a trend line and a trend tunnel on the chart. You can choose several calculation methods, alerts, notifications, and other settings. It can also draw trendlines from another TimeFrame. You can also use this indicator for your ExpertAdvisor. The current values of the lines are stored in the memory buffer from where the EA can load them. You can trade the price bounce from the upper and lower lines . Settings TimeFrame – trend timeframe Description – show description of line
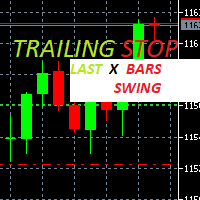
Trailing Stop loss last X candles swing high and low.
X is a value of candles you can set as an input parameter.
This Trailing stop loss moves the SL below the last X candles low(if BUY positions) or high(for SELL positions)
If we are in a trend and we open a position following the trend, the SL will be automatically placed at the low or high of the last X bars.
contact me if you need further assistence

Description. This product was created based on low investment EA,
EA "OPHEX" is an advanced system that exploits GOLD XAUUSD Only. I uses both Scalping and Hedging Strategy. Once the Scalping hits SL it converts the position into Hedging and recovers the loss.EA gives upto 10% return every month with low risk. We can increase initial lot size for more return while account grows.
Advantages. Get upto 10% Returns every month with very low risk; Much cheaper than similar alternatives; Oper

[Target currency pair / time] [EURUSD/15M] Recommended. Variable lot MT5EA for compound interest operation!
[About EA operation]
After purchasing an EA, it is recommended to operate with a real account after operating with a demo account for a certain period of time.
[About kikyo/logic overview] Kikyo is an EA that supports EURUSD/15M. Adopts a variable lot system that can easily realize compound interest operation according to the amount of funds (the default is a fixed lot. Please c
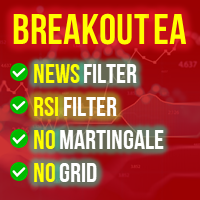
Только 2 копии по цене $199, затем цена увеличится до $299!
Упомяните выдающиеся функции заранее: Экспертный советник (EA) оснащен ФИЛЬТРОМ НОВОСТЕЙ и ФИЛЬТРОМ RSI. Низкий риск (некоторые валютные пары имеют Просадку менее 10%, даже 5%). Этот EA не использует ни мартингейл, ни сеточные функции. DUCHOAN99 хотел бы предоставить вам экспертного советника "Scalping EA Breakout Top and Bot MT5" (Скальпинг EA Breakout Highest and Lower для MT5). Пожалуйста, загрузите демо-версию, чтобы увидеть, пом

Описание Индекс относительной силы (RSI), разработанный Дж. Уэллсом Уайлдером, представляет собой осциллятор импульса, который измеряет скорость и изменение ценовых движений. RSI колеблется между 0 и 100. Традиционно RSI считается перекупленным, когда выше 70, и перепроданным, когда ниже 30. Сигналы можно генерировать, ища дивергенции и неудачные колебания. RSI также можно использовать для определения общего тренда.
Как работает этот советник RSI считается перекупленным, когда выше 70, но с

Синхронизированные кросс-индикаторы позволяют связать перекрестия из нескольких окон графиков. Это означает, что перемещение перекрестия на графике автоматически перемещает все другие перекрестия на другом временном интервале, поэтому пользователь может легко определить движение рынка и нацелиться на него в соответствии со временем.
Как использовать перекрестие:
1) Когда вы перетаскиваете все открытые диаграммы
2) любой из графиков нажмите
нажмите A для активного перекрестия и отобра
В настоящее время праздничная скидка составляет $399! Цены могут вырасти в будущем. Читайте описание ниже!
Представляем Ultimate Dynamic Levels - ЛУЧШИЙ индикатор входов для Ultimate Sniper Dashboard! Чрезвычайно низкий риск своевременных входов и высокий RR!!!
Найдите Ultimate Sniper Dashboard ЗДЕСЬ. Самая важная способность как для начинающих, так и для профессиональных трейдеров - точно определить, где и когда рынок, скорее всего, развернется, и как безопасно войти в рынок и выйти из не
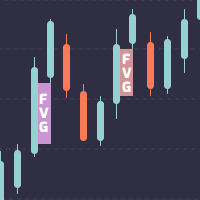
Индикатор разрыва справедливой стоимости для MetaTrader 4.
Разрыв справедливой стоимости — это модель ценового действия с тремя свечами, которой научил известный трейдер с умными деньгами, трейдер внутреннего круга, также известный как ICT. По сути, это гэп, остающийся открытым на графике, когда цена движется слишком быстро. Это область тела средней свечи, на которую не накладываются тики левой свечи и правой свечи рядом с ней. Когда цена оставляет гэп на графике, мы должны помнить о двух вещ
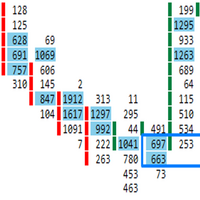
ОПТИМИЗИРУЙТЕ НА ГОД, ЧТОБЫ НАЙТИ НАИЛУЧШУЮ ЦЕННОСТЬ
Поток ордеров уникален тем, что торгует объемом. Он был построен на паре EUR/USD и оптимизирован с 11.11.2021 по 24.10.2022 на часовых графиках. Используются оптимизационные входы для управления капиталом. В этом советнике используется строгий мани-менеджмент, это не мартингейл быстрого обогащения или советник без SL. Трейдинг — это управление рисками, а не азартные игры. Запустите на часовом графике EUR / USD или, если вы хотите найти друг

Кнопка "Покрытие затрат" - полезный инструмент, который значительно облегчает жизнь и одновременно улучшает внешний вид графика, когда у вас открыто несколько сделок. Кнопка "Покрытие затрат" позволяет установить на точку безубыточности все ваши текущие прибыльные позиции всего одним нажатием. Таким образом, вы избавляетесь от риска потери, а кнопка упрощает работу, если у вас открыто несколько сделок. Даже при наличии всего одной сделки эта кнопка позволяет быстро действовать, что может помочь

* Исправлен и ускорен зигзаг. (Вы можете изменить диапазон) * Зигзаг обновляется с каждой новой свечой/баром. * Если вы хотите, активировав кнопку, только при нажатии кнопки он ищет шаблон. Если вы делаете это автоматически, он выполняет поиск при каждом обновлении диаграммы. * 17 часто используемых гармонических паттернов и специальный паттерн, в котором вы можете определить свои собственные пропорции. * Вы можете сделать график простым с отображением цены. Вы можете сделать представление треу
Версия Kali IndicOptimizer для Metatrader 5. Этот инструмент является не только советником, он используется для оптимизации ваших индикаторов, для разработки собственного советника, для анализа буферов ваших индикаторов без доступа к исходному коду. Я довольно долго искал, как мне оптимизировать свои индикаторы без необходимости каждый раз программировать или модифицировать эксперта. С помощью этого инструмента любой желающий может начать разработку стратегии или даже иметь собственного персона
FREE

The multi VWAP indicator will plot on your chart up to 7 different VWAPs: daily, weekly, quarterly and yearly plus up to 2 customizable intraday sessions. It will also plot the closing level of the previous period for each of the VWAPs displayed e.g. during the month of November you will see the VWAP closing level of October or during Q3 you will see the Q2's closing VWAP price. All levels can also display an optional label. Besides, in order to improve the indicator precision, it will automatic

Индикатор целей покупки и продажи Он состоит из трех строк: первый зеленый цвет обозначает цели покупки, второй красный цвет — цели продажи, а третий синий цвет — среднюю цену. Есть два способа войти - Метод 1: Точка входа, когда средняя цена пробита длинной свечой снизу и остается выше синей линии с зеленой свечой, считается покупкой. Когда средняя цена пробивает вершину красной свечой, это считается продажей. Второй способ: путем достижения целей, например, при до

Big News Promo 40%! From today we have added the possibility to take partials! Purchase or upgrade your autolot to use this new feature immediately. Introducing Autolot 2.0 Trade Management : The Revolutionary Trading Utility is Now Even MORE POWERFUL and EFFICIENT! We're proud to announce the launch of Autolot 2.0, the upgrade that takes your trading to a whole new level! We've listened to your feedback and improved the utility to make it even more versatile and user-friendly. Here are the key

Royal Radiante — это автоматизированный робот для скальпинга, который использует очень продвинутую логику, фирменный индикатор и множество технических анализов.
Протестировано и зарекомендовало себя на реальных счетах с хорошим реалистичным соотношением риска и вознаграждения.
Логика в этой стратегии является ядром ее эффективности. Даже при плохой оптимизации эта стратегия все равно будет очень прибыльной!
В этой стратегии не используются какие-либо высокие и рискованные методы, такие

This EA uses a combination of a Martigale strategy along with bollinger bands, which allow it to improve the effectivity. It run in low timeframes, which generates a lot of entries.
This is the V1.0 of the strategy. By now, it only sells. The idea is to improve not only the net profit but also the max DD and profit factor by introducing improvements like allowing buy as well or making the take profit dynamic.

К сожалению, у меня был опыт, когда при обновлении терминала MT5 или ПК, сервере или терминале MT5 происходит сбой или перезагрузка.
многие глобальные переменные сбрасываются в состояние, в котором терминал был в последний раз закрыт «нормально».
Поэтому я разработал эту утилиту для автоматического сохранения глобальных переменных из терминала,
и если что-то случится, у вас есть возможность сбросить все глобальные переменные до последнего сохраненного значения всего за несколько кликов.
FREE

--->12 DAYS OF XMAS GIFT PRICE $180 <--- WHEN DEMO TESTING USE THE SET FILE FOR USD/JPY & CAD/JPY SET FILES ARE ARE LOCATED IN THE COMMENT SECTION
STRATEGY SUMMARY & ADVANTAGES: - It's a full-automatic mid-term trading EA, with a Martingale option, no Grid. - Set Files will be given for optimal performance. - 2 Money Management Strategy (PE “Partial Exit” Very High Win Percentage & FE “Full Exit” Swing Trade until either TP is hit or Kijun Sen is crossed) - Prop Trading Compatible . - With
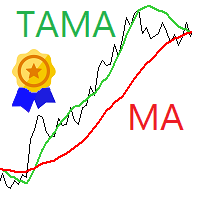
Short description : TAMA is, at its core, a novel method for correcting moving averages (MAs) during trends. | This usually also results in better smoothing and a significantly lower time delay (lag) of the MAs. | The indicator can additionally be used for price forecasts and band formation, also combined. | TAMA received an award from VTAD in 2022. |
Honored with the VTAD Award 2022 (VTAD = Association of Technical Analysts Germany, German branch of IFTA).
Core Features :
Classic MAs

Introducing the "Range Breaker". Range Breaker is a daily breakout EA that allows you to define a custom daily time range. Once the designated time range elapses, the "Range Breaker" place two STOP/LIMIT orders at the upper and lower limits of the range. This approach allows to automate daily ORB strategies. Once the day range is over, you can decide whether to keep the orders or to close/delete them.
It also counts with several filters such as - News - Inside Bar range - Trend - Narrow rang

AMPV Reversals — идеальный индикатор как для начинающих, так и для опытных трейдеров. Благодаря простоте и удобству каждый пользователь может попробовать его и выбрать тот паттерн, который ищет.
Индикатор анализирует структуру рынка и определяет модели свечевых паттернов, чтобы помочь трейдерам найти лучшие точки для входа в сделку. Рекомендую использовать в паре с индикаторами тренда для достижения наилучших результатов.
Преимущества:
Работает на всех парах и таймфреймах
FREE

The XR Gartley Pattern MT5 is an indicator which displays and alerts Gartley pattern detected on the candlestick chart. It also displays potential trade with calculated Take Profit and Stop Loss. After purchasing XR Gartley Pattern Indicator, you can immediately download this indicator from the MT4-MT5 Market and start using it because all features are set to default, is not necessary to change any parameter. In addition, we have created a private group for customers who have purchased one of
FREE

HTF CAD JPY is a fully automated Expert Advisor designed for CAD JPY trading. It is based on cluster analysis of machine learning and genetic algorithms. The Expert Advisor contains a self-adaptive market algorithm that uses price action patterns and standard trading indicators. The entry and exit logic works only when a bar closes. It filters market noise, greatly speeds up optimization, avoids stop-loss hunting and ensures correct operation at any broker with a reasonable spread. The Expert

- No Martingale
- No Grid - No high Risk Strategy.
- Target big moves - Swing - Low Risk
This EA is good for busy individuals who doesn't have time to monitor the screen at all times. Just place it on 4H Timeframe and let it do all underground work. This excellent expert advisor is not a scalper. It’s made to target greater moves and a long term big wins while minimizing losses. Long Journey EA is a sophisticated mathematical algorithm that analyzes market data, it's based

Сигнал "Чудесный осциллятор" Билла Вильямса из книги "Торговый хаос 2" на барах. Как правило используется для добавления позиции после входа по сигналу "Отклоняющийся бар" ----------------------------------------------------------------------------------------------------------- Пожалуйста убедитесь, что вы правильно понимаете систему Билла Вильямса прежде чем рисковать настоящими деньгами используя этот индикатор. Идеальный сетап для входа: 1) Дивиргенция с переходом через нулевую линию 2) Откл
FREE

BatchLoader for Mobile Traders: The idea of BatchLoader just as the name implies is to enable traders open a single position through their mobile phone and have it duplicated based on the max position such trader set in the "input settings", we have day traders and scalpers who find it difficult to open several position when trying to scalp, with this BatchLoader, you won't have to worry about poor entry execution.. How to Use it; *install the expert on your desired chart you usually trade on(
FREE

The indicator returning pivot point based trendlines with highlighted breakouts . Trendline caculated by pivot point and other clue are ATR, Stdev. The indicator also includes integrated alerts for trendlines breakouts and foward message to Telegram channel or group if you want. Settings · Lookback bar: Default 200 is number of bar caculate when init indicator. · Length: Pivot points period · Slope Calculation Method: Determines how this lope is calculated. We supp

Robotizz Indicator is a powerful trading indicator using price action and moving averages. Robotizz indicares with arrows on long trades ir short trades, showing some TP and SL points too. It works with any symbol, even on forex markets or B3 Brazilian markets. You can configure moving averages periods, besides simple or exponential moving averages. Also it is possible to configure arrow position. Try Robotizz for one month and take a boost on your manual trades.
Itrade manager expert advisor (EA) is a type of software that can be programmed to perform a variety of tasks related to managing trades in the financial markets. Some of the ways in which the Itrade manager EA can help you trade better include: Itrade manager EA can automatically modify, and close trades based on predefined rules and conditions, freeing you up to focus on other aspects of your trading strategy. Managing risk: Itrade manager EA can help you manage risk by placing stop-loss and t

The Hourly Scalper EA is Trading On Selected Hours and Selected Pairs. This is a simple EA which looks on the Hourly chart and trades even on the news depends on what you set is true on the parameters. It will Automatically put a Pending Orders BuyStop and SellStop based on the Gridsize you put on the Value Parameters. Parameters : Variable
Value
Autolots
1000
SL
50
TP
100
Gridsize
50
Expire
4
Max_Order
1
Hour Settings Server Time
=====Parameters=====
10-10.1 Hour
true

Relativity Power EA is based on RSI Indicator,Pivot points and lots of indicator has been used to create this Expert, Uses Hedging when it gets a signal.
Variable
Value Autolots
0.0001
RSI
14
Buy Cross Above
50
Sell Cross Below
50
ATR
14
ATR SL
5
ATR TP
10
Candle ID
1
Beta Set False
False
Alpha Set True
True
Timeframe : M15
Recommende Pairs : CFD's Cash Indice s : SWI20Cash,GER40Cash,SPAIN35Cash,FRA40Cash,EU50Cash,AUS200Cash,US500Cash
Forex : EURGBP,USDCHF,GBPUSD
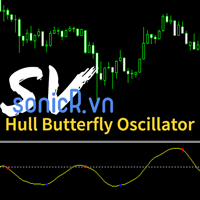
The Hull Butterfly Oscillator (HBO) is an oscillator constructed from the difference between a regular Hull Moving Average ( HMA ) and another with coefficients flipped horizontally . Levels are obtained from cumulative means of the absolute value of the oscillator. These are used to return dots indicating potential reversal points . This indicator draw line in separate window, plus blue dot (for buy signal) when hull oscillator is peak and red when sell signal. It also includes integrate

This is the Chandelier Exit trend indicator applied to heiken ashi candles based on "G TREND GUNBOT" by "LUIS_GANDATA_G_TREND" on tradingview. Heiken ashi candles filter out many of the chops and therefore as an input to Chandelier Exit you achieve well filtered Buy and Sell signals. Also you can choose to apply the trend indicator to normal candles via input tab. (two in one indicator) This is a non-repaint and light processing load indicator. You can message in private chat for further change
FREE

A pin bar pattern consists of one price bar, typically a candlestick price bar, which represents a sharp reversal and rejection of price. The pin bar reversal as it is sometimes called, is defined by a long tail, the tail is also referred to as a “shadow” or “wick”. The area between the open and close of the pin bar is called its “real body”, and pin bars generally have small real bodies in comparison to their long tails.
The tail of the pin bar shows the area of price that was rejected, and
FREE

The Trima EA's strategy is based on the position of various moving averages. The Stop Loss is calculated automatically from ATR and SMA and the Take Profit using the rrr value. Trima EA was developed for the 1 minute timeframe but can be used on any timeframe. For the best result test the EA on the forex pair EURUSD. The last screenshot contains the corresponding settings for many forex pairs on the 1 minute chart, so the Trima EA can also be used without intensive testing. For more symbols or o

TransitHazard is a trading indicator system's that use one of the best trading strategy. The indicator system have input options so that you can adjust or set the strategy to work the way you would like by allowing you to set the period and other adjusting set inputs and the indicator system has color settings to set your own preferred colors. Works on all the time frames and on all the pairs. Green colored candles give a buying signal and an alert after one bar will be given so that you don't m

One Click Close MT5 is an EA which allows you close orders quickly. EA display on chart two buttons. The first button "Close All Positions" is using to close all opened orders. The second button "Close Profit Positions" is using to close only profitable orders. EA is closing orders for all available symbols, not only for chart symbol. In EA params you can set distance from upper chart frame (Y Offset) and from left chart frame (X Offset). For installation EA it is only need to copy One Click Clo
FREE

To download MT4 version please click here . This is the exact conversion from TradingView: "B-Xtrender" By "QuantTherapy". - It is an oscillator based on RSI and multiple layers of moving averages. - It is a two in one indicator to calculate overbought and oversold zones for different RSI settings. - This indicator lets you read the buffers for all data on the window. - This is a non-repaint and light processing load indicator. - You can message in private chat for further changes you need.
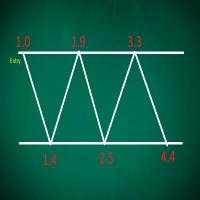
This EA performs with a Hedging strategy by which Buy and Sell signals are from the MACD indicator.... The lot sizes in the input are Custome for you to adjust as you pleased, so you are able to improve your hedging style. Inputs. Close Money- this option is basically the take profit in ($), for example if you set the close money at $20 the EA will automatically close all trades when your overall profit is $20. Nearby Hedge Pips- this basically determine the distance of pips between yo
FREE

Assistant for all those who forget to set StopLoss, TakeProfit and Trailing Stop in deal parameters, or trade on a very fast market and fail to place them in time. This tool automatically tracks trades without StopLoss, TakeProfit, Trailing Stop and checks what level should be set in accordance with the settings. The tool works both with market and pending orders. The type of orders to work with can be set in the parameters. It can track either trades for the instrument it runs on, or all

To download MT4 version please click here . Metatrader users are limited to few moving average types. Therefor I decided to create a package consisting of all MAs I knew. This package suggests 12 different types: { SMA, EMA, DEMA, TEMA, WMA, VWMA, SMMA(RMA), HullMA, LSMA, ALMA, SSMA, TMA } You can configure them via input tab. This is a non-repaint indicator with light load. To implement them I referred to standard libraries of pine script.
FREE

A problem when indicator call webrequest is "The WebRequest() function is synchronous, which means its breaks the program execution and waits for the response from the requested server. Since the delays in receiving a response can be large, the function is not available for calls from indicators, because indicators run in a common thread shared by all indicators and charts on one symbol. Indicator performance delay on one of the charts of a symbol may stop updating of all charts of the same symb
FREE

The Detective Pips EA is an automated hands-free tool that trade pending order breakout at previous high and low strategy. This EA is also a non-Martingale and Hedging Mechanism by which most traders are comfortable with, profits are secured by the adjustable trailing stop. Also, this strategy works with small average profits therefore it is highly suggested to trade with a low spread and commission broker. This EA is a great day trading scalping Project that are able to trade both trending and
FREE

Introduction and Description
Bawaba, from the Arabic word for "Grid", is a grid-based scalping robot for FOREX currency pairs. It has adjustable stoploss and takeprofits, as well as the possibility of having a fixed volume or adapting to the account balance. Grid scalping is when a grid of orders is created by increasing and decreasing prices incrementally above and below a set price. Below is a list of the different characteristics of the expert advisor: No Martingale. Grid scalping and tradin
300 downloads without review ? !!!!
If continued. I will not share any product for free. :( Small and very simple timer next to the current price to show the end time of the current candle
Very useful and important for scalpers and those who work on price action.
We assure you that we welcome any suggestions to improve this indicator and make the necessary changes to improve this indicator.
You can contact us via Instagram, Telegram, WhatsApp, email or here. We are ready to answer you.

!! BLACK FRIDAY !! FOR LIFETIME !! ================== == 35$ ONLY !! == ==================
BOOK YOURS NOW !!
The Position Manager Contains A Lot of Functions such as; (How to Operate) 1. Adjustable Volume per Trade (You could change the volume as you wish per trade). 2. Adjustable Risk : Reward Ratio (1RR means sacrifice 1 Risk : 1 Reward, 1.5RR, 2RR etc. as you wish) 3. Adjustable Stop Loss Points (Calculated Points as Stop Loss and Automatically adjusted the Risk Reward Ratio) 4. Buy Butt
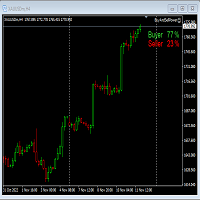
This Expert Advisor will not place any trade.
This Expert Advisor will only show the buyer and the seller power in percentage on the upper right corner of the selected chart. The percentage of the Buyer and Seller is calculated based on the Open, Close, High and Low price of the selected candle.
Candle can be selected using the shift on the Input Tab where 0 means the current candle, 1 means previous 1 candle before the current candle.
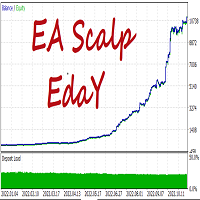
EA Scalp EDay required set file Be sure to contact me after purchase for personalized recommendations and a personal bonus!
- Is a scalping system on strong price levels. One of the oldest strategies, modernized and updated for the current market.
The strategy does not require any optimization. You should just install the set file and run it according to the recommendations. Advantages of EA Scalp EDay: - Optimal SL/TP ratio. - Low SL, which makes the system as safe as possible. - Every
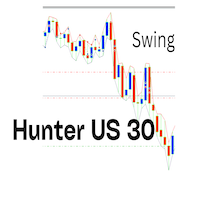
Hunter US30 Expert Advisor is created to trade US30 (Dow Jones). The intelligence behind it uses current information to determine it trading direction.
If you want to trade low risk for passive income, US30 Hunter is your best Advisor.
Hunter US30 is a for Swing Trading, however, scalpers can trade in its direction when a trade is running. Works best on the Daily time frame This Expect Advisor is a low risk strategy. No Martingale , No Grid, or any other lethal strategy. We believe in cons

No Grid or Martingale system used.
EA uses Trend Following Hybrid System, using Turtle Breakout System and Advanced Trading Techniques. Screenshot of Back Test Attached for Hourly Timeframe GBPJPY from [ Jan 2011 - Oct 2022] .
Recommended Pair To Trade: GBPJPY (Input Settings Provided as Default for H1) Recommended Timeframe: Hourly (H1) Note: Can use on any Trending Pair or Timeframe , but make sure to change parameters accordingly e.g. (TP, SL and Bar Count) and perform thorough Back Test
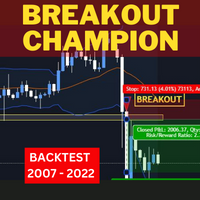
NO Martingale or Grid System used. Breakout System Recommended Pair GBPJPY : Hourly (H1)Timeframe BackTested from 2007 - 2022 screenshots attached. Take Profits are done using Trailing SL. BreakEven option and Manual TakeProfit Setting option provided for users to tweak if desired. EA opens 1 Breakout trade at a time. Default values are Recommended for GBPJPY H1 based on this Trading System.

Basic Version with Limited Lot sizes for Real world Testing. Royal Radiante is an automated scalping robot that uses a very advanced Logic, Proprietary Indicator, Alot of Technical analysis. Tested and Proven itself on real accounts with a Good Realistic risk-to-reward ratio. The Logic in this strategy is the core of its performance , Even with bad optimization this strategy will still be very profitable! This strategy does not use Any High & Risky Methods like Martingale / Grid Syste
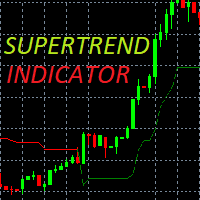
A super-trend indicator is plotted on either above or below the closing price to signal a buy or sell. The indicator changes colour, based on whether or not you should be buying. If the super-trend indicator moves below the closing price, the indicator turns green, and it signals an entry point or points to buy. If a super-trend closes above, then the indicator shows a sell signal in red. You will also note that at the point where buy or sell signal is generated is the crossover point. At the p
MetaTrader Маркет - уникальная площадка по продаже роботов и технических индикаторов, не имеющая аналогов.
Памятка пользователя MQL5.community расскажет вам и о других возможностях, доступных трейдерам только у нас: копирование торговых сигналов, заказ программ для фрилансеров, автоматические расчеты через платежную систему, аренда вычислительных мощностей в MQL5 Cloud Network.
Вы упускаете торговые возможности:
- Бесплатные приложения для трейдинга
- 8 000+ сигналов для копирования
- Экономические новости для анализа финансовых рынков
Регистрация
Вход
Если у вас нет учетной записи, зарегистрируйтесь
Для авторизации и пользования сайтом MQL5.com необходимо разрешить использование файлов Сookie.
Пожалуйста, включите в вашем браузере данную настройку, иначе вы не сможете авторизоваться.