Смотри обучающее видео по маркету на YouTube
Как купить торгового робота или индикатор
Запусти робота на
виртуальном хостинге
виртуальном хостинге
Протестируй индикатор/робота перед покупкой
Хочешь зарабатывать в Маркете?
Как подать продукт, чтобы его покупали
Технические индикаторы для MetaTrader 5 - 86
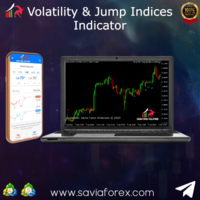
Volatility Index Pro Indicator The Savia Forex Solutions Volatility Index Pro Indicator gives you highly accurate entries on all Volatility Indices and Jump Indices. The Volatility Index Pro Indicator is dynamic and powerful and is optimized for all timeframes. Trade with improved confidence and maximize your success rate. Benefits Dynamic and Powerful. Volatility Index Pro Indicator is fully optimized for all chart timeframes. Volatility Index Pro Indicator works with Volatility Indices and Jum

Welcome to the future of trading! Are you ready to elevate your trading game to new heights? Introducing a groundbreaking trading indicator that is set to redefine the way you approach the markets. With its unparalleled features and cutting-edge technology, this indicator is not just another tool in your arsenal – it's your secret weapon for success. Imagine having access to real-time alerts that keep you ahead of the curve, ensuring you never miss a lucrative opportunity. Picture a tool that

Smart Sniper Entry Spike Detector
Advanced AI-Powered Spike Detection for Boom and Crash Markets
Here are my Socials, make sure you contact me to see How I Use The Spike Detector:
Free Telegram Group: https://t.me/+4jj1artnc_1mMzM8 WhatsApp: https://wa.me/+27659660169 Official Website: https://smartsniperentry.site
The Smart Sniper Entry Spike Detector harnesses cutting-edge artificial intelligence to identify high-probability trading opportunities in Boom and Crash synthetic indices. De

Технический индикатор — TrendGenius , строится на значениях статистических показателей торговли. Он позволяет прогнозировать будущую стоимость актива. Расчеты проводятся по определенному алгоритму на основании данных о котировках за некоторый период. Инструмент создан для упрощения технического анализа и применяется на разных рынках и биржах, включая криптовалютные.
Смена направления, с точки зрения рыночного фундамента, означает смещение торгового интереса в сторону продавцов или покупател

SmartTrend Analyzer - это надежный индикатор без перерисовки, который заинтересует любого трейдера.
SmartTrend Analyzer - это инструмент, который проводит анализ всех пяти аспектов (цены открытия, максимума, минимума, цены закрытия и объема) на основе математических вычислений. С помощью алгоритма форекс-индикатора SmartTrend Analyzer вы быстро сможете определить, какая тенденция развивается на рынке в данный момент. Технический индикатор SmartTrend Analyzer строится на графике в виде набора

Индикатор "Trend Orbital" представляет собой инструмент для отслеживания тренда на рынке финансовых активов. Он основан на анализе ценовых данных и обеспечивает визуальную интерпретацию текущего направления движения цены.
Параметры: InpAmplitude: Амплитуда - определяет размер волатильности, который индикатор учитывает при определении тренда. Группа "Arrow" (Стрелка): InpCodeUpArrow: Код стрелки вверх - определяет символ стрелки для отображения вверхущего тренда. InpCodeDnArrow: Код стрелки вни

Индикатор "Trend Tandem" - это инструмент анализа тренда на финансовых рынках, который помогает трейдерам определить направление движения цены.
Параметры:
RISK (Риск): Определяет уровень риска, учитываемый в анализе тренда. Чем выше значение, тем более агрессивно учитывается волатильность. SSP (Период ССП): Определяет период скользящего среднего, используемого для выявления тренда. Чем больше значение, тем более гладким будет трендовый сигнал. CountBars (Количество баров): Определяет количест

This indicator is used to detect spike movements in Boom and Crash pairs in Deriv company and enter into transactions. The pairs used are Boom300, Boom500, Boom1000, Crash300, Crash500, Crash1000.
When the indicator gives an arrow sign in the expected direction, the transaction is entered and Stop Loss should be placed on the support/resistance areas shown by the indicator.
The indicator does not repaint. It is not used for trend following, but for entering transactions in the direction of th

MOST is applied on this RSI moving average with an extra default option added VAR/VIDYA (Variable Index Dynamic Moving Average)
MOST added on RSI has a Moving Average of RSI and a trailing percent stop level of the Moving Average that can be adjusted by changing the length of the MA and %percent of the stop level.
BUY SIGNAL when the Moving Average Line crosses above the MOST Line
LONG CONDITION when the Moving Average is above the MOST
SELL SIGNAL when Moving Average Line crosses below MOS

Индикатор Trend based on Extremum Levels and Volatility - это удобный инструмент, предназначенный для помощи трейдерам в определении точек перелома тренда и потенциальных уровней фиксации прибыли на различных таймфреймах. Применение индикатора возможно как на рынке форекс, фьючерсов, акций, индексов, сырья так и криптовалюты.
Этот универсальный индикатор строит тренды на основе локальных экстремумов, волатильности и среднего отклонения цены, предоставляя ценные сведения, которые можно исполь

ATR Bands Alert is a channel indicator where the channel width is calculated as a constant multiplier ("Multiplier") and the value of the "Average True Range" indicator. Unlike Bollinger Bands, the bandwidth is not changed so often – in the ATR Bands Alert indicator, the bands often have long straight lines.
The interpretation of the ATR Bands Alert is based on the fact that the price is inside the bands for most of the time, and if the price reaches one of the boundaries, it may indicate a tr

The DYJ SignalSourceOfMACD is based on the MACD indicator. Generally, signals are generated when crossing the MACD and SIGNAL lines of the MACD indicator. Signals to buy are generated if the MACD line crosses over the SIGNAL line in the negative area below the MACD open level. The negative area is where the values of MACD and SIGNAL lines are below zero. The MACD open level parameter is set in pips. However, in the code it is converted as follows: MACD Open level * Instrument.PipSize. For exa

ENG-GOLD Scalper It is an auxiliary indicator that identifies potential targets and determines the place of entry with a stop loss that works on Heiken Ashi candles
The green lines are usually the targets, the red lines are the stop loss, and the yellow lines are the entry location.
This file is recognized on small and medium frames, usually less than the watch frame
I highly recommend using XAUUSD Nasdaq100 Dow30 USOIL
DYJ SignalSourceOfRSI is a momentum oscillator which shows price strength by comparing upward movements of Close prices to their downward movements over a selected number of periods. There are two kinds of signals provided by RSI: RSI reaching of either overbought or oversold level and then making a bit of reversal: Signals to buy are generated falling of RSI below level(30) and Signals to sell are generated rising of RSI above level(70) Falling of RSI below level(30) and then rising above level

The Heikin Ashi Delta Pro leverages the refined elegance of Heikin Ashi candlesticks, renowned for their ability to filter market noise and highlight clearer trends and reversals. Building on a solid foundation, this advanced indicator integrates the Hull Moving Average method, enhancing its precision and responsiveness. Alongside an intuitive alert system, it transforms raw market data into actionable trading insights, empowering traders to make more informed decisions swiftly. Learn more about

Индикатор TimeCycleCaptor представляет собой инновационное средство для точной визуализации рыночного тренда и генерации сигналов на покупку и продажу.
Рыночный тренд играет ключевую роль в принятии торговых решений, и наш индикатор предоставляет надежный инструмент для его определения. Мы воплотили мечту трейдеров о незапаздывающих скользящих средних в нашем индикаторе.
TimeCycleCaptor способен прогнозировать будущие значения и предназначен как для определения основного тренда, так и для выя

В мире трейдинга нет универсального индикатора, который всегда обеспечивает исключительно прибыльные сигналы независимо от рыночных условий. Не смотря на ваше упорство, такой инструмент просто не существует. Однако, с индикатором Trend Master Arrow у вас будет надежный помощник в создании вашей собственной торговой системы.
Хотя следовать стрелочным сигналам необходимо с осторожностью и учитывать дополнительные фильтры, индикатор Trend Master Arrow обеспечивает ценную информацию для определени

Индикатор Market Might, несмотря на свою внешнюю простоту, основан на сложных аналитических алгоритмах, позволяющих точно определять моменты входа и выхода из сделок. Сигналы, генерируемые этим индикатором, являются точными и своевременными, появляясь непосредственно на текущей свече.
Основная задача индикатора Market Might заключается в определении моментов входа и выхода из сделок. Поэтому он отображает только линию тренда и точки входа, что обеспечивает ясное представление о местах входа на

The "No Reversal Accumatrix AI" is a cutting-edge MetaTrader 5 indicator designed to assist traders in confirming trends without the inconvenience of repainting. Built upon advanced artificial intelligence algorithms, this indicator offers a reliable tool for identifying and validating trends in financial markets. Key Features: Non-Repainting Technology : Unlike traditional indicators prone to repainting, the "No Reversal Accumatrix AI" utilizes innovative algorithms to provide accurate trend co

The indicator show Higher timeframe candles for ICT technical analisys Higher time frames reduce the 'noise' inherent in lower time frames, providing a clearer, more accurate picture of the market's movements.
By examining higher time frames, you can better identify trends, reversals, and key areas of support and resistance.
The Higher Time Frame Candles indicator overlays higher time frame data directly onto your current chart.
You can easily specify the higher time frame candles you'd li
Introduction
The Price Action, styled as the "Smart Money Concept" or "SMC," was introduced by Mr. David J. Crouch in 2000 and is one of the most modern technical styles in the financial world. In financial markets, Smart Money refers to capital controlled by major market players (central banks, funds, etc.), and these traders can accurately predict market trends and achieve the highest profits.
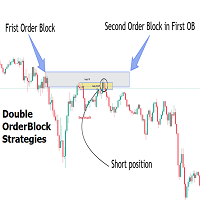
In the "Smart Money" style, various types of "order blocks" can be traded. This indicator uses
With this indicator TheStrat bar numbers can be displayed above and below candles of the chart. The numbers have the following meaning: 1 = Inside Bar 2 = Directional Bar 3 = Outside Bar. In TheStrat-method there are Actionable and In-Force patterns / combos to define entries for trades. These patterns are also displayed by the indicator.
Here are the settings that can be configured: Number of lookbar bars : For how many candles in the past numbers are dislayed Color of inside bar : The color o

THis indicator is a typical trend following indicator. ION BOT is based on the price position and its trail stop. When the price is above its trail stop the indicator is in an uptrend, and therefore the candles are coloured green, signalling the beginning of a trend with a green arrow.
Here are some of its key functionalities: Trend Analysis: The UT Bot Alert Indicator uses advanced algorithms to analyze market trends and identify key support and resistance levels. This information can help tra

The Ultimate Trend and Reversals Detector The Ultimate Trend and Reversals Detector is a powerful tool designed to identify potential trend reversal zones in the financial markets. Here are the key features: Objective : Detect trend directions and reversals. Signal Colors : Green : Indicates a potential bullish trend reversal. Red : Signals a potential bearish trend reversal. Non-Repainting : The indicator’s signals are not redrawn, providing reliable information. Suitable for All Styles : Scal

Используя индикатор Future Trend, вы сможете предвидеть будущее движение цены на определенное количество баров вперед. Этот индикатор создает линию, отображающую моделированные будущие значения цен, что предоставляет вам ценную информацию для принятия решений о входе или выходе с рынка, а также для установки или коррекции стоп-лоссов, сопровождающих вашу позицию.
Кроме того, у индикатора Future Trend есть несколько параметров: HistoricBars - определяет количество исторических баров, которые ис
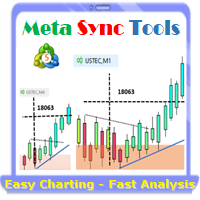
Supercharge Your MetaTrader Analysis and Trading with Meta Sync Tools! Struggling to analyze price action across different timeframes? Meta Sync Tools eliminates the frustration of unsynced crosshairs and charts, allowing seamless multi-timeframe analysis. Missing key correlations between assets and constantly switching between charts? Meta Sync Tools empowers you to visualize relationships between instruments effortlessly. Tired of wasting time on repetitive tasks? With 30+ Customizable Short

Introduction
"Smart money" is money invested by knowledgeable individuals at the right time, and this investment can yield the highest returns.
The concept we focus on in this indicator is whether the market is in an uptrend or downtrend. The market briefly takes a weak and reversal trend with "Minor BoS" without being able to break the major pivot.
In the next step, it returns to its main trend with a strong bullish move and continues its trend with a "Major BoS". The "order block" beh

Introduction
The "Smart Money Concept" transcends mere technical trading strategies; it embodies a comprehensive philosophy elucidating market dynamics. Central to this concept is the acknowledgment that influential market participants manipulate price actions, presenting challenges for retail traders.
As a "retail trader", aligning your strategy with the behavior of "Smart Money," primarily market makers, is paramount. Understanding their trading patterns, which revolve around supply, de
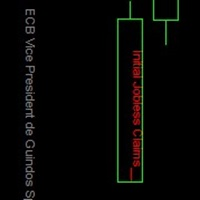
This is one of the most powerful indicators I've ever made.
I was tired of looking at other windows/websites for economical news, and regularly something would happen without me realising.
So I made this indicator which displays all news at the exact time of arrival, directly on the charts!
Now you too can just focus on the charts and know that you won't miss any news events.
There are options:
1. You can choose to display on the price line, or at the bottom of the chart. 2. You can choose t
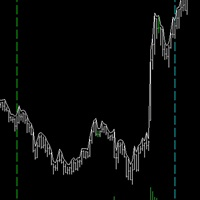
This is one of my most important indicators. Did you ever miss the session open/close? I did, which is why I made this indicator. It took a long time to get this right, since depending on your platform and timezone, it can be incorrect. It should be accurate for everyone now. It takes into account Daylight savings for NY and EU timezones, and should just work like magic on your charts.
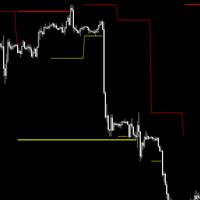
## Check screenshots to see proof that this indictor is a must! ##
Do you hate having to have a Monthly, Weekly, Daily chart when looking at your lower timeframes? I hated it too, so I made this. It will show you the High and Low of other timeframes on your chart, so you will always be aware where some support/resistance may be! Even on the 1 minute chart!
I recommend you use it 3 times, one with Day, Week and Month selected with different line widths.
I use this on every chart I look at. Yo

PMax is a brand new indicator developed by KivancOzbilgic in earlier 2020.
It's a combination of two trailing stop loss indicators;
One is Anıl Özekşi's MOST (Moving Stop Loss) Indicator and the other one is well known ATR based SuperTrend. Both MOST and SuperTrend Indicators are very good at trend following systems but conversely their performance is not bright in sideways market conditions like most of the other indicators.
Profit Maximizer - PMax tries to solve this problem. PMax combi

The Fat and Slim indicator tracks strong and weak money in the market. It is derived from RSI, MFI and many similar indicators. Input values are closing prices and volumes. The RSI (yellow curve) is in the range -100 ... 100. It is additionally multiplied by a coefficient so that the curve is not compressed to the middle values at higher periods (a problem with the classic RSI with different periods). Strong/Fat red curve is RSI weighted by higher volumes. Weak/Slim blue curve is calculated so t
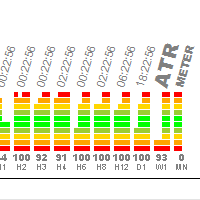
Индикатор предназначен для быстрого определения волатильности на инструменте. Очень удобно меняя графики сразу понимать на каких инструментах и временных периодах идет бойкая торговля, а где происходит затишье. Индикатор использует данные индикатора ATR переведенные в проценты. Если нанести ATR на график, на экране будут видны примерно 100-300 баров, я усреднил это значение и по умолчанию установил 150 (можете изменить в настройках на ваше усмотрение). Принцип работы: берем 150 значений ATR нахо

Heikin Ashi candlesticks are a powerful tool for traders, offering a clear and smooth visualization of market trends. Unlike traditional candlesticks, they filter out market noise, providing a cleaner view of the market's direction and strength, which helps traders make more informed decisions. The Hull Heikin Ashi Smoothed indicator from Minions Labs takes this a step further by integrating the Hull Moving Average for enhanced smoothing and precision. This indicator not only simplifies trend id

Следуйте тренду. Да, дождитесь сигнала на вход, будь то покупка или продажа, на 15-минутном фрейме и проверьте сигнал, если он появится на 30-минутном фрейме (иногда для появления сигнала требуется час или больше. Вы можете вернуться на 15-минутный фрейм и вернитесь к 30-минутному фрейму и повторяйте это до тех пор, пока у вас не появится основной сигнал. Если сигнал появляется на 30-минутном фрейме, входите по цене и фиксируйте прибыль при изменении линии рисунка. , фиксируется прибыль или при
>>> MEGA SALE: 40% OFF! - Promo price: $77 / Regular price $129 <<< - The promotion will end soon!
The Forex Trend Tracker is an advanced tool designed to enhance the trading capabilities of forex traders. This sophisticated indicator uses complex mathematical formulas alongside the Average True Range (ATR) to detect the beginnings of new upward and downward trends in the forex market. It offers visual cues and real-time alerts to give traders a competitive advantage in the fast-paced world o

Volume plays a crucial role in trading, serving as a key indicator of market activity and investor sentiment. Here are some important roles of volume in trading:
Confirming trends: Dow Theory emphasizes the importance of volume in determining market trends. Larger volume usually indicates greater disagreement between bulls and bears, while smaller volume may indicate higher market agreement with the current price. Capturing institutional moves: By analyzing volume over a period of time, one ca

Overview
In the evolving landscape of trading and investment, the demand for sophisticated and reliable tools is ever-growing. The AI Trend Navigator is an indicator designed to meet this demand, providing valuable insights into market trends and potential future price movements. The AI Trend Navigator indicator is designed to predict market trends using the k-Nearest Neighbors (KNN) classifier.
By intelligently analyzing recent price actions and emphasizing similar values, it helps t

MultiFractal Levels MultiFractal Levels – это модифицироанный индикатор фракталов Била Вильямса с добавлением уровней. Фракталы строятся со всех ТФ, разрешённых в настройках.
Уровни строятся только по самым последним фракталам, которые ещё не были протестированы ценой.
Преимущества перед оригинальным терминальным индикатором:
Удобство Наглядность Информативность Самые свежие уровни Настраиваемый фрактал Настраиваемые уровни Индикатор удобен, поскольку не нужно переключаться на разные та

This is the MT5 version of Ku-Chart.
This is an indicator devised by Ku-chan, a famous Japanese trader, based on the dealings of Lehman Brothers' discretionary traders. Unify the measuring stick of currencies to display the true value of currencies.
Although it is an indicator, it does not use a buffer and is displayed using objects such as trend lines. Also, instead of drawing on the subchart, it is drawn in an area far above the current price of the main chart, so you can switch from the no

Introduction
The "Smart Money Concept" transcends the realm of mere technical trading strategies to embody a comprehensive philosophy on the dynamics of market operations. It posits that key market participants engage in price manipulation, thereby complicating the trading landscape for smaller, retail traders.
Under this doctrine, retail traders are advised to tailor their strategies in alignment with the maneuvers of "Smart Money" - essentially, the capital operated by market makers.

Introducing our state-of-the-art Wave Indicator, meticulously designed for the discerning traders of the MQL5 community! At the core of this innovative tool lies an unmatched sensitivity to capture even the slightest market movements. Our Wave Indicator serves as the foundational element for constructing comprehensive trading strategies, providing you with an unwavering edge in the dynamic world of finance. Whether you're aiming to refine short-term tactics or develop long-term systems, this ind

TMA CG FAST MT4 REPLICADO PARA MT5 Cuenta con todas las caracteristicas del original con la funcion adicional de tener señal al fallo que consiste en que despues de una cantidad de velas establecida por el usuario emita una preseñal para una potencial entrada tiene alerta sonora para la posible entrada y la entrada definitiva tiene la posibilidad de repintar o no , queda a eleccion de usuario
Раскройте весь потенциал своего торгового индикатора с помощью XDashboard MT5, лучшего индикатора информационной панели для MetaTrader 5. XDashboard MT5, созданный для трейдеров, которым требуется точность и эффективность, предлагает беспрецедентное представление любого индикатора на нескольких символах и таймфреймах. все из единого настраиваемого интерфейса. ** Эта цена ограничена по времени ** Функции: Интеграция пользовательских индикаторов
Комплексный многосимвольный мониторинг Мульти
The Hull Moving Average is known for its ability to reduce lag and provide a clearer, more accurate depiction of market trends. By smoothing price data more effectively than traditional moving averages, it helps traders identify trend directions and reversals with greater precision. The Hull Cloud indicator elevates this by using four Hull Moving Averages working together like an orchestra. This combination creates a dynamic system that highlights short, medium, and long-term trends, giving trad
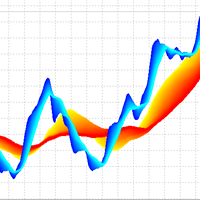
3D Trend Indicator is a non-repaint indicator using multiple moving averages with a 3D surface view. By using this indicator, you can remove uncertainties that can happen using a single and fixed moving average period. You can use a cloud area using a range of moving average periods. Also a wide range of visual settings are added to this indicator to have a better view from the cloud area. Alert and notification system added to the indicator to inform the trader about the action of candles on t
Apresentamos o Indicador de novo grafico - uma ferramenta poderosa para traders que buscam uma análise de preço suave e clara. Este indicador inovador calcula a média simples dos preços, oferecendo uma visão precisa e ajustada dos movimentos do mercado. Como Funciona : O Indicador de Média de Preços Simples (SMA) utiliza uma fórmula simples e eficaz: Ele soma o valor do último preço com o preço anterior. Em seguida, divide essa soma por 2 para obter a média. Fórmula : SMA = U ˊ ltimo Pre c ¸ o +

The Multi Asset Monitor Panel is a game-changer for traders who need to keep an eye on multiple markets simultaneously. This innovative panel allows you to monitor any symbol and any timeframe you need, all within a single, organized interface. With up to three lists of symbols and customizable MT5 templates, you can tailor your monitoring setup to fit your specific trading strategy. What sets the Multi Asset Monitor Panel apart is its flexibility and customization options. You can control the s

Course Crystal — индикатор, который помогает трейдерам определить направление тренда на рынке. Он использует уникальный алгоритм для анализа движения цен и отображает результаты на графике в виде цветных областей. Синий цвет указывает на возможность покупки, а красный — на возможность продажи. Инструкция по использованию - https://www.mql5.com/en/blogs/post/757800 Ручная торговая система:
Определение тренда: индикатор Course Crystal анализирует текущие и прошлые данные о ценах, чтобы определит

Unlock the power of Fibonacci with our advanced indicator!
This tool precisely plots Fibonacci levels based on the previous day's high and low, identifying the next day's key support and resistance levels. Perfect for day trading and swing trading, it has consistently generated weekly profits for me.
Elevate your trading strategy and seize profitable opportunities with ease.
NOTE: In the Input section make sure the draw labels are set to "True" so you can see each levels.

MinMax Levels – это индикатор уровней максимальной, минимальной и цены открытия за важные торговые периоды: дня, недели и месяца.
Каждый участник рынка форекс испольует уровни в своей торговой системе. Они могут быть как основным сигналом к совершению сделок, так и дополнительным, выступая в качестве аналитического инструмента.
В данном индикаторе в качестве важных периодов были выбраны дни, недели и месяцы, поскольку они являются кючевыми периодами торговли крупных участников рынка. Как изв

Description of the Indicator The indicator "BullsBearsPulse" is designed for MetaTrader 5 and provides a visual representation of the Bulls Power and Bears Power indicators. These indicators are useful tools for technical analysis, particularly for the EUR/USD currency pair, to help traders identify potential trading opportunities. Functionality Bulls Power : This indicator measures the strength of the bulls (buyers) in the market. It calculates the difference between the highest price and a 20

O LIVRO VISUAL é uma ferramenta que auxilia na identificação de escoras e renovação de ordens, para quem opera Tape Reading ou fluxo no gráfico é uma excelente ferramenta. Porem ele funciona somente em Mercados Centralizados ou com profundidade nível 2. É de fundamental importância você saber que ele não funciona em Mercado de FOREX. Porem pode ser utilizado no Mercado da B3.

Оптимизируйте свои торговые стратегии с индикатором RAR (Relative Adaptive RSI)! Этот продвинутый индикатор технического анализа сочетает в себе мощь индекса относительной силы (RSI) с адаптивными технологиями, предоставляя более точные и надежные сигналы по сравнению с обычным осциллятором. Что такое индикатор RAR? RAR - это индикатор, разработанный для MetaTrader 5, который использует экспоненциальные скользящие средние (EMA) и адаптивные скользящие средние (AMA) для сглаживания RSI и динамиче

Introducing the Raymond Cloudy Day indicator, a groundbreaking tool conceived by Raymond and brought to life on the MT5 platform by my coding expertise. This state-of-the-art indicator revolutionizes trading strategies by combining the robustness of an innovative calculation method that goes beyond traditional Pivot Points, with the precision of advanced algorithms. Source Code for EA: View Key Features: Innovative Calculation Method : At the heart of the Raymond Cloudy Day indicator

PyNinjaTrader — перетаскивание API-коннектора Python для NinjaTrader 8
PyNinjaTrader легко соединяет ваши скрипты Python с NinjaTrader 8, используя простую стратегию перетаскивания. Это полностью протестированное, быстрое и эффективное решение использует веб-сокеты для связи, при этом стратегия выступает в роли сервера, а сценарий Python — в качестве клиента.
Функции: - Вход на Python в терминал NinjaTrader 8 - Функция Keep-Alive для непрерывного соединения - Получить информацию об учетной за
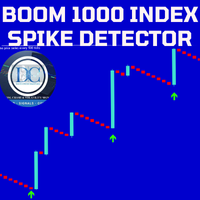
Our Spike Detector is specifically engineered to cater to the unique needs of traders in the Boom and Crash indices markets. This tool is optimized for M1 (1-minute) and M5 (5-minute) timeframes, ensuring you receive timely and actionable insights.
Key Features: 1. **Non-Repainting**: Our detector guarantees accuracy with non-repainting signals, ensuring your data remains consistent and reliable. 2. **Push Notifications**: Stay updated with real-time push notifications, so you never miss a cri
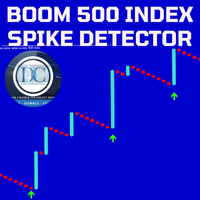
Our Spike Detector is specifically engineered to cater to the unique needs of traders in the Boom and Crash indices markets. This tool is optimized for M1 (1-minute) and M5 (5-minute) timeframes, ensuring you receive timely and actionable insights.
Key Features:
1. Non-Repainting**: Our detector guarantees accuracy with non-repainting signals, ensuring your data remains consistent and reliable. 2. Push Notifications**: Stay updated with real-time push notifications, so you never miss a criti

Our Spike Detector is specifically engineered to cater to the unique needs of traders in the Boom and Crash indices markets. This tool is optimized for M1 (1-minute) and M5 (5-minute) timeframes, ensuring you receive timely and actionable insights.
Key Features:
1. **Non-Repainting**: Our detector guarantees accuracy with non-repainting signals, ensuring your data remains consistent and reliable. 2. **Push Notifications**: Stay updated with real-time push notifications, so you never miss a cr
The Interactive RSI indicator can generate RSI divergence with the availability of user defined filters. It can generate voice alerts for RSI oversold and RSI Overbought situations. Moreover it can also generate voice alerts for RSI Divergneces as well as when price breaks above or breaks below the support and resistances created upon divergence ouccurence. The voice alerts are generated in a way that you will know which market has reached the oversold and overbought conditions as well as the r

This indicator shows the engulfing pattern, which is the most direct manifestation of capital flow. Engulfing Pattern is a common price reversal pattern in technical analysis, which usually appears at the end of a price trend or at key support and resistance levels. It can be divided into two types: Bullish Engulfing Pattern and Bearish Engulfing Pattern. Bullish Engulfing Pattern feature: Previous K-line: This is the negative line of a small entity (the opening price is higher than the closing

Trend reversal identification: The K-line countdown indicator helps traders capture trend reversal signals by identifying excessive buying and selling behavior in the market. This indicator is particularly effective when the market is in extreme states. Risk management: This indicator can help traders identify potential risks in the market before the trend reverses and adjust positions in time to avoid losses. For example, you might consider reducing your long position when a bullish countdown c

Price update indicator — can issue any type of alert when the price reaches certain levels set by a trader. There are three types of price levels: the first one is used when the price rises above certain level (displayed with the green line on the chart), the second one is used when the price falls below certain level (displayed with the red line on the chart), and the third one is used when the price reaches the certain level exactly (displayed with the yellow line). Three alert types include

Индикатор "Channel Craft" представляет собой классический инструмент из семейства канальных индикаторов, который позволяет трейдеру своевременно реагировать на выход цены за пределы установленного канала. Этот канал формируется на основе анализа нескольких свечей, начиная с последней, что позволяет выявить экстремумы в изучаемом диапазоне и построить линии канала. Торговля внутри канала является одной из наиболее распространенных стратегий на рынке форекс, благодаря своей простоте она доступна д

Точки входа, предоставляемые индикатором Olo May, следует рассматривать как потенциальные моменты изменения направления рынка. Этот индикатор основан на использовании циклически-волновой зависимости, что делает каждую точку входа оптимальной для выявления изменений движения. Самый простой способ использования этого индикатора - открытие позиции в направлении текущего тренда. Однако наилучшие результаты достигаются при комбинировании его с фундаментальными новостями, так как он может использовать

Этот индикатор технического анализа позволяет с высокой вероятностью определить, преобладает ли на рынке тренд или плоскость. Он может использоваться как для торговли внутри канала, так и для торговли на пробой, при условии использования стоп-лоссов для защиты от ложных сигналов.
Индикатор отображает канал в виде линий, расположенных выше и ниже цены, как и другие подобные индикаторы. Верхняя и нижняя линии также могут выступать в качестве уровней сопротивления и поддержки.
Он достаточно точн

Определение текущего рыночного тренда - ключевая задача для успешной торговли. Именно для этой цели был разработан индикатор Book Scheme, который представляет собой передовой алгоритм для наглядного отображения тренда на графике. Многие трейдеры мечтали о наличии надежных скользящих средних, которые не отставали от рынка. Именно эту мечту я превратил в реальность с помощью моего индикатора. Book Scheme позволяет предсказывать будущие значения и создавать точные сигналы для входа и выхода из рынк

Descubra o poder do nosso indicador de alta precisão, projetado para identificar as regiões de alvo e exaustão de qualquer ativo. Testado e validado por mais de 3 anos nos mercados de mini dólar e mini índice, ele oferece confiabilidade e eficácia incomparáveis. Transforme sua estratégia de trading e alcance novos patamares de sucesso com nossa ferramenta inovadora.

Evaluate operational viability in each timeframe and in any instrument, according to their respective spread and percentage volatility, which are essential for correct risk management in your trades.
This indicator is essential for both Day Traders and Swing Traders, as in addition to evaluating operational viability in each timeframe, it is also possible to identify the fair minimum stop for each period and instrument.
Example in Swing Trade: your broker charges a spread equivalent to 0.05%
Узнайте, как легко и просто купить торгового робота в MetaTrader AppStore - магазине приложений для платформы MetaTrader.
Платежная система MQL5.community позволяет проводить оплату с помощью PayPal, банковских карт и популярных платежных систем. Кроме того, настоятельно рекомендуем протестировать торгового робота перед покупкой, чтобы получить более полное представление о нем.
Вы упускаете торговые возможности:
- Бесплатные приложения для трейдинга
- 8 000+ сигналов для копирования
- Экономические новости для анализа финансовых рынков
Регистрация
Вход
Если у вас нет учетной записи, зарегистрируйтесь
Для авторизации и пользования сайтом MQL5.com необходимо разрешить использование файлов Сookie.
Пожалуйста, включите в вашем браузере данную настройку, иначе вы не сможете авторизоваться.