Смотри обучающее видео по маркету на YouTube
Как купить торгового робота или индикатор
Запусти робота на
виртуальном хостинге
виртуальном хостинге
Протестируй индикатор/робота перед покупкой
Хочешь зарабатывать в Маркете?
Как подать продукт, чтобы его покупали
Технические индикаторы для MetaTrader 5 - 5

Этот индикатор рисует на графике зоны спроса и предложения. В сочетании с вашими собственными правилами и методами этот индикатор позволит вам создать (или улучшить) собственную мощную систему. Пожалуйста, ознакомьтесь также с платной версией , которая предлагает гораздо больше. Я рекомендую искать торговые возможности, где первый тест зоны происходит после как минимум 25 баров. Функции Зоны имеют 3 цвета (настраиваются с помощью ввода). Темный цвет для непроверенной зоны, средний для провер
FREE

A top-quality implementation of the famous Super Trend indicator, which needs no introduction. It is completely loyal to the original algorithm, and implements many other useful features such as a multi-timeframe dashboard. [ Installation Guide | Update Guide | Troubleshooting | FAQ | All Products ] Easy to trade It implements alerts of all kinds It implements a multi-timeframe dashboard It is non-repainting and non-backpainting Input Parameters
ATR Period - This is the average true range peri

Full implementation of Directional Movement System for trading, originally developed by Welles Wilder, with modifications to improve profitability, to reduce the number of unfavorable signals, and with Stop Loss lines.
No re-paint
Features
Buy/sell signals displayed on the chart Stop levels visually indicated on the chart Profit-taking points presented in the indicator window Exit points for unfavorable positions presented in the indicator window Signal confirmation through high/low swing cros
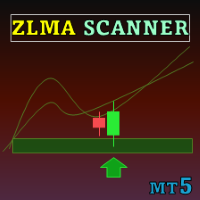
Special offer : ALL TOOLS , just $35 each! New tools will be $30 for the first week or the first 3 purchases ! Trading Tools Channel on MQL5 : Join my MQL5 channel to update the latest news from me Индикатор Zero Lag MA Trend Levels MT5 с функцией сканера объединяет Zero-Lag скользящую среднюю (ZLMA) с обычной экспоненциальной скользящей средней (EMA), предоставляя трейдерам полное представление о рыночной динамике и ключевых уровнях цен. Кроме того, благодаря функциям сканера и оп

Индикатор Magic Histogram MT5 универсальный инструмент, подходящий для скальпинга и среднесрочной торговли. Этот индикатор использует инновационную формулу и позволяет определить направление и силу тренда. Magic Histogram MT5 не перерисовываться, что позволяет оценить его эффектность на истории. Лучше всего использовать на таймфреймах: M15, M30, H1, H4. Версия Magic Histogram для терминала MetaTrader 4: https://www.mql5.com/ru/market/product/23610
Преимущества индикатора Отличные сигн

Этот индикатор для MT5 является конверсией индикатора UT Bot Alerts от @QuantNomad с TradingView.
Он использует ATR для создания пользовательских свечей на графике и предоставляет надежные сигналы для входа в рынок на их основе.
Все буферы, включая буферы пользовательских свечей и сигналов входа, доступны, что позволяет легко интегрировать индикатор в любой советник.
Кроме того, в интернете можно найти различные стратегии на основе этого индикатора, либо вы можете обратиться ко мне для разра
FREE

Simple QM Pattern is a powerful and intuitive trading indicator designed to simplify the identification of the Quasimodo (QM) trading pattern. The QM pattern is widely recognized among traders for effectively signaling potential reversals by highlighting key market structures and price action formations. This indicator helps traders easily visualize the QM pattern directly on their charts, making it straightforward even for those who are new to pattern trading. Simple QM Pattern includes d
FREE
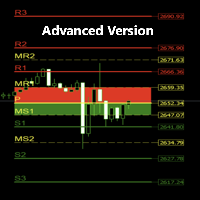
Detailed Description: The Pivot Points Buy Zone Advanced Indicator takes the concept of pivot points to a whole new level, providing traders with enhanced functionality, customizations, and in-depth visualizations. Unlike the free basic version, this advanced indicator allows users to customize more settings, analyze current and historical pivot points, enable potential buy (green) and sell (red) set-ups on the chart, use alerts and pop-up messages, ... etc. Extra Key Advanced Features: Fully C

Pips on Candles shows the number of pips involved in each candle on the chart. It is possible to set 3 different ranges for counting on each single candle via the RangeType parameter: With "HighLow" you count the pips present between the minimum and the maximum. The number is shown under each candlestick on the chart. With "OpenClose" you count the pips present between the opening and closing price of the candle. The number is shown under each candlestick on the chart. With "HighDistAndLowDist"
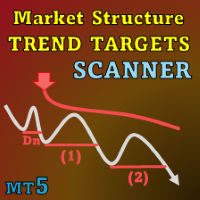
Special offer : ALL TOOLS , just $35 each! New tools will be $30 for the first week or the first 3 purchases ! Trading Tools Channel on MQL5 : Join my MQL5 channel to update the latest news from me I. Введение
Market Structure Trend Targets Scanner — мощный инструмент для анализа рыночных трендов, выявления точек прорыва и управления рисками с помощью динамического стоп-лосса. Отслеживая предыдущие максимумы и минимумы для определения прорывов, этот инструмент помогает трейдерам б

Индикатор Pips Chaser был разработан в дополнение к вашей ручной торговле. Этот индикатор можно использовать как для короткого скальпинга, так и для длинной свинг-торговли // Версия MT4
Особенности Индикатор без перерисовки Этот индикатор не меняет свои значения при поступлении новых данных Торговые пары Любая валютная пара Таймфрейм Предпочтительнее H1, но вы можете адаптировать его к любому таймфрейму Время торговли Круглосуточно
Требования
Использование ECN-брокера с узкими спредами дл
FREE

Place price Alerts on extended Rectangles and Trendlines - Risk reward indicator mt5 Extend Rectangles & Trendlines to the right edge Mark your supply demand zones with extended rectangle and draw support resistance lines with extended trendline. Find detailed manuals here . Find contacts on my profile . MT4 Rectangle extender indicator will simplify and make it easier for you to analyze markets and stay notified about important events. When you extend rectangle or trendline the a

Trend Entry Indicator Your Trading will Be easier with this indicator!!! This Indicator is Developed To make our trading life easier. Get an Arrow for Entry with Take Profit and Slop Loss marks on chart. - Indicator is Based on trend, because thats what we all want we want to follow the trend "it's our friend". - Based on Levels, price action and oscillators. - It works on all currency pairs, all indices, metals and stock. - it works on all pairs/indexes on Deriv including Boom and Crash. - Tim

Smart Volume Box is designed to give MetaTrader users a powerful, analytical tool for uncovering the hidden dynamics in the market. This precision-built tool, complete with user-friendly settings, integrates essential volume insights and advanced features like Volume Profile, VWAP (Volume Weighted Average Price), and Point of Control (POC) levels. Unlike typical indicators, Smart Volume Box doesn’t provide specific trade signals but instead offers a clearer perspective on market trends, makin

MACD divergence indicator finds divergences between price chart and MACD indicator and informs you with alerts (popup, mobile notification or email) . Its main use is to find trend reversals in the chart. Always use the divergence indicators with other technical assets like support resistance zones, candlestick patterns and price action to have a higher possibility to find trend reversals. Three confirmation type for MACD divergences: MACD line cross zero level Price returns to previous H/L Crea
FREE
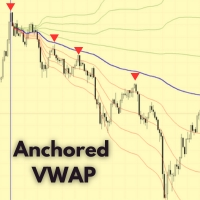
Anchored VWAP (Volume-Weighted Average Price) Indicator The Anchored VWAP (Volume-Weighted Average Price) is a technical analysis tool that calculates the average price of an asset, weighted by volume, from a specific user-defined starting point. Unlike traditional VWAP, which resets daily, the Anchored VWAP allows traders to select a significant event, such as earnings reports, swing highs/lows, or other key price levels, to analyze price trends and market sentiment. By anchoring the VWAP to a
FREE
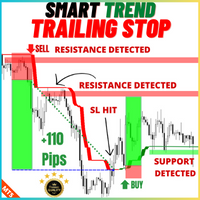
Smart Trend Trailing Stop Indicator, Forex trend tracking tool, Trend-following stop loss, Trend band visualization, Stop loss optimization, Trend trading strategy, Trailing stop technique, Smart stop placement, Trend continuation tool, Band for trend tracking, Forex trend analysis, Stop loss below trend, Trend following without premature stop loss hit, Smart stop loss placement, Trend squeeze strategy, Trailing stop for trend trading, Forex trend optimization, Band for trend tracing, Maximize

An ICT fair value gap is a trading concept that identifies market imbalances based on a three-candle sequence. The middle candle has a large body while the adjacent candles have upper and lower wicks that do not overlap with the middle candle. This formation suggests that there is an imbalance where buying and selling powers are not equal. Settings Minimum size of FVG (pips) -> FVGs less than the indicated pips will be not be drawn Show touched FVGs Normal FVG color -> color of FVG that hasn't
FREE

Unlock the power of the market with the Investment Castle Multi Time Frame Moving Average Indicator. Simplify your trading journey by easily identifying trends and pullbacks across multiple time frames on one convenient chart. This indicator is a must-have tool for any serious trader. Available for MT4 and MT5, and exclusively on the MQL5 market, customize your experience by adding as many indicators as you need on the chart, each with their own unique time frame or period. Enhance your strat

Offer 249 down from 350 for the next 1 copies. then back to 350 $
Are you tired of using outdated indicators that leave you guessing where to set your profit targets? Look no further than the AK CAP Opening Range Breakout Indicator. This powerful tool is backed by a US patent and has already helped countless traders pass funded challenges like FTMO. We use it daily on our prop traders and internal funds, and now it's available to you as well. The calculation behind the indicator is incredibly a

Fully featured Pivots and Levels indicator Pivots: Floor (normal), Woody, Camarilla, Fibonacci Levels: ATR, Historical Volatility with standard deviations, Close Price Volatility with standard deviations
Features: - 4 +/- levels
- MTF, pivots/levels based on Daily, Weekly, 4hr or even 15min - Hour and minute time offset
- Texts with prices and pip distances to central pivot/level - Inputs for Camarilla/Fibonacci/ATR/Volatility levels
- Alerts, popup, push, email, sound, live or completed candle
The Traders Dynamic Index indicator is the only technical indicator you need to scalp the market successfully. The TDI is the only technical indicator that can read the market sentiment, market volatility, and momentum at the same time. The advantage of combining the qualities of several indicators into one indicator is that it can be the “holy grail” you are looking for. Let’s break down the Traders Dynamic Index indicator and go through it a little bit. As you can see, this scalping indicator

CAP Channel Trading - индикатор на основе волатильности, который в своей работе использует "теорию расширенных огибающих". Эти огибающие состоят из двух внешних линий. Теория огибающих утверждает, что рыночная цена, как правило, попадает в диапазон между границами огибающей (или канала). Если цены выходят за пределы огибающей, это торговый сигнал или торговая возможность.
Как торговать В основном CAP Channel Trading можно использовать для помощи при определении состояния перекупленности и переп
FREE

Индикатор позволяет анализировать изменения тиковых объемов в виде кумулятивных дельта-баров (свечей). Он вычисляет на каждом баре тиковые объемы для покупок и продаж (раздельно), а также их разницу. Кроме того, он может выводить объемы в разбивке по кластерам (ячейкам) цен внутри указанного бара (обычно это последний бар). Данный индикатор производит вычисления аналогично VolumeDeltaMT5 , но предоставляет иное отображение результатов. Имеется версия для МетаТрейдер 4 - CumulativeDeltaBars . Это

Overview The Smart Money Structure Markup Indicator for MetaTrader 5 is a powerful tool designed to help traders identify key market structures based on popular Smart Money Concepts (SMC) strategies. This indicator detects micro-market structures, providing insights into price movements and potential trend changes. It highlights important elements such as valid Break of Structure (BOS), Change of Character (CHoCH), and Inducement (IDM), helping traders to make informed decisions. Key Features Ma
FREE
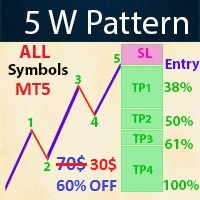
- Real price is 70$ - 60% Discount (It is 30$ now) Contact me for instruction, any questions! - Lifetime update free - Non-repaint - I just sell my products in Elif Kaya Profile, any other websites are stolen old versions, So no any new updates or support. Introduction The Elliott Wave in technical analysis describes price movements in the financial market that are related to changes in trader sentiment and psychology. The 5 W Pattern (Known as 3 Drives) is an Elliott Wave pattern that is forme

Market Sentiment is an indicator for MT5. Market sentiment is the feeling or tone of a market . Also called investor sentiment, it is generally described as being bullish or bearish : When bulls are in control, prices are going up . When bears are in control, prices are going down . Markets being driven by emotions, the market sentiment is about feelings whereas fundamental value is about business performance .
Settings : Range in bars : numbers of bars used for the calculation, at your own c
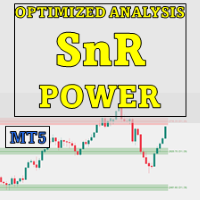
Special offer : ALL TOOLS , just $35 each! New tools will be $30 for the first week or the first 3 purchases ! Trading Tools Channel on MQL5 : Join my MQL5 channel to update the latest news from me Обзор
OA SnR Power — это мощный инструмент, созданный для трейдеров, чтобы идентифицировать и оценивать силу уровней поддержки и сопротивления. Используя такие ключевые факторы, как объем торгов, частота откатов и количество ретестов, этот индикатор предоставляет комплексный обзор крити
FREE

Добро пожаловать в индикатор распознавания образов Advanced Gartley Этот индикатор обнаруживает паттерн Гартли на основе HH и LL ценовой структуры и уровней Фибоначчи, и при достижении определенных уровней Фибо индикатор отображает паттерн на графике. Версия MT4: WH Advanced Gartley Pattern MT4 **Этот индикатор является частью комбо Ultimate Harmonic Patterns MT5 , который включает в себя все функции распознавания образов.**
Функции : Расширенный алгоритм обнаружения паттерна Гартли с вы
FREE
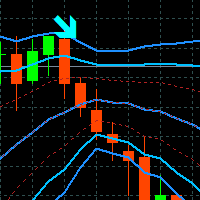
Tyr Bands Indicator
Tyr Band works with BB and 3 different deviations, plus the Stochastic confirmation. So when the price closes below/above the BB Reversal Band (Red) and the Stoch is in the confirmation zone, then the arrow (buy/sell) appears. This arrow indicates that we can entry to the market up/down on the next opening. Since it is only an indicator, it will not place SL or TP, we need to have them placed manually if you want to trade. The SL will lie on the external BB band (Blue), and
FREE
Swing High/Low Identifier Индикатор Swing High/Low Identifier для MetaTrader 5 (MT5) предназначен для выделения значимых точек разворота на вашем графике. Этот индикатор идентифицирует и отмечает высокие и низкие точки разворота на основе настраиваемого диапазона баров. Высокие точки разворота отмечаются красными стрелками над соответствующими свечами. Низкие точки разворота отмечаются синими стрелками под соответствующими свечами. Этот инструмент помогает трейдерам быстро обнаруживать важные це
FREE

Market Structure Indicator BOS CHOCH MT5
The Market Structure Indicator (BOS-CHOCH) is a specialized ICT-style tool designed for MetaTrader 5 (MT5) . This indicator detects both primary and secondary market character shifts (CHOCH) and breaks in structure (BOS) across multiple levels, offering valuable insights for ICT and Smart Money traders . By helping traders analyze price behavior, it enhances market structure recognition and provides more precise trade opportunities. «Indicator Installati
FREE
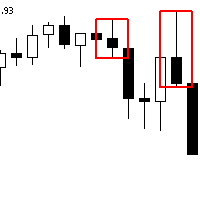
The Advanced Order Block Indicator for MetaTrader 5 is designed to enhance technical analysis by identifying significant order blocks that sweep liquidity and create Fair Value Gaps (FVG) when pushing away. This indicator is ideal for traders who focus on institutional trading concepts and wish to incorporate advanced order flow and price action strategies into their trading routine. Overview Order Block Identification : An order block represents a price area where a substantial number of orders
FREE
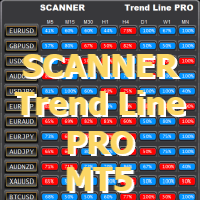
Работает с индикатором Trend Line PRO и set-файлами, созданными Optimizer Utility Вы можете скачать дополнительные программы: здесь
Сканер предназначен для приема новых сигналов индикатора Trend Line PRO на всех парах и таймфреймах от M5 до MN1
Для того чтобы сканер работал, у вас должен быть индикатор. Основным преимуществом сканер Trend Line PRO является возможность использовать индивидуальный файл набора для каждой пары и таймфрейма. Вы можете автоматически настраивать, изменять и сохранят
FREE

IQ FX Gann Levels a precision trading indicator based on W.D. Gann’s square root methods. It plots real-time, non-repainting support and resistance levels to help traders confidently spot intraday and scalping opportunities with high accuracy. William Delbert Gann (W.D. Gann) was an exceptional market analyst, whose trading technique was based on a complex blend of mathematics, geometry, astrology, and ancient mathematics which proved to be extremely accurate. Download the Metatrader 4 Version M
Haven Trend Tracker - это трендовый индикатор, предназначенный для упрощения анализа рыночного направления. Он строит две цветные линии, которые последовательно отображают текущий тренд на графике, а также отмечает стрелками моменты, когда возможен разворот тренда. Другие продукты -> ЗДЕСЬ Индикатор анализирует динамику цен за заданное количество баров, определяя ключевые уровни, характерные для формирования локальных максимумов и минимумов. Эти уровни используются для построения линий, отраж
FREE

CONGESTION BREAKOUT PRO
This indicator scans the breakout of congestion zones . This indicator unlike any other congestion indicator you will find in the market right now, it uses an advanced algorithm not peculiar to most traditional congestion indicators available today . The advanced algorithm used to define the congestions is greatly responsible for the high rate real congestion zones and low rate fake congestion zones spotted by this product.
UNDERSTANDING CONGESTION
Congestion are ar

What is Linear Regression? Linear regression is a statistical method used to model the relationship between price and time. In forex trading, it helps traders identify trends, potential reversals, and areas of support and resistance. Uses of Linear Regression in Forex Trading Trend Identification The regression line acts as a dynamic trendline, showing whether the market is trending upward or downward. Traders can use the slope of the regression line to measure trend strength. Support and Resist
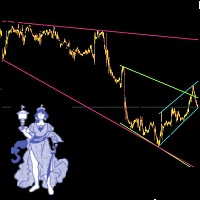
Leave a comment if you would like me to write an EA to trade these trendlines... if enough interest, will write an EA. Automatic Trendlines, updated automatically. To Set up 3 different (or mroe) Trendlines on chart, simply load the indicator as many times and name it differntly.. the example in the picture below is indicator 1 (loaded 1st time): Name: Long, StartBar: 50, BarCount: 500, Color: Pink indicator 2 (loaded 2nd time): Name: Short, StartBar: 20, BarCount: 200, Color: Green indicator 3
FREE

The indicator works to convert normal volume into levels and determine financial liquidity control points.
It is very similar in function to Fixed Volume Profile.
But it is considered more accurate and easier to use than the one found on Trading View because it calculates the full trading volumes in each candle and in all the brokers present in MetaTrade, unlike what is found in Trading View, as it only measures the broker’s displayed prices.
To follow us on social media platforms:
telegram
FREE
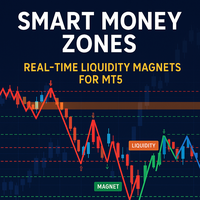
Индикатор SM Zones, разработанный в соответствии с принципами стратегий умного управления капиталом, является очень удобным инструментом для трейдеров на платформе MetaTrader 5 (MT5). Он графически отображает на графике все значимые зоны, используемые в стратегии SM: рыночная структура, ценовые уровни повышенной ликвидности, зоны «магнита цены» — дисбалансы, блоки ордеров, FVG, брейкер блоки и митигейшн блоки. В сторону этих зон, как правило, движется цена инструмента. Зоны, влияющие на бычий р
FREE

For those who struggle with overbloated Volume Profile/Market Profile indicators, here is a solution that contains only the Point of Control (POC) information. Super-fast and reliable, the Mini POC indicator presents this vital information visually within your chart. Totally customizable in splittable timeframes, type of Volume, calculation method, and how many days back you need.
SETTINGS Timeframe to split the POCs within the day. Volume type to use: Ticks or Real Volume. Calculation method .
FREE

Индикатор находит на графике свечные паттерны на основе книги Грегори Л. Морриса «Японские свечи. Метод анализа акций и фьючерсов». При обнаружении модели индикатор выдает сообщение при закрытии бара. Если вы торгуете с помощью терминала MetaTrader 4, то вы можете скачать полный аналог индикатора " Candle Pattern Finder for MT4 "
Список распознаваемых моделей: Бычья / Медвежья (в скобках возможные настройки параметров) : Молот / Падающая Звезда (с подтверждением / без подтверждения*) Перевернут

Индикатор Pz Market Sentiment оценивает рыночную тенденцию на основе примерных измерений ценового движения. Данный индикатор является подтверждающим и может быть особенно полезен для трейдеров, ориентирующихся на ценовые движения. Использовать его для принятия торговых решений нельзя, так как текущее поведение цены и господствующая на рынке тенденция могут не совпадать. Пользоваться индикатором довольно легко: Можно покупать, если осциллятор зеленый Можно продавать, если осциллятор красный
Реко
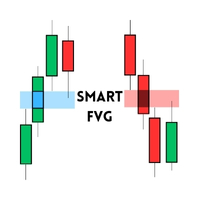
Smart FVG Indicator – Advanced Fair Value Gap Detection for MT5 Enhance Your Trading with the Smart FVG Indicator! Are you looking to identify Fair Value Gaps (FVGs) effectively and integrate them into your trading strategy? The Smart FVG Indicator for MetaTrader 5 (MT5) offers a comprehensive solution to detect and utilize FVGs, providing you with a trading edge. Key Features: Dynamic FVG Detection: Automatically scans and highlights FVGs on your charts, indicating potential institutional
FREE

Индикатор анализирует шкалу объёмов и разделяет её на две компоненты - объёмы продавцов и объёмы покупателей, а также вычисляет дельту и кумулятивную дельту. Индикатор не мерцает и не перерисовывает, вычисления и отрисовку производит достаточно быстро, используя при этом данные с младших (относительно текущего) периодов. Режимы работы индикатора переключаются с помощью входной переменной Mode : Buy - отображает только объёмы покупателей. Sell - отображает только объёмы продавцов. BuySell - отобр
FREE

Представляем Quantum Breakout PRO , новаторский индикатор MQL5, который меняет ваш способ торговли в зонах прорыва! Разработан командой опытных трейдеров со стажем торговли более 13 лет, Квантовый прорыв PRO разработан, чтобы поднять ваше торговое путешествие к новым высотам с его инновационной и динамичной стратегией зоны прорыва.
Quantum Breakout Indicator покажет вам сигнальные стрелки на зонах прорыва с 5 целевыми зонами прибыли и предложением стоп-лосса на основе поля

Identify key turning points with reliable fractal analysis
This indicator examines the price structure of fractals of different periods to determine possible reversal points in the market, providing timing to positional traders that already have a fundamental or technical valuation model. Unlike its younger brother, Reversal Fractals , this indicator won't miss reversals because of the period selected, and will find reversal fractals on a zig-zag fashion, ignoring those reversals which do not

Excessive Momentum Indicator – один из немногих индикаторов, измеряющий чрезмерный импульс на финансовом рынке с использованием ценового поведения. Индикатор полностью разработан Янгом Хо Сео (Young Ho Seo). Этот показатель демонстрирует концепцию и практическое применение Равновесной фрактальной волны (Equilibrium Fractal Wave). Чрезмерный импульс на рынке может рассказать о психологии толпы и помочь спрогнозировать направление цены. Таким образом, вы можете основывать свои торговые решения на

Индикатор к платформе МТ5 имеет стандартные настройки и не требует внесения изменений при его подключению к графику. Модификация индикатора заключается в добавлении в него двух функций, а именно: маркировка участка, в момент когда линии индикатора становятся в правильной последовательности зеленая линия выше (ниже) красной и синей линии и красная выше (ниже) синей линиии, делают крест подтвержденный ценой закрытия периода во избежание ложных сигналов в периоды переплетения линий аллигатора. п

Volumes with Moving Average - это простой и понятный индикатор объема, дополненный скользящей средней. Как использовать? Хорошо подходит для фильтрации сигналов при входе в сделку как от уровней поддержки/сопротивления, так и при прорывах волатильности трендовых каналов. Так же может являться сигналом на закрытие позиции по объему. Входные параметры: Volumes - объем реальный или тиковый. MA_period - период скользящей средней.
FREE

HiperCube AutoTrend Lines Код скидки на 25% на Darwinex Zero: DWZ2328770MGM Этот индикатор поможет вам легко определить уровни поддержки и сопротивления, нарисовать линии на графике и узнать, где находится важная точка на рынке. Этот инструмент — лучший способ полуавтоматизировать вашу торговлю, выполняя часть работы за вас. Сопротивление или поддержка — важные уровни, которые иногда трудно определить, но теперь это не вызовет у вас еще больше путаницы HiperCube Autotrends предназначен для любо
FREE

** All Symbols x All Timeframes scan just by pressing scanner button ** *** Contact me to send you instruction and add you in "Head & Shoulders Scanner group" for sharing or seeing experiences with other users. Introduction: Head and Shoulders Pattern is a very repetitive common type of price reversal patterns. The pattern appears on all time frames and can be used by all types of traders and investors. The Head and Shoulders Scanner indicator Scans All charts just by pressing

Модифицированный осциллятор MACD. Классический индикатор, соединяющий в себе трендовый индикатор с осциллятором для обнаружения точек входа. Имеет мультитаймфреймовую панель, а также 3 типа уведомлений
Преимущества:
Работает на всех инструментах и таймсериях Трендовый индикатор с осциллятором для входов Мультипериодная панель на всех таймфреймах Подключаемые стрелки при появлении сигналов Три типа уведомлений: push, email, alert
MT4 версия -> ЗДЕСЬ / Наши новости -> ЗДЕСЬ
Как работать:
AW
FREE

Introduction
The Bounce Zone indicator is a cutting-edge non-repainting technical tool built to identify key areas on the price chart where market sentiment is likely to cause a significant price reversal. Using advanced algorithms and historical price data analysis, this indicator pinpoints potential bounce zones. Combined with other entry signal, this indicator can help forex traders place the best trades possible
Signal
A possible buy signal is generated when price is in the green zone an
FREE

Индикатор очень точно определяет уровни возможного окончания тренда и фиксации профита. Метод определения уровней основан на идеях В.Д.Ганна (W.D.Gann), с использованием алгоритма, разработанного его последователем Кириллом Боровским. Чрезвычайно высокая достоверность достижения уровней (по словам К.Боровского – 80-90%) Незаменим для любой торговой стратегии – каждому трейдеру необходимо определить точку выхода из рынка! Точно определяет цели на любых таймфремах и любых инструментах (форекс, ме

Introducing Indicator for PainX and GainX Indices Traders on Weltrade Get ready to experience the power of trading with our indicator, specifically designed for Weltrade broker's PainX and GainX Indices. Advanced Strategies for Unbeatable Insights Our indicator employs sophisticated strategies to analyze market trends, pinpointing optimal entry and exit points. Optimized for Maximum Performance To ensure optimal results, our indicator is carefully calibrated for 5-minute timeframe charts on

Dark Support Resistance is an Indicator for intraday trading. This Indicator is programmed to identify Support and Resistance Lines , providing a high level of accuracy and reliability.
Key benefits
Easily visible lines Only the most important levels will be displayed Automated adjustment for each timeframe and instrument Easy to use even for beginners Never repaints, never backpaints, Not Lag 100% compatible with Expert Advisor development All types of alerts available: Pop-up, Email, Push

INTRODUCTION TO GPT SPIKES INDICATOR The GPT Spikes Indicator is a revolutionary trading tool specifically engineered for the Boom and Crash markets on the Deriv platform. It leverages cutting-edge algorithms to provide traders with precise market insights, helping them to detect market spikes and reversal points with unparalleled accuracy. Whether you're new to trading or an experienced professional, the GPT Spikes Indicator offers the precision and customization you need to succeed in the vola

Ищете качественный индикатор точек разворота? Значит, PZ Pivot Points - это то, что вам нужно! Он строит уровни не только за текущий день. Он строит исторические уровни для проведения тестирования на истории Вы сами выбираете таймфрейм Цвета и размеры настраиваются
Что такое "точки разворота"? Анализ точек разворота зачастую применяется совместно с расчетом уровней поддержки и сопротивления, как и в случае с анализом трендовых линий. При анализе точек разворота первые уровни поддержки и сопроти
Индикатор Order Flow Balance - это мощный инструмент для чтения ленты (Time & Sales). Он помогает анализировать поток ордеров на рынке, определять движения игроков, рыночный дисбаланс, возможные точки разворота и многое другое! Индикатор работает на MOEX, BM&FBOVESPA, CME и т. Д. Есть 5 различных типа индикатора Cumulative Delta: Также известен как индикатор кумулятивного объема Cumulative Volume Delta, это продвинутый способ анализа объемов, позволяющий трейдерам наблюдать дневную разницу между

Introduction
Reversal Candles is a cutting-edge non-repainting forex indicator designed to predict price reversals with remarkable accuracy through a sophisticated combination of signals.
Signal Buy when the last closed candle has a darker color (customizable) and an up arrow is painted below it Sell when the last closed candle has a darker color (customizable) and a down arrow is painted above it
FREE
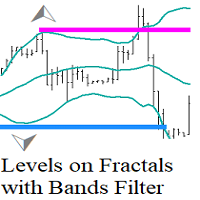
Levels on Fractals with Bands Filter - это уровни на основе фракталов отфильтрованные с помощью индикатора Bollinger Bands. Индикатор уровней, основанный на фракталах Билла Вильямса, отфильтрованных с помощью Линий Боллинджера, представляет собой инструмент технического анализа, который использует комбинацию фракталов и индикатора Боллинджера для определения уровней поддержки и сопротивления. Как использовать?
Когда фрактал образуется за внешней лентой Боллинджера (пробой волатильности) это
FREE
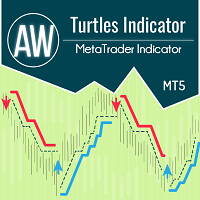
Индикатор работает по системе Черепах и классически предполагает временной интервал 20 и 55 свеч. На заданном временном интервале отслеживается тренд. Вход осуществляется в момент пробоя уровня поддержки или сопротивления. Сигнал выхода – пробой цены в обратном направлении тренда того же временного интервала. Преимущества:
Инструменты: Валютные пары, акции, сырьевые товары, индексы, криптовалюты Таймфрейм: Классически D1, также подходит для работы с любыми таймфреймами Время торговли: круглосу
FREE
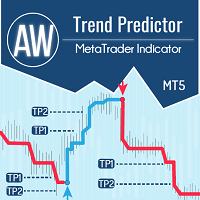
Сочетание тренда и пробоя уровней в одной системе. Продвинутый алгоритм индикатора фильтрует рыночный шум, определяет тренд, точки входа, а также возможные уровни выхода из позиции. Сигналы индикатора записываются в статистический модуль, который позволяет выбирать наиболее подходящие инструменты, показывая эффективность истории сигналов. Индикатор рассчитывает отметки ТейкПрофитов и стоплосса. Руководство пользователя -> ЗДЕСЬ / MT4 версия -> ЗДЕСЬ Как торговать с индикатором: Торговля с Tr

Magic Channel Scalper is a channel indicator for the MetaTrader 5 terminal. This indicator allows finding the most probable trend reversal points. Unlike most channel indicators, Magic Channel Scalper does not redraw. The alert system (alerts, email and push notifications) will help you to simultaneously monitor multiple trading instruments. Attach the indicator to a chart, and the alert will trigger once a signal emerges. With our alerting system, you will never miss a single position opening

Модель «чашка и ручка» - это техническая форма цены, которая напоминает чашку и ручку, где чашка имеет форму буквы «U», а ручка имеет небольшой дрейф вниз. Правая сторона рисунка - ручка - меньше, чем левая сторона - чашка, и отступает не более, чем на 50% от вершины. Это может быть как продолжение, так и разворотный паттерн. [ Руководство по установке | Руководство по обновлению | Устранение неполадок | FAQ | Все продукты ] Четкие торговые сигналы Настраиваемые цвета и размеры Реализует статист

Индикатор Trend Forecaster использует уникальный авторский алгоритм для определения точек входа в сделку по пробойной стратегии. Индикатор определяет ценовые скопления и анализирует движение цены возле уровней и показывает сигнал, когда цена пробивает уровень. Индикатор Trend Forecaster подходит для любых финансовых активов: валюты (Форекс), металлы, акции, индексы, криптовалюты. Также индикатор можно настроить для работы на любых тайм-фреймах, однако в качестве рабочего тайм-фрейма все же реком

Detailed Description:
The Pivot Points Indicator is designed for traders who rely on pivot points, midpoints and support/resistance levels for their trading strategies. By automatically calculating and plotting these levels (based on the previous period's high, low, and close prices) , the indicator provides a clear, visual representation of critical price areas where the market may reverse or break out.The tool is particularly useful for day traders and swing traders looking to base th
FREE

Max Min Delta Indicator Gain Deeper Insights into Market Volume Imbalance with Delta Analysis What is the Max Min Delta Indicator?
The Max Min Delta Indicator is a powerful market volume analysis tool that visually represents maximum and minimum delta values using a histogram. It helps traders identify market strength, weakness, absorption, and aggressive buying/selling activity with precision. Key Features:
Histogram Visualization: Displays Max Delta (Green) and Min Delta (Red) as
MetaTrader Маркет - единственный магазин, где можно скачать демоверсию торгового робота и подвергнуть его проверке и даже оптимизации на исторических данных.
Прочитайте описание и отзывы других покупателей на заинтересовавший вас продукт, скачайте его прямо в терминал и узнайте, как протестировать торгового робота перед покупкой. Только у нас вы можете получить представление о программе, не заплатив за неё.
Вы упускаете торговые возможности:
- Бесплатные приложения для трейдинга
- 8 000+ сигналов для копирования
- Экономические новости для анализа финансовых рынков
Регистрация
Вход
Если у вас нет учетной записи, зарегистрируйтесь
Для авторизации и пользования сайтом MQL5.com необходимо разрешить использование файлов Сookie.
Пожалуйста, включите в вашем браузере данную настройку, иначе вы не сможете авторизоваться.