Смотри обучающее видео по маркету на YouTube
Как купить торгового робота или индикатор
Запусти робота на
виртуальном хостинге
виртуальном хостинге
Протестируй индикатор/робота перед покупкой
Хочешь зарабатывать в Маркете?
Как подать продукт, чтобы его покупали
Технические индикаторы для MetaTrader 5 - 47

The Vortex Indicator was first presented by Douglas Siepman and Etienne Botes in January 2010 edition of Technical Analysis of Stocks & Commodities. Despite its based on a complex implosion phenomenon, the vortex is quite simple to interpret. A bullish signal is generated when +VI line cross above the -VI line and vice versa. The indicator is mostly used as a confirmation for trend trading strategies. The Vortex was inspired by the work of Viktor Schauberger, who studied the flow of water in tur
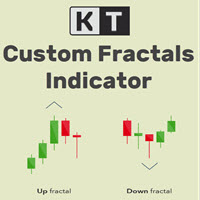
KT Custom Fractals is a personal implementation of the Fractal indicator first introduced by Bill Williams. With KT Custom Fractals you can choose a custom number of bars to allow to the left and right side of the fractal. For example, you can display the fractals that have "three" successive bars with the highest high in the middle and one lower high on both sides , or you can display the fractals that have "Eleven" consecutive bars with the lowest low in the middle and five higher lows on bot

KT Fractal Channel Breakout draws a continuous channel by connecting the successive Up and Down fractals. It provides alerts and also plots the Up and Down arrows representing the bullish and bearish breakout of the fractal channel.
Features
If you use Bill Williams fractals in your technical analysis, you must also include it in your trading arsenal. It can be very effective and useful for stop-loss trailing. A new market trend often emerges after a fractal channel breakout in a new directi

KT Forex Volume shows the buying and selling volume of a currency pair in the form of a colored histogram. The volume is made of buying and selling transactions in an asset. In FX market: If the buying volume gets bigger than the selling volume, the price of a currency pair would go up. If the selling volume gets bigger than the buying volume, the price of a currency pair would go down.
Features Avoid the bad trades by confirming them using the tick volume data. It helps you to stay on the si
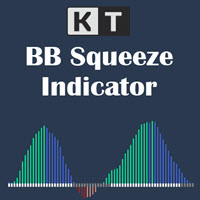
KT BB Squeeze measures the contraction and expansion of market volatility with a momentum oscillator, which can be used to decide a trading direction. It measures the squeeze in volatility by deducing the relationship between the Bollinger Bands and Keltner channels. Buy Trade: A white dot after the series of gray dots + Rising momentum above the zero line.
Sell Trade: A white dot after the series of gray dots + Rising momentum below the zero line. Markets tend to move from a period of low vol

Indicator and Expert Adviser EA Available in the comments section of this product. Download with Indicator must have indicator installed for EA to work.
Mt5 indicator alerts for bollinger band and envelope extremes occurring at the same time. Buy signal alerts occur when A bullish candle has formed below both the lower bollinger band and the lower envelope Bar must open and close below both these indicators. Sell signal occur when A bear bar is formed above the upper bollinger band and upp

Vix 75 and Boom Sniper Entry
= Assistance for Non Beginners traders = Market Structure is KEY =Trading is a Risk ... Know what you are entering into when starting your trading journey
Basically the indicator gives signals due to reach of Support and Resistance, it also give signals on touch of order block. Works Best on Gold and Eurusd and Synthetic Index - its best give accurate confluences with a TDI
TDI settings: RSI Period -10 Bollinger Bands - Period 34 - First indicators Dat

Индикатор реализует авторский подход к построению популярного индикатора "Зиг-Заг".
Преимущества "ZIg Zag Level" индикатора в том, что он отсеивает рыночный шум и показывает уровни.
"ZIg Zag Level" строится по пикам и впадинам, отображает уровни.
Эти уровни можно отключать и настраивать.
Индикатор отображает цену уровня, ценовую метку можно отключить.
Линию "зиг-заг" между точками также можно отключить.
Индикатор имеет встроенную систему оповещений.
Настройки: History_Size - ра

Индикатор True Supply and Demand - позволит вам быстро определить расположение уровней сопротивления и поддержки на всех ТФ. Индикатор будет полезен тем кто использует технический анализ в своей торговле. Индикатор прост в использовании, просто перетащите на график и индикатор покажет вам наиболее вероятные уровни поддержки и сопротивления. При переключении ТФ, вы будете видеть уровни для вновь выбранного ТФ.
Рекомендуемый Робот Скальпер - протестировать .
Входные параметры Use_p

Configure scaffolding charts and signals based on the scissor pattern, which works great at low times.
Buy and sell signs based on 2 previous candle patterns
It works on the active time form, and when detecting the pattern in 4 time frames, 5 minutes, 15 minutes, 30 minutes and one hour, the alert can be set to notify us of the formation of this pattern.
MetaTrader version 4 click here
How to use:
When there is an opportunity to buy or sell, the marker places a scissors mark on

Only 5 copies of the EA at $30! Next price --> $45 Find charts and signals based on harmonic patterns, which work great in 1-hour timeframes and up.
Buy and sell signs based on different harmonic patterns as follows:
0: ABC_D
1: ABCD_E
2: 3Drive
3: 5_0
4: Gartley
5: Bat
6: Crab
7: Butterfly
8: Cypher
9: NenStar
10: Shark
11: AntiBat
12: AntiGartley
13: AntiCrab
14: AntiButterfly
15: AntiCypher
16: AntiNenStar
17: AntiShark
How to use:
When there is an opportunity to
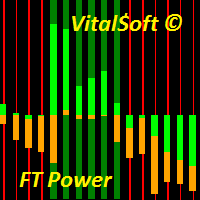
Индикаторная система FT Power предназначена для определения направления тренда ценового графика. Состоит из двух гистограмм. Центральная гистограмма Bull/Bear Power определяет преобладание силы быков или медведей. В моменты, когда значение индикатора выше нулевой отметки, Bull/Bear Power показывает, что «быки» сильны, а когда гистограмма становится ниже 0, то «быки» выбиваются из сил и дальнейший рост становится сомнительным. Основная гисторгамма служит для определения трендовых либо флетовых уч
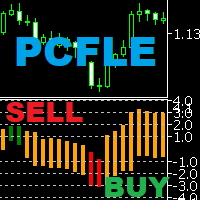
PCFLE Histogram (Price Change From the Last Extreme) - plots the percentage movement from the last extreme. Can be used for graphical representation of percentage movement from last lowest low to current high / from last highest high to current low. Input parametters: InpDigits - the number of decimal places displayed on the y-axis You can set colors and horizontal levels in the indicator properties. Examples of how to trade with the indicator can be found in screenshots.

Выделяет торговые сессии на графике
Платная версия продукта Trading Sessions Indicator Free с возможностью пользовательской настройки начала/окончания сессий.
Trading Sessions Indicator (Индикатор торговых сессий) отображает начало и окончание каждой торговой сессии.
[ОПЦИИ:] Asian session Open Asian session Close Asian session OpenSummertime Asian session CloseSummertime European session Open European session Close European session Open European session Close Timeshift
Для лучших резу

This indicator is the advanced edition of WRP&KD support resistance designed according to the combination of WPR, Stoch, RSI, CCI, and tick volume indicators. You can add other timeframe's support and resistance on the current chart. When WPR, Stoch, RSI, CCI goes up the same time quickly and the volume become larger, the price may meet strong resistance, many times short order will take profit, but if the price break through it, Long positions are more likely to be profitable, and the

RSI Scanner is a multi symbol multi timeframe RSI dashboard that monitors Relative Strength Index indicator for price entering and exiting overbought and oversold in up to 28 symbols and 9 timeframes.
Download Demo here (Scans only M1, M5 and M10) Settings description here MT4 version here
RSI Scanner features: Signals RSI entering and exiting the overbought and oversold zones. Monitors 28 customizable instruments and 9 timeframes at the same time. Supports all 21 timeframes of Metatra

its not just an Indicator. its a trading system I'm working on for 3 years and also would be updated you don't need any thing else to trade because its a price action indicator that shows all static and dynamic support and resistance this indicator contains 7 lines that gives us dynamic support and resistance also when main lines (white ones) become flat for 26-52 periods they show strong levels. you can find consolidating areas, strong downtrend(in Green channel) and strong uptrend(in Red Chan
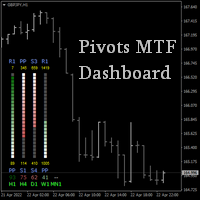
Если Вы торгуете по уровням, то этот индикатор для Вас.
Индикатор отображает уровни поддержки и сопротивления для выбранных таймфремов, дополнительно показывая сколько пунктов до ближайших уровней, а также между какими уровнями находится текущая цена в виде цветной шкалы и процентов.
Расположение в любом месте на чарте, возможность масштабирования, смещение расчёта с учётом часовой разницы Вашего брокера, выбор цветовой гаммы и прочие параметры позволят настроить индикатор на Ваше усмотрени

KT Higher High Lower Low marks the following swing points with their respective S/R levels: Higher High: The swing high made by the price that is higher than the previous high. Lower High: The swing high made by the price that is lower than the previous high. Lower Low: The swing low made by the price that is lower than the previous low. Higher Low: The swing low made by the price that is higher than the previous low.
Features The intensity of swing high and swing low can be adjusted by cha

Ayuda a interpretar la tendencia del precio de mercado de acuerdo a las mediciones en tiempo real, ideal para reforzar los resultados mostrados por el RSI las bandas de Bollinguer. Recuerde que el mercado de instrumentos financieros es altamente volatil, no opere con dinero que ponga en riesgo su estabilidad financiera. Solo use fondos que este dispuesto a perder. Resultados pasados no garantizan resultados futuros. Mantenga Siempre control sobre el riesgo.

The Market Sessions Indicator for MT5 helps you predict market turnarounds by detecting major supply and demand areas. These pivot points tend to occur after a new session has started and the previous one is still open. It is also used to gauge how many points or pips the market moves on average during a session. This helps us to place better our take profits and stop losses. The indicator works on all forex pairs, gold, silver, commodities, stocks, indices and any other instrument that yo

Trend Entry Indicator Your Trading will Be easier with this indicator!!! This Indicator is Developed To make our trading life easier. Get an Arrow for Entry with Take Profit and Slop Loss marks on chart. - Indicator is Based on trend, because thats what we all want we want to follow the trend "it's our friend". - Based on Levels, price action and oscillators. - It works on all currency pairs, all indices, metals and stock. - it works on all pairs/indexes on Deriv including Boom and Crash. - Tim
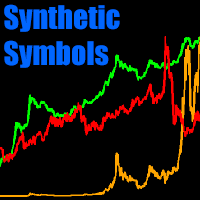
Выполняйте любую операцию между вашими терминальными символами (или вашими пользовательскими) для создания пользовательских синтетических символов : логарифмические шкалы, относительные показатели (акции против SP500, золото против серебра...), валютные индексы... возможности безграничны! Вы можете выполнять любую математическую операцию между символами и константами свеча за свечой. Включены функции для получения минимума [min(a,b)] или максимума [max(a,b)] между двумя значениями и квадратн

ПОКАЗАТЕЛЬ ДЛЯ КАЖДОГО Pip Scalper предназначен для скальпинга трендов. Оставайтесь в тренде дольше с этим индикатором. Работает на всех таймфреймах и активах. Собирайте ежедневные пипсы с помощью этого инструмента. Используйте скользящую среднюю 200 для фильтрации сделок. Рекомендуется использовать меньшие таймфреймы. Используйте для дневной торговли.
О и как использовать:
Pips Scalper основан на долгосрочной торговле по тренду. Купить на синем Продать на красном Используйте скользящую

Description Price action patterns detection that can work as triggers in any trading strategy, It include Flag, Flag Top, Flag 1234, and micro pullback patterns Support: We create great tools for the entire trading community. Most of them are free. If you believe in what we do Support Us Here. How is this indicator useful? You can use the indicator signals as a trigger to entry in the market and complement any trading strategy. Components Note 1: This indicator should only be considered a
You can identify the strength of the main forex currencies with this tool. You can combine it with different styles and get the best strategy out of it. It has very high power. It can be customized.
MT4 version
This indicator will have many updates and special settings will be added to it.
You can contact us via Instagram, Telegram, WhatsApp, email or here. We are ready to answer you.
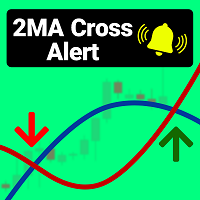
This indicator setup two Moving Average indicators and when the smaller Moving Average (2) crosses the larger one (1) , you will be notified by Popup alert, mobile notification, or Email.
If your strategy works with two Moving Average indicators, you do not need anymore to constantly and tediously look at the chart. You should just add this indicator to the chart according to your required settings, and whenever the defined cross (up or down) is done, it notifies you and you wouldn't miss the
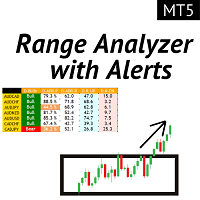
Индикатор Range Analyzer показывает средний диапазон пипсов валютной пары, измеренный за определенное количество периодов. Трейдеры могут использовать ADR для визуализации потенциального движения цены за пределами среднего дневного движения. Когда ADR выше среднего, это означает, что дневная волатильность выше, чем обычно, что означает, что валютная пара может выходить за пределы своей нормы. Наш анализатор ADR состоит из 5 основных функций: Range (ADR) Screener: мультивалютный анализ ADR. Зон

AUTO MIDAS VWAP Volume Weighted Average Price (VWAP) is a trading benchmark commonly used by Big Players that gives the average price a Symbol has traded throughout the day. It is based on both Volume and price.
Commonly, MIDAS VWAP damand you to determine the initial point of analysis. This indicator plots automatically based on ZigZag Approach.
You will be able to use up to 3 HIGH MIDAS VWAP's and 3 LOW MIDAS VWAP's.
Wish the best trade results!!
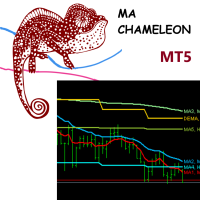
This indicator was developed by me, based on my experiences during my long term daily trading. It allows to get an excellent and compact overview about the current market situation without to have to monitor multiple charts. The default settings are widely used by traders. For example on sites like forexlive.com: https://www.forexlive.com/technical-analysis Features: The Moving Average Swiss Knife-like indicator for Daytraders Allows to setup of up to seven different MAs (MA and DEMA) to use on

The Market Sessions Indicator for MT5 helps you predict market turnarounds by detecting major supply and demand areas. These pivot points tend to occur after a new session has started and the previous one is still open. It is also used to gauge how many points or pips the market moves on average during a session. This helps us to place better our take profits and stop losses. The indicator works on all forex pairs, gold, silver, commodities, stocks, indices and any other instrument that your

Description: The Multi POC displays multiple Point Of Controls on one chart. This Indicator is also already included in the "VolumeProfile" Indicator .
Features: Customizable Range POC Customizable section POCs with VAL&VAH lines Works on all timeframes Drag & Drop for live calculation
Support: The indicator is constantly being developed and improved. Please do not hesitate to contact me via the MQL5 Platform. I am very grateful about any Bug report, so that i can constantly improve the ind

The best Vwap Midas coding for Metatrader 5 you can find in White Trader indicators.
The indicator has been optimized not to recalculate (improving performance) and has several visual settings for you to adapt in your own way. TRY IT FOR FREE by clicking the free demo button Where and why to use Vwap Midas (and Auto Zig Vwap Midas) can be used on a variety of indices, currencies, forex, cryptocurrencies, stocks, indices and commodities.
Many successful traders use price and volume to ge
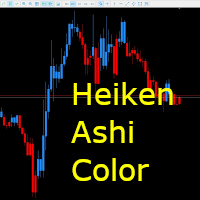
Change the timeframe of a subchart in bulk Change the scale of a subchart in bulk
Reflect only the color of the average bar on the chart
Display the high and low prices of the previous month, the previous week, and the previous day
Indicator.
When the average bar is displayed, it will be difficult to see the chart pattern by all means, so only the color is reflected. This makes it difficult to overlook the shape of candlesticks, such as pin bars and reversals.
It can be recommended f
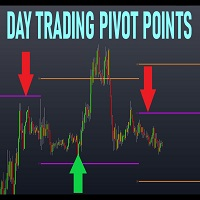
Новичок или эксперт, наша первоклассная многопрофильная система Turn Prof улучшит ваш обмен и предоставит вам удивительные открытые двери обмена с уровнями помощи и препятствий, которые используют эксперты.
Обмен оборотов — это простой и убедительный метод входа и выхода из рынка на ключевых уровнях, который используется экспертами в течение довольно долгого времени и устраняет все изображения: Forex, Crypto, Stocks, Indicies и так далее.
Turn Prof предоставляет брокеру премиальные уровни,
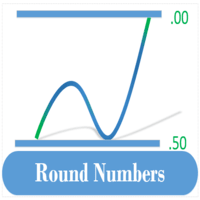
The Round Number Drawer is an indicator that automatically draw lines or zones at the psychological levels (00 or 50) as the market moves. New lines are drawn as the market moves while the old lines are deleted. This ensures that your chart is clutter-free. The user specifies the number of lines preferred on the chat, and the indicator keeps the number of lines constant. The indicator plots two types of levels, the Main Level (00 levels e.g. USDCAD 1.33000, 1.34000) and the Sub Level (50 levels

!! FLASH SALE !! Over 80% off !! For ONE week only. Now only $47 - normally $297!
Buy And Sell Arrows On The Chart When The Trend Is About To Continue. Sends Alerts – On MT5 To Your Phone To Your Email.
Does not repaint.
Works on any pair, any timeframe. (Just ajust the settings for your pair and timeframe.)
10 Activations allowed so you are free from limitations
See an example of alerts from today (23 May 2020) using this and 2 other indicators here .
MT4 version here.

!! FLASH SALE !! Over 80% off !! For ONE week only. Now only $47 - normally $297! >>> Ends on 30 June 2023 - Don't miss it!
The Consolidation Breakout Alerts Indicator will revolutionize your trading strategy. Our innovative indicator offers unique buy and sell arrows when price breaks out from consolidation, allowing you to get in at the most optimal entry with minimal risk and maximum reward potential. Never again will you miss out on the lucrative trading opportunities available
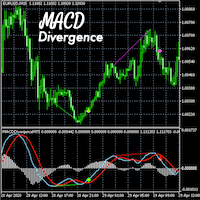
MACD Divergence Detector MT5
- Non-repainting - Live divergence detection - Accurate MACD indicator - Includes 10 indicator buffers - EA friendly - Includes useful customizable settings - Decide which buffers to display on the chart and their colors
The MACD Divergence Detector for MT5 is an accurate and useful tool for detecting and displaying MACD divergences and good places to take long and short trades. It includes 10 buffers and customizable settings. This tool does not repaint and ca
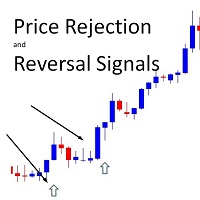
!! FLASH SALE !! Over 80% off !! For ONE week only. Now only $47 - normally $297! >>> Ends on 30 June 2023 - Don't miss it!
Buy And Sell Signal Arrows On The Chart When The Price Is About To Reverse. Also Sends Alerts –On MT5 To Your Phone To Your Email.
Does not repaint.
Works on any pair, any timeframe. (Just ajust the settings for your pair and timeframe.)
10 Activations allowed so you are free from limitations
MT4 version here .
Spreads from 0.1pip RAW/ECN Acco

Do you, like me, like to trade with the trend? Then this indicator will help you! Rainbow Trend is a trend indicator, which uses several Moving Averages on the chart.
It measures different trend strenght zones for different periods: very long term, long term, mid term, short term and very short term.
Each zone has its color, and it is possible to have sound alert when the prices leaves a zone and enters another.
Its configuration is very simple. If you find any bug or have any suggestions, co
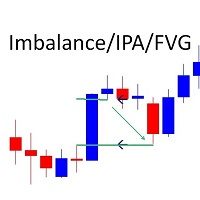
!! FLASH SALE !! Over 80% off !! For ONE week only. Now only $47 - normally $297! >>> Ends on 30 June 2023 - Don't miss it!
Marks Market I mbalance / Improper Price Action / Fair Value Gaps on The Chart As traders continue to search for the best trading indicators to guide their investments, the I mbalance / I mproper P rice A ction / F air V alue G ap I ndicator has become increasingly popular. This indicator helps to identify opportunities for taking profit . The indicator begins
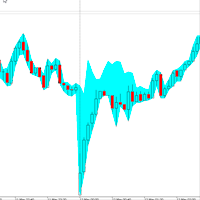
Александр Сергеевич Рыжков, [12.05.2022 7:02] SWI - Spread Widening Indicator.
Индикатор расширения спреда - должен быть в арсенале каждого опытного пользователя платформы Meta Trader.
Данный индикатор позволяет анализировать, аномальные ночные и новостные расширения спредов,
с помощью чего дополнительно максимизировать свою прибыль и снизить свои риски.
Для использования необходимо просто установить на график и подобрать цвет подходящий под ваш график.

MACD with fast and slow EMA. Moving average convergence divergence (MACD) is a trend-following momentum indicator that shows the relationship between two moving averages of a security's price . The MACD is calculated by subtracting the fast-period exponential moving average (EMA) from the slow-period EMA. Setup options: Fast EMA period Slow EMA period Signal EMA period Applied price Indicator window height Color MACD Color Signal Color Histogram
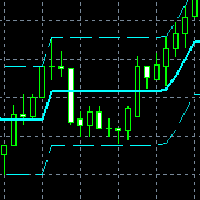
It is a new indicator that frames the price movement and tracks it. It consists of oscillation channel and its center line CL . For its calculation it is only necessary to introduce the amplitude of the channel. Because of this, it is a non-lagging indicator as it is not calculated based on a number of previous candlesticks. It removes any level of noise , showing the underlying price movement cleanly via the center line . It allows you to easily identify the beginnings a
MT4 Version A versatile tool
You do not need any other tools with this tool.
You can enable or disable all indicators.
Their values are adjustable.
In the first line you will see a summary of your account status.
p: The amount of your profit or loss
BP: The amount of your daily profit based on the balance
EP: Equity daily earnings
WP: Your weekly profit
MP: Your monthly profit
The next line shows each of the time frames you selected.
Chikou: The Chikou process
KT: The trend of t
Average Daily Range with factor target and more functions (ADR)
Hello traders,
The upgraded ADR dashboard now is also for MT5 much more better and more convenient for day trader, try it to experience the good things!
How to use Average Daily Range (ADR) Indicator?
ADR is just a simple indicator tool to help trader identify the daily average range of an instrument. So for example we have the pairs EURUSD and that pairs usually makes a peak and bottom during the trading day an

У каждого индикатора есть свои достоинства и недостатки. Трендовые показывают хорошие сигналы во время тренда, но запаздывают во время флэта. Флэтовые прекрасно себя чувствуют во флэте, но при наступлении тренда сразу же умирают. Все это не было бы проблемой, если было бы просто предсказать, когда тренд сменится флэтом, а флэт сменится трендом, но на практике это крайне серьезная задача. Что если разработать такой алгоритм, который сможет в индикаторе устранить недостатки и усилить его достоинст

The most sensitive indicator you've ever seen! And now with Alerts
POscillator Alert is a sensitive indicator that finds each trend direction change in every timeframe and then notifies you with the necessary alarms. It's a new version of the POscillator Indicator, with the addition of its alarm sending capability. The Indicator can send multiple alerts: email, mobile phone notification, alert window and alert sound. All of these different alarms are optional and you can choose the ones you
Предупреждение о тренде на нескольких таймфреймах
I. Обзор
Анализ трендов в реальном времени на девяти таймфреймах (M1, M5, M15, M30, H1, H4, D1, W1, MN1) на основе расчета максимумов и минимумов с использованием свинговых максимумов и минимумов и теории Доу. Индикатор посылает уведомления (алерты) при совпадении трендов указанных временных рамок.
II. Преимущество
Поскольку данный индикатор уведомляет вас при совпадении тренда, вы можете использовать торговые возможности, не задерживаяс

New Trend Alerts finds new trends at the changing bar very quickly. If the trend has enough power and a quality up/down angle, then the indicator sends multiple alarms to alert you: via email, mobile notification, alert window and alert sound. All of these different alarms are optional, and you can choose which ones you would like to use. The indicator calculates the derivative of the price chart to reveal the slope of price curve and its sign changes. Red bars indicate a positive sign or uptre

///XShea///
На основе логики индикатора (MFI) применительно к пересечениям уровней. только скальпинг
После нескольких месяцев тестирования и применения на реальном счете я решил сделать доступным
покупателей этот ценный инструмент, с помощью которого при соблюдении соответствующих правил
Вы сможете получать очень хорошую прибыль на своих счетах форекс.
Этот индикатор запрограммирован на отправку звуковых оповещени

CHART OBJECTS: Blue box : Bullish Order Blocks (OB) Red box : Bearish OB Orange box : Mitigated OB. Price bounce from this area the made a new high/low Light gray box : Price bounced from this area but did not made a new high/low Dark gray box : Broken OB. Filled boxes : TimeFrame 1 Order Blocks
Unfilled boxes : TimeFrame 2 Order Blocks
INDICATOR SETTINGS: Order Block Required Length: Required number of subsequent candles in the same direction to identify Order Block. Default value: 5 Im

Basato sull'indicatore RSI aiuta a capire quando il trend sta cambiando in base ai periodi impostati. E' possibile impostare intervalli di tempo personalizzati e colori delle frecce. Segui l'andamento e valuta anche in base alla volatilità dell'asset. Funziona con ogni coppia di valuta ed è da considerare come un'aiuto ad una valutazione. Puoi associarlo con altri indicatori.
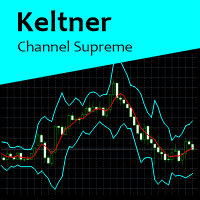
Keltner Channel Supreme is a indicator based on Keltner Channels, with some configuration besides period and Keltner multiplier factor. In this indicator, it is possible to change to an exponential moving average and if prices will be calculated according to close price or typical price. This indicator works on all graphics. If you have some doubt, please PM.
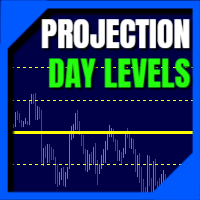
Daily Projection Levels , as the name implies, is an indicator that project the price changes in percentage above and below the opening of the day (or closing of the previous day.
These are "psychological" support and resistance areas where price tries to retrace or break out.
With this you have a powerful tool to predict what these zones will be! You can define which projection levels you want (up to 5 above and below), in addition to have alert messages and visual customization. If you want

Donchian Channel DC is the indicator of Donchian Channels, that plots maximum and minimum values of a specific period, besides mean value line. It´s possible to configure simple period for analysis and the indicator will plot all three values. You can trade with this indicator as trend or reversal, according to each strategy. Do not let to test others indicators as soon as others expert advisors.

Здравый смысл в наблюдении за ценой Покупайте, когда цены растут, и продавайте, когда цены падают Приведенное выше утверждение о покупке, когда цены растут, или продаже, когда цены падают, может быть слишком общим, и поэтому для него могут потребоваться некоторые рекомендации и правила, и именно здесь в игру вступают 3 утки.
Индикатор Price Average Mt5 поможет вам определить возможности покупки в направлении последнего восходящего тренда и возможности продажи в направлении последнего нисходящ
Для расчета весовых коэффициентов этого фильтра используется гипергеометрический ряд. Такой подход позволяет получить довольно интересное сглаживание временного ряда. Весовые коэффициенты гипергеометрического фильтра затухают не так быстро, как у экспоненциальной и линейно-взвешенной скользящих средних, но быстрее чем у сглаженной скользящей средней. Благодаря этому поведение этого фильтра во многом схоже с поведением скользящих средних. Однако у него есть несколько достоинств. Его запаздывание
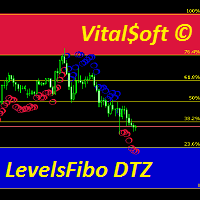
Комбинированный индикатор LevelsFib DTZ помогает определить направление тренда при торговле. Отображает на графике сигналы о возможной предстоящей смене тренда. Индикатор представляет собой комбинацию уровней Фибоначчи с зонами перекупленности и перепроданности и трендовый индикатор на основе индикаторов ZigZag & ATR. Индикатор LevelsFib DTZ помогает трейдерам прогнозировать дальнейшее движение цены и соответствующим образом корректировать свою стратегию. Работает на всех таймфреймах.

VWAP Volume And Price is the indicator for Volume Weighted Average Price, designed according to regular calculation. The average price is calculated using typical price - (high + low + close) / 3 - and weighted by volume for each candle. So, the indicator can be used to trend trades, balanced with volume. Try other products and expert advisors too. Any doubt, PM.

Учитывая разницу торговых сессий, индикатор показывает направление тренда и уровень сопротивления. Все события отмечаются на графике и высылаются оповещения. Используя SessionAlert вы можете спокойно, размеренно торговать. Вам достаточно указать время начала и конца сессий. Индикатор отображает уровень сопротивления, стрелкой указывает событие смены тренда и дополнительно отмечает касание ценой уровня сопротивления.
Принцип работы индикатора очень прост и надёжен:
Если американская сессия зак

Всем привет. Представляю Вашему вниманию Индикатор TRUE ATR. Так же есть данный индикатор для mt4 https://www.mql5.com/ru/market/product/82414 Данный индикатор работает на всех рынках. TRUE ATR высчитывает среднестатистическое движение инструмента за 1 день и показывает сколько в инструменте осталось энергии внутри дня. В отличие от классического индикатора АТР которые без разбора учитывает все бары(свечи), TRUE ATR при расчете среднестатистического движения инструмента использует ближайших 5

The Market Entropy indicator was created to measure the order of price changes over time. consists of two lines and a histogram where the lines are responsible for measuring the price movement and the histogram measures the strength of the analyzed movement. It can be used to find a trend (Image 2) or price reversal (Image 3).
Blue Line: Buy Entropy Red Line: Sell Entropy Historgram: Market Entropy
Interpretation: Buy Line above the Sell Line indicates that in the analyzed period buyers wer

Присоединяйтесь к торговле с индикатором WolfeWaveBuilder! Это уникальный инструмент, созданный специально для получения максимально успешных и прибыльных решений в инвестировании. Он идеально подходит для реальных счетов и предоставляет преимущества от тщательно протестированной и практически гарантированной торговой стратегии. Не пропустите свою возможность! Начните зарабатывать на торговле с индикатором WolfeWaveBuilder! MT4 версия https://www.mql5.com/ru/market/product/8920
Возможности ин

Market Conditions indicators can provide support to the trader so that he can identify market trends over a given period. The purpose of this model is to allow traders to have a global vision on the exchange markets. And the formula that we develop allow to scan the major currencies in the exchange market. The model uses a purely statistical formula which is based on the historical data of the major currencies "eur, usd, gbp, jpy, aud, nzd, cad, chd". Of which 28 currency pairs are traded. It

ROC Price Histogram Alert — это технический индикатор, основанный на моментуме, который измеряет процентное изменение цены между текущей ценой и ценой определенное количество периодов назад. ROC строится с гистограммой против нуля, при этом индикатор движется вверх на положительную территорию, если изменения цены идут вверх, и перемещается на отрицательную территорию, если изменения цены идут вниз.
Основным шагом в расчете периода ROC является настройка ввода «расчетный период». Краткосрочные

Индикатор TickCounter осуществляет подсчет тиков вверх и вниз на каждом новом баре. Подсчет начинается с момента установки индикатора на график. Столбики гистограммы отображают: Желтые столбики - общее количество тиков; Синие столбики - тики ВВЕРХ; Красные столбики - тики ВНИЗ. Если синий столбик не виден, значит тиков вниз больше и красный столбик отображается поверх синего (красный слой выше синего). MT4 version: https://www.mql5.com/en/market/product/82548 Каждая переинициализация ин
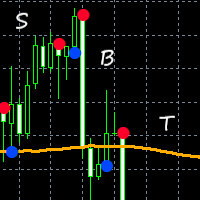
This indicator combines input from two trend filters and the ADX. You can change the trend line on chart to your preference. Great for scalping and channels. Features alert function and parameter TrendLinePeriod.
How to use: Simply attach to any chart. Sell on red bullets, with trend line above price. Enter on bullets closest to this line. Buy on blue bullets, with trend line below price. Enter on bullets closest to this line. Best results when checking the higher time frames before entering t

Ichimoku Trend Finder is a multi symbol multi timeframe trend dashboard that helps traders to monitor and identify potential market trends from one chart. This panel scans the Ichimoku Kinko Hyo indicator in 28 configurable instruments and 9 timeframes for classic Ichimoku trend signals with a deep scan feature to scan all market watch symbols (up to 1000 instruments!).
Download Demo here (Scans only M1 and M6) Settings description here MT4 version here
After the purchase, don't fo
MetaTrader Маркет - торговые роботы и технические индикаторы для трейдеров, доступные прямо в терминале.
Платежная система MQL5.community разработана для сервисов платформы MetaTrader и автоматически доступна всем зарегистрированным пользователям сайта MQL5.com. Ввод и вывод денежных средств возможен с помощью WebMoney, PayPal и банковских карт.
Вы упускаете торговые возможности:
- Бесплатные приложения для трейдинга
- 8 000+ сигналов для копирования
- Экономические новости для анализа финансовых рынков
Регистрация
Вход
Если у вас нет учетной записи, зарегистрируйтесь
Для авторизации и пользования сайтом MQL5.com необходимо разрешить использование файлов Сookie.
Пожалуйста, включите в вашем браузере данную настройку, иначе вы не сможете авторизоваться.