Смотри обучающее видео по маркету на YouTube
Как купить торгового робота или индикатор
Запусти робота на
виртуальном хостинге
виртуальном хостинге
Протестируй индикатор/робота перед покупкой
Хочешь зарабатывать в Маркете?
Как подать продукт, чтобы его покупали
Технические индикаторы для MetaTrader 5 - 27

This is my version of Currency Strength Meter.
One of the best indicators for spotting weak and strong currencies. Based on the information obtained, its very simple to decide which currency buy and which sell.
It is very simple to use, but extremely effective.
General rules are: - Buy currencies above level 0
- Sell currencies below level 0
You can also mix the main currencies together -->
EURUSD > 0 and USDJPY < 0 --> BUY on EURJPY
FREE
This indicator draws a price area in which the volume percentage was traded the day before. The chart shows the days with vertical lines and two horizontal lines to indicate the upper price and the lower price of the percentage of volume was traded the day before. The upper/lower lines start and end with the day calculated. But they are referred with the values of the day before. NOT the day in which are. With this indicator you can see where the volume moved in the day before. It uses percenti
FREE

Smart Trend Line Alert - это профессиональный индикатор трендовых линий, а также линий поддержки/сопротивления с функцией алерта. Он призван помочь трейдерам легко управлять многими графиками и символами без постоянного слежения за монитором.
Особенности Оповещение о пробое свечи, о касании ценовых линий и оповещения по времени; Превращение только что построенной или любой выбранной линии в линию оповещения одним кликом (трендовые и горизонтальные линии или трендовые линии по углу); История оп

MultiFrame Trend Detector: Advanced Forex Trend Analysis Indicator The MultiFrame Trend Detector is a powerful MetaTrader 5 indicator that provides traders with comprehensive trend analysis across multiple timeframes. By dynamically adjusting trend thresholds based on the relationship between timeframes, the MultiFrame Trend Detector delivers reliable and consistent trend detection for all Forex pairs and precious metals. Key Features Custom Timeframe Analysis : Analyze trends across multiple, u
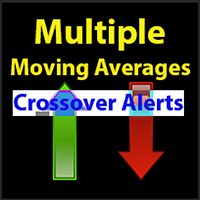
This indicator will identify when Fast Moving Averages (EMA, SMA, or LW) cross Slow Moving Average lines on any timeframe and with any symbol.
When the moving averages cross and price close above or below the crossing, the User will receive an alert via pop-up, push, or email.
Choose any two Moving Averages to cross to receive an alert and the Indicator will also paint the Moving Average Lines and Arrows.
You can choose Exponential Moving Averages (EMA). Simple Moving Averages (SMA) or Lin

Индикатор Commitments of Traders Ratio относится к разряду таких вещей, о которых вы не задумываетесь, пока не увидите чудеса, на которые они способны. Индикатор показывает соотношение количества длинных/коротких позиций в отчете, публикуемом комиссией CFTC раз в неделю.
Если вы посмотрите на скриншот, вы увидите две (три) зоны нашего интереса. Важно: в версии 1.0 недоступны МА.
Зона 1: переключения (красный -> зеленый, зеленый -> красный) Зона 2: пересечение скользящей средней Зона 3: при со
FREE

The purpose of the remaining time indicator on the K-line is to assist traders in gaining a deeper understanding of market dynamics and making more precise trading decisions, particularly in the realm of forex and binary short-term trading. The significance of this indicator and its application to various trading strategies will be thoroughly examined below: Enhancement of Trading Timing Accuracy - Precision: By displaying the remaining time of the current K-line cycle, traders can achieve great
FREE
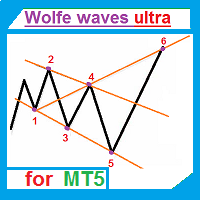
Индикатор рисует волны Вульфа автоматически. В индикаторе используется нахождения волн Вульфа по трём таймфреймам. Данный индикатор является очень точным, поскольку он ожидает прорыва в направлении волны до того, как подать сигнал на совершение торговой операции. Рекомендуемый таймфрей: М1.
Возможности индикатора Торговать удивительно просто. Наш индикатор может распознавать все паттерны волн Вульфа в указанном промежутке периода. Так, мы проверяем каждую вершину на наличие потенциальных точек
Индикатор BWmfi Bar предназначен для работы с системой Билла Вильямса
Индикатор выводит сигналы MFI на график, выделяя свечи, соответствующие сигналам MFI
Вы можете выбрать 4 варианта работы индикатора, задавая соответствующую цифру 1,2,3,4 в настройках, во вкладке "Входные параметры":
Обычный график без сигналов MFI
В этом режиме свечи будут закрашены в цвета столбиков MFI Этот режим применяет в своей торговле Джастин Вильямс - дочь Билла Вильямса. В нём свечи закрашиваются в цвета ин

Новостной индикатор. Показывает учётную ставку 12 стран(Австралия, Бразилия, Канада, Мексика, зона евро, Великобритания, Индия, Новая Зеландия, Швейцария, Соединенные Штаты, Южная Корея, Япония). Поможет проанализировать влияние учётной ставки на курс валют. Устанавливать индикатор имеет смысл на большие таймфреймы. Для улучшения информативности, есть смысл, изменить в настройках стиль индикатора нужной страны, таким образом, чтобы линия выделялась из общей массы индикаторов, как указано на перв
FREE

Synthetic Reverse Bar - индикатор является эволюционным развитием индикатора Reverse Bar . Известно, что свечные паттерны лучше всего работают на старших таймфреймах (H1, H4), однако из-за различия терминального времени у разных брокеров по одному и тому же инструменту свечи на старших таймфреймах могут формироваться по-разному, при том что история котировок на M1 и M5 будет совпадать! Из-за этого удачные паттерны на старших таймфреймах часто просто не формируются! Synthetic Reverse Bar решает д
The Moving Average
( https://www.youtube.com/c/TheMovingAverage/ )
inspired to create All in One 4MA-s with his color setting.
It Put up 4 Smoothed Moving Averages
With Arty chosed colors.
You can modify the settings / Parameters of the indicator
It's easy to use don't have to waist time to set up all 4 MA-s
just put this up.
Hope its helpfull and Arty don't mind it.
You can donate my work here:
https://discotechnika.hu/MQL/PayPal_Donate.jpg
or here
PayPal.Me/HunSkippy
FREE
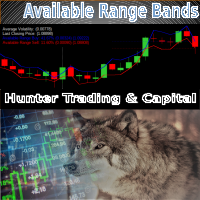
The Available Range Bands Technical Indicator draws two lines on the chart indicating the maximum limits (bands) expected for buying and selling for the current period (candle). These limits can be accessed by buffers 0 and 1 respectively.
In addition, it displays in the lower right corner the current average values of the real volatility, the last price, the predicted range of movement available for buying (% and points) and the predicted range of movement available for selling (% and points
FREE

Этот мощный инструмент предназначен для того, чтобы помочь трейдерам идентифицировать на своих графиках ключевые модели разворота, в том числе фигуры «молот» и «звезда».
С помощью этого индикатора вы можете быстро и легко обнаруживать эти модели по мере их формирования, что позволяет вам совершать хорошо информированные сделки и потенциально увеличивать свою прибыль.
Индикатор Hammer Start настраивается, что позволяет вам устанавливать собственные параметры для выявления паттернов и предупр

ICT Kill zone and Macros Indicator mark and display the following zone times on the chart: Kill zones Kill zone Forex Asian
London Open New York Open London Close Central Bank Dealing range
Kill zone Indices Asian London Open New York AM New York Lunch New York PM Power Hour
Macros London 1 London 2 New York Am 1 New York AM 2 New York Lunch New York PM 1 New York PM 2
Silver bullet London Open New York AM New York PM
Sessions Asian London New York
Chart The display of Kill zone ,
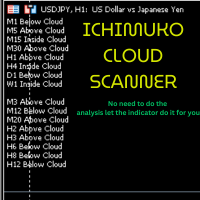
Description of the Ichimoku Cloud Scanner The Ichimoku Cloud Scanner is an advanced MetaTrader 5 (MT5) custom indicator designed to monitor the Ichimoku Cloud system across multiple timeframes and provide visual and audible alerts based on the price's position relative to the Ichimoku Cloud. Here's a detailed description of its features and functionalities: Features: Ichimoku Cloud Calculation : Utilizes the Ichimoku Cloud indicator, which consists of five components: Tenkan-sen (Conversion Lin

This indicator displays the spread Simple and easy to use and fully customisable: View as Pips or Pipettes Chart symbol can be hidden Text display can be changed Change color and text styles Add or hide a decimal point Spacing options between inputs Default screen positions Screen position inputs
How to use 1. Simply use the default settings; or 2. Choose to show pips or pipettes; 3. Choose to display symbol, text or decimal; 4. Choose where to place it on the screen; 5. Save settings or save
FREE

Гистограмма MACD отслеживает разность между главной и сигнальной линиями MACD (первая вычисляется при помощи экспоненциальной скользящей средней ). Для лучшего отображения при выводе линий и гистограммы в одном окне значения гистограммы умножены на 2. Кроме того, растущие и падающие бары гистограммы отображаются различными цветами. В индикаторе MACD Combo реализовано совместное отображение линий индикатора MACD и гистограммы MACD. При помощи одного параметра можно изменять параметры расчета обои

Индикатор ColorLine отображает на графике цены линию (скользящую среднюю). Линия окрашивается по 100 баров тремя различными цветами, при этом каждые 5 тиков цветовавя схема меняется (всего 3 цветовых схемы). Индикатор для демонстрации стиля DRAW_COLOR_LINE . Рисует цветными кусками по 20 баров линию по ценам Close. Толщина,стиль и цвет участков линии меняется случайным. Код индикатора опубликован в MQL5 Документации в разделе Стили индикаторов в примерах
FREE

Индикатор вычисляет профили объёма динамически и выводит результат в виде кривых VAL, VAH и POC.
Особенности работы индикатора Индикатор использует для вычислений исторические данные младших (относительно текущего) таймфреймов: M1 - для таймфреймов до H1, M5 - для таймфрейма H1, M15 - для таймфрейма H4, H1 - для таймфрейма D1, H4 - для таймфрейма W1, D1 - для таймфрейма MN. Цвет участков кривой DPOC определяется в совокупном сравнении объёма уровней POC всех профилей, входящих в состав этой к

Индикатор отображает по-барно дельту и кумулятивную дельту на основании данных о сделках ленты "Time & Sales". В дополнение к стандартным таймфреймам индикатор отображает данные относительно секундных таймфреймов (S5, S10, S15, S20, S30) на выбор. С помощью прямоугольника выделяется произвольная область в подокне индикатора для просмотра соотношения объёмов сделок покупок и продаж внутри данной области.
Особенности работы индикатора:
Индикатор работает корректно только на тех торговых символ

C300 SYNTHETIC INDICATOR 1MIN CHART Update V2 No repaint
*The indicator will not give a sell sign if the market conditions are not in place. *With all 3 strategy criteria in place the strategy based indicator signals 1-3 trades per day. *The drawdown can range to very high you need to place your own target profit and stop loss according to your risk management system . *The indicator is designed for only C300 and the 1min chart .
NB :Note this strategy based indicator will be free only f

Простейший индикатор для ручной торговли. Для комфортной торговли так же имеется эксперт https://www.mql5.com/ru/market/product/41133
Суть идикатора: уровни строяться на основе Moving Average с выбранным периодом по ценам High и Low. На разнице между High и Low строятся следующие уровни выше и ниже. В случае если бар не выходит за уровни, помечается зеленой меткой. Данную метку и уровни можно использовать для выставления отложенных ордеров когда цена на долго застревает между уровнями. Входны
FREE

What is this indicator? This indicator is the Stochastic Oscillator supporting Virtual Trading mode of Knots Compositor . When the mode is turned on, the indicator will be recalculated based on the displayed candlesticks. When the mode is turned off, the indicator will be recalculated based on the original chart candlesticks.
KC-Indicators - KC-MA (Moving Average) - KC-ENV (Envelopes) - KC-BB (Bollinger Bands) - KC-ADX (Average Directional Movement Index) - KC-MACD (Mo
FREE

A simple and highly effective Strength and Weakness currency indicator that can be used to aid your fundamental and technical analysis for winning trade decisions.
The indicator is very easy to use and can be applied to all time frames.
FX Tiger uses an advanced algorithm to calculate a score table for all major currencies. Green indicates currency strength and red indicates currency weakness. Once you have identified the strong and weak currencies, pair strong versus weak currencies and co
FREE

This project did not reach the basic funding number, so I am abandoning it momentarily. The system is now free for other traders to continue the idea. You can follow my new project through my signals.
A tool for institutional investor, now avaliable for Home users. We equip you like banks equip their analysts!
How it works
Focused on the Forex market, it takes advantage of the need of nations to control the value of their currency and the world exchange variations to analyze, through the
FREE

This is a multi-timeframe indicator that detects and displays support and resistance (S&R) lines using the ZigZag indicator.
Features
The support and resistance lines are not redrawing. The indicator is capable of adding new support and resistance levels as they appear. Each S&R line has a tooltip that displays the price level and start time. Shows the start time, price level and number of touches of all S&R lines when pressing the shortcut Shift+I Save time for multi-timeframe analysis on

Hyper DM, Moving Distance from Moving Averages is an indicator that allows you to define the distance in points of the upper and lower bands in relation to the moving average in the middle.
Its operation is simple, it has configuration parameters of the moving average of the middle and based on it and the defined distance parameters of the upper and lower bands, it is plotted in the graph.
FREE

================ // Average period ma_Sma, // Simple moving average ma_Ema, // Exponential moving average ma_Smma, // Smoothed MA ma_Lwma // Linear weighted MA =============== // Average method // Turn alerts on? // Alert on current bar? // Display messageas on alerts? // Play sound on alerts?
FREE

The Indicator indicator draws 2 clouds based on Donchian Channels indicator values. The upper cloud is formed by the upper lines values and the lower cloud by the lowers lines values. The indicator allows to change the Channels parameters and the clouds colors the period of the base line and the multiplier of each Donchian Channels instance. The indicator holds 5 buffer index as follow: [0] - Outer values of the upper cloud [1] - Inner values of the upper cloud [2] - Base/Center line values [3
FREE

ПОСМОТРИТЕ НАШ НОВЫЙ СОВЕТНИК : : https://www.mql5.com/ru/market/product/95095?source=Unknown#description
Индикатор отображает свечи заданного старшего таймфрейма, на меньших таймфреймах TF_Bar - выбор старшего таймфрейма, на основе которого будут отображаться свечи на текущем; Number_of_Bars - предельное число баров, до которого будет производиться расчет индикатора; Color_Up - цветовое отображение бычьих свечей; Color_Down - цветовое отображение медвежьих свечей; Widht_lines - то
FREE

What is this indicator? This indicator is the ADX (Average Directional Movement Index) supporting Virtual Trading mode of Knots Compositor . When the mode is turned on, the indicator will be recalculated based on the displayed candlesticks. When the mode is turned off, the indicator will be recalculated based on the original chart candlesticks.
KC-Indicators - KC-MA (Moving Average) - KC-ENV (Envelopes) - KC-BB (Bollinger Bands) - KC-ADX (Average Directional Movement Index)
FREE

Probability emerges to record higher prices when RVi breaks out oscillator historical resistance level. It's strongly encouraged to confirm price breakout with oscillator breakout since they have comparable effects to price breaking support and resistance levels; surely, short trades will have the same perception. As advantage, a lot of times oscillator breakout precedes price breakout as early alert to upcoming event as illustrated by last screenshot. Furthermore, divergence is confirmed in
FREE

O Chart Control é um indicador que permite de forma rapida e pratica alterar o timeframe e ativo do grafico, possibilitando que voce possa fazer todas as suas analises em apenas um grafico sem precisar abrir vários, além disso voce pode escolher o entre os temas claro e escuro para o qual melhor se adapta a sua preferencia.
MT4: https://www.mql5.com/pt/market/product/112155
FREE

Индикатор MWC COX показывает зоны экстремумов чистых длинных/коротких позиций в отчете по сделкам трейдеров, публикуемом комиссией CFTC раз в неделю за четыре периода. Настройки по умолчанию: периоды 12, 26, 52 и 156 недель.
Дополнительные функции Отображает сумму всех 4 периодов в одной строке Встроены индикаторы MA, MOM и RSI ( не в версии MQL5 Version 1.0 ) Необходимо скачать файл MWC_3L.dat в папку [...]/MQL5/Files . Более подробную инструкцию можно скачать здесь . Main data folder: www.my
FREE

Buy and Sell Arrows when price is about to retrace. It Also Sends Alerts – On MT5 To Your Phone To Your Email
Does not repaint.
Works ony any pair, any timeframe.
10 Activations allowed so you are free from limitations
See an example of alerts from today (23 May 2020) using this and 2 other indicators here .
MT4 Version here . Spreads from 0.1pip RAW/ECN Accounts, click here . Check out my Waka Esque EA signal here: >> High Risk Settings or Medium Risk Settings .
What is

Indicators are professional data statistics, position orders, historical order analysis->>>>>> <This version is in Chinese -> English version please move>
Necessary for traders: tools and indicators Waves automatically calculate indicators, channel trend trading Perfect trend-wave automatic calculation channel calculation , MT4 Perfect trend-wave automatic calculation channel calculation , MT5 Local Trading copying Easy And Fast Copy , MT4 Easy And Fast Copy , MT5 Local Trading copying For DE
FREE
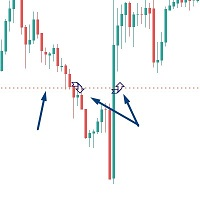
Introductory Offer! *** Only $47 - normal price $97 !! *** Ends soon - don't miis it!! The Close Above or Below Price Indicator is part of my suite of Price and Trendline Alerts Indicators. I'm excited to introduce the Close Above or Below Price Indicator – part of my new suite of Price and Trendline Alert Indicators – fantastic tools designed to alert you when candles close above or below significant prices in the markets you trade. With this indicator, you can set up to 4 price alerts on a

Indicador Regressão Linear – Par de Ativos - INTRADAY Indicador é um oscilador que faz o plot do Resíduo resultado da regressão linear entre os dois ativos inseridos como input do indicador, representado pela fórmula: Y = aX + b + R Onde Y é o valor do ativo dependente, X é o valor do ativo independente, a é a inclinação da reta entre os dois ativos, b é a intersecção da reta e R é o resíduo. O resíduo representa a quantidade da variabilidade que Y que o modelo ajustado não consegue explicar. E
FREE

This is Gekko's indicator of quotations and variations. It summarizes quotations and variations of the current symbol in different timeframes as well as other correlated symbols. Keep track of all this information on your chart while you are negotiating for decision making support. Input Parameters General Settings: configure which quotations and variations you want to keep track for current day, week, month or year as well as M1, M5, M15, M30, H1 and H4 charts; Symbols Configuration: add up to
FREE

The RFOC Mini Chart was created to project a macro view of the market, which the option to select the timeframe of interest other than the main chart, it is possible to include 2 indicators: 1 - Moving average channel On the mini chart, the moving average will be created based on the prices of the selected time frame for the RFOC Mini Chart. The moving average period must be selected in the indicator settings pannel.
2 - Boillinger Band In the mini chart, a boillinger band will be created base
FREE

verview: Our custom Kalman Filter indicator is a sophisticated, adaptive tool designed for MetaTrader 5 (MT5), offering traders a dynamic approach to analyzing financial markets. This indicator is based on the Kalman Filter algorithm, a powerful statistical method used for linear dynamic systems estimation. It's tailored for traders who need an advanced, responsive tool to track market trends and make informed decisions. Key Features: Dynamic Trend Analysis: The Kalman Filter continuously adjust
FREE

La **Media Móvil de Tercera Generación (TGMMA)** es una versión avanzada del indicador estándar de **Media Móvil (MA)**. Fue descrita por primera vez por Manfred G. Dürschner en su artículo "Gleitende Durchschnitte 3.0" (en alemán). Aquí están las características clave de la TGMMA:
1. **Reducción del Retraso**: - A diferencia de las MAs tradicionales, la TGMMA reduce significativamente el retraso. Se adapta más rápidamente a los cambios de precios, lo que la hace ideal para traders que bus
FREE

Este indicador apresenta 7 médias configuráveis, que podem facilmente ser utilizadas em robôs ou em operações manuais.
Facilita a identificação de tendências e reversões. Seus buffers estão ordenados e são facilmente identificáveis para utilizar em robôs. Liberado para uso em operações manuais ou automatizadas.
Em breve vamos postar um robô que utiliza estas médias como parâmetro de negociação.
FREE

Индикатор отображает количество и соотношение тиков роста и падения цены для каждой свечи графика. Верхняя часть гистограммы в виде тонких линий показывает количество тиков роста цены (сила быков), а нижняя - количество тиков падения цены (сила медведей). Более жирные столбцы гистограммы - это разность между силами быков и медведей. Положительная разность отображается зеленым цветом, а отрицательная - красным. Прирост силы быков происходит в тот момент, когда цена Ask текущего тика стала больше,
FREE

The Martinware Closing Time Alarm indicator serves to warn traders that the current period (bar, candle) is about to end.
Input parameters: Time offset: with how many seconds before the ending of the current period the alarm must trigger
Alert with sound: informs if the alert should include playing a sound
Sound selection: a list of sounds available
Custom sound: name of the custom sound file to be used in case "custom sound" was selected. It must be inside a folder named "Sounds", this o
FREE

Forex Indicator Arrows is an arrow Indicator used as an assistant tool for your trading strategy. The indicator analyzes the standard deviation of bar close for a given period and generates a buy or sell signals if the deviation increases. It good to combo with Martingale EA to follow Trend and Sellect Buy Only/Sell Only for EA work Semi-Automatic. You can use this Indicator with any EAs in my Products.
FREE

FXC iRSI-DivergencE MT5 Indicator
This is an advanced RSI indicator that finds trend-turn divergences on the current symbol. The indicator detects divergence between the RSI and the price movements as a strong trend-turn pattern.
Main features: Advanced divergence settings
Price based on Close, Open or High/Low prices Give Buy/Sell open signals PUSH notifications
E-mail sending Pop-up alert Customizeable Information panel Input parameters: RSI Period: The Period size of the RSI indicator.
R

This indicator displays breakouts on Point-And-Figure-like or Kagi-like custom symbol charts, generated by special expert advisers, such as PointFigureKagiCharts . This indicator is applicable only for custom instruments generated in appropriate way (with time-invariant bars which are multiples of a predefined box size). It makes no sense to apply it to other charts. The breakouts in up or down direction are marked by arrows. The breakout price is found at crossing of one of imaginary lines of
FREE

Recomended broker: https://tinyurl.com/5ftaha7c Indicator used to monitor price fluctuations in the market and discover possible reversals through reversal points or divergences in the indicator. All assets and all timeframes. SEE OUR RESULTS ON INSTAGRAM: https://www.instagram.com/diogo.cansi/ TELEGRAM GROUP = https://t.me/robosdsc More information by email dscinvestimentos@gmail.com or by Whatsapp 55-991372299
FREE

Dynamic Theoretical Stop
Histogram indicator that dynamically analyzes the theoretical Stop levels in real time.
Operation :
The DTS - Dynamic Theoretical Stop does a mapping of fractals in previous candles and suggests two levels of Stop: For purchase and for sale.
Suggested reading :
It is necessary to make the definition of Maximum Stop in points in the Trading Plan. In this way, the trader can decide the best entry point by analyzing the theoretical stop levels:
Stop for sales: S
FREE
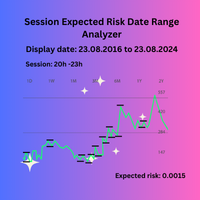
Session Expected Risk Date Range Analyzer: Analyzes price data across specified date ranges to provide detailed insights into financial risk and volatility, using each bar's price metrics for accurate risk assessment.
The Session Expected Risk Date Range Analyzer is a sophisticated tool designed to offer traders and analysts detailed insights into the expected financial risk across specific date ranges. Unlike traditional session-based analysis, this indicator focuses on calculating risk met
FREE

ATR Accelerator Indicator informs you about strong price movements based on the ATR Indicator. This Indicator works for all Timeframes and Symbols, the strength of movements can be configured.
Important: Get informed about new Products, join our MQL Channel: https://www.mql5.com/en/channels/etradro
Useage This Indicator works for all Timeframes and Symbols, the strength of movements can be configured. Features works on all timeframes and forex pairs or indices. Alert and Notify function i
FREE

Индикатор "Elder Ray" или "Ray" основан на осцилляторах, разработанных доктором Александром Элдером, а именно: Bulls & Bears Power. Оба они работают с экспоненциальной скользящей средней (EMA). Этот индикатор имеет множество применений, но в основном он используется для определения расхождений на рынке, ценовых направлений и многого другого ... В методе доктора Элдера обычно используется 13-дневный период EMA, хотя с помощью этого индикатора вы можете изменять периоды по своему усмотрению. Расче
FREE

The euro index (Euro Currency Index, EURX) is an average indicator of changes in the exchange rates of five currencies (US dollar, British pound, Japanese yen, Swiss franc and Swedish krona) against the euro. Displays a Eur X chart in a seperate window below the main chart. YOUR BROKER MUST HAVE THESE SYMBOLS FOR THE INDICATOR TO WORK Based on EUR/USD, EUR/JPY, EUR/GBP, EUR/CHF and EUR/SEK All these pairs must be added to Market Watch for the indicator to work correctly As this is calculated usi
FREE

For traders, monitoring price movements is a constant activity, because each price movement determines the action that must be taken next.
This simple indicator will helps traders to display prices more clearly in a larger size.
Users can set the font size and choose the color that will be displayed on the chart. There are three color options that can be selected to be displayed on the chart.
FREE

Wolf Countdown helps you not to waste the right amount of time, it gives you back the time remaining until the candle closes.
How to use: Download and install the Wolf Countdown Indicator on your MetaTrader 5. Apply the indicator to your favorite chart.
this works on any timeframe...
Thanks to this indicator you will never miss the right moment to enter your trades.
FREE

!! FLASH SALE !! Over 80% off !! For ONE week only. Now only $47 - normally $297! >>> Ends on 30 June 2023 - Don't miss it!
The Consolidation Breakout Alerts Indicator will revolutionize your trading strategy. Our innovative indicator offers unique buy and sell arrows when price breaks out from consolidation, allowing you to get in at the most optimal entry with minimal risk and maximum reward potential. Never again will you miss out on the lucrative trading opportunities available
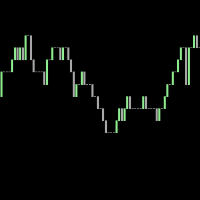
Это тиковый индикатор, который сравнивает текущую цену бида с предыдущей ставкой непосредственно перед ней и рисует свечи на основе сравнения текущих тиков. Он не использует исторические тики. Все происходит в реальном времени, данные перемещаются справа налево, а самые новые данные поступают справа. Можно добавить линию тренда, указывающую направление изменения цены.
FREE

Модифицированный и обновленный индикатор RSI. Пожалуйста используйте выводимые индикатором стрелки на графике для входа в сделки и для выхода из сделок. Индикатор предназначен для всех валютных пар и таймфреймов. Параметры: PeriodRSI - период индикатора;
OpenLevel - уровень для входа в сделки (диапазон 0-100);
CloseLevel - уровень для выхода из сделок (диапазон 0-100);
FlatMode - пожалуйста включите данный триггер в режиме флета (т.е. при отсутствии выраженных трендов).
FREE

The Indicator indicator draws 2 clouds based on Bollinger Bands indicator values. The upper cloud is formed by the upper lines values and the lower cloud by the lowers lines values. The indicator allows to change the Bollinger Bands parameters and the clouds colors the period of the base line and the deviations of each Bollinger Bands instance. The indicator holds 5 buffer index as follow: [0] - Outer values of the upper cloud [1] - Inner values of the upper cloud [2] - Base/Center line values
FREE

To get access to MT4 version please click here . This is the exact conversion from TradingView: "Hammer & ShootingStar Candle Detector" by "MoriFX". This is a light-load processing and non-repaint indicator. All input options are available. Buffers are available for processing in EAs. You can message in private chat for further changes you need. Thanks.
FREE

Объем - широко используемый индикатор в техническом анализе, однако есть вариант, который даже более полезен, чем сам объем: скользящее среднее объема.
Это не что иное, как скользящая средняя, применяемая к популярному индикатору Volume.
Как следует из названия, Volume + MA служит для отображения объема транзакций (совершенных покупок и продаж) определенного финансового актива в заданный момент времени вместе со скользящей средней этого же объема с течением времени.
Для чего это? С помо
FREE

Наконец то интерфейс стал удобным. Теперь вы можете мышкой управлять периодом индикатора. Просто нажмите на кнопку и прокрутите колесо мышки для увеличения или уменьшения периода CCI. Кнопку можно разместить в любом удобном месте, закрепить ее и использовать одним нажатием. На одном графике можно установить несколько индикаторов и управлять ими как по отдельности так и всеми сразу. Простая установка на график позволяет не заботится о переименовании или изменении параметров каждого индикатора, ав
FREE

This simple indicator creates a ZigZag based on market frequency. It can be very useful for those who trade TapeReading. Switch between the various timeframes and note that the ZigZag will be maintained, this is due to the method used to create a timeless indicator. Set the main input parameter: nTicks: Number of ticks for frequency inversion The other parameters are for visual aspects only, try them.
FREE

主要城市的时间。北京时间、东京时间、悉尼时间、惠灵顿时间、纽约时间、法兰克福时间、伦敦时间、迪拜时间。 城市时间可选择开启或者关闭。 点差变色提醒。设置点差提醒点数,例如,设置100点,点差大于100点,文字会变红色。 Time in major cities. Beijing time, Tokyo time, Sydney time, Wellington time, New York time, Frankfurt time, London time, Dubai time. City time can be turned on or off. Dot difference color change reminder. Set the point difference reminder points. For example, set 100 points. If the point difference is greater than 100 points, the text will turn red.
FREE

Consecutive candles can give us an indication as to the strength of a trend. With this indicator, you can set the number of consecutive bull or bear candles you wish to be present before achieving a valid signal of RSI crossing into overbought or oversold. With this information, you can better judge if a continuation or reversal situation is about to present. RSI has two settable levels
Interesting settings: Number of consecutive candles needed before a valid signal Overbought level of RSI Ove
FREE

Данный индикатор отображает значения доходности за выбранный период. Они отображаются как логарифм доходности, нежели значения цены или необработанные данные о доходности. Для малых значений доходности, показатели арифметической и геометрической доходности будут схожими. Преимущество использования значений доходности вместо цен заключается в нормализации. Это делает возможным сравнение всех переменных в сопоставимой метрике, несмотря на происхождение из ценовых рядов с разными значениями.
Вход
FREE
MACD RSI THUNDER
Акция на Хэллоуин В течение ограниченного времени получите скидку 95% на всех торговых ботов в MQL5 Market — не упустите эту жуткую сделку!
Идея этого индикатора изначально заключалась в том, чтобы использовать его в советнике RSI_THUNDER, который мы разработали для обеспечения более детального контроля направления тренда и импульса, в котором для корректной корреляции с индикатором RSI это необходимо.
Я преобразовал индикатор в сигнал, который можно передать и и
FREE

Индикатор рисует цветную гистограмму из сравнений значений сил быков и медведей. Работает следующим образом: Берутся значения двух индикаторов Bears и Bulls, сравнивается кто сильнее на свече, заполняется столбец. Это всё.
.
FREE
MetaTrader Маркет - единственный магазин, где можно скачать демоверсию торгового робота и подвергнуть его проверке и даже оптимизации на исторических данных.
Прочитайте описание и отзывы других покупателей на заинтересовавший вас продукт, скачайте его прямо в терминал и узнайте, как протестировать торгового робота перед покупкой. Только у нас вы можете получить представление о программе, не заплатив за неё.
Вы упускаете торговые возможности:
- Бесплатные приложения для трейдинга
- 8 000+ сигналов для копирования
- Экономические новости для анализа финансовых рынков
Регистрация
Вход
Если у вас нет учетной записи, зарегистрируйтесь
Для авторизации и пользования сайтом MQL5.com необходимо разрешить использование файлов Сookie.
Пожалуйста, включите в вашем браузере данную настройку, иначе вы не сможете авторизоваться.