Смотри обучающее видео по маркету на YouTube
Как купить торгового робота или индикатор
Запусти робота на
виртуальном хостинге
виртуальном хостинге
Протестируй индикатор/робота перед покупкой
Хочешь зарабатывать в Маркете?
Как подать продукт, чтобы его покупали
Новые технические индикаторы для MetaTrader 5 - 45

VWAP BAR It´s power full indicator of candle by candle when lined up with greate analysis, you have great opportunity, finder defense candle. Is a good ideia from order flow method, now your meta trader 5 inside you time frame chart .
What is the Volume Weighted Average Price (VWAP)?
The volume weighted average price (VWAP) is a trading benchmark used by traders that gives the average price a security has traded at throughout the day, based on both volume and price. It is important
FREE

O indicador CoioteAverageSpreed é uma releitura do indicador AverageSpreed. Ele mostra a relação de esforço x resultado entre o volume e a volatilidade do preço. Com o volume heatmap é possível identificar visualmente se o preço foi deslocado com uma quantidade maior de volume e se o deslocamento do preço apresentou maior resultado ou não. É possível identificar momentos de ignição e exaustão do movimento, além de injeções de fluxo para dar continuidade a um movimento.

CoioteWeisWave é uma releitura do indicador de VSA WeisWave com indicação do estouro de fractal, método de analise dos TradersPiolhos e implementado originalmente pelo Trader Dario Junqueira. A versão Coiote foi reprojetada para indicação da volatilidade do volume no fractal. A coloração adicional (azul e magenta) dão sinais de entrada, saída e pontos de gerenciamento, podendo ser usados também como suporte e resistência.
Existem 3 modos de exibição do weis wave, por volume total, por range e p

The DYJ CandleShape contains 80 candlestick Patterns, such as MORNING STAR, DOJI STAR, HARAMI CROSS,INVERT HAMMER,ENGULFING..... candlestick is a valid form of market technical analysis. The recommended short stoploss is near the highest price of the first three to five candles The recommended long stoploss is near the lowest price of the first three to five candles Input
InpPeriodSMA =10 -- Period of averaging InpAlert =true -- Enable. alert InpCountBars =

Линия Koala Trend обновлена до версии 1.2
Улучшение последнего обновления: добавлен новый параметр, который позволяет пользователю подключать линию тренда ко 2-й, 3-й или X-й самой высокой или самой низкой точке.
Мой запрос :
** Уважаемые клиенты, пожалуйста, опубликуйте свой отзыв о Koala Trend Line, и позвольте мне улучшить ваши отзывы.
ПОЧЕМУ KOALA TREND LINE ЯВЛЯЕТСЯ БЕСПЛАТНЫМ ИНДИКАТОРОМ?
Я считаю, что бесплатный индикатор должен быть квалифицированным инструментом.
А что н
FREE

Premium Trend Entry Pro
TZ Trade Logics, представляет вам улучшенную версию входа в тренд Premium
Этот выпуск принесет вам гораздо более расслабленное состояние торговли с расширенными функциями для фильтрации тренда и временем входа премиального сигнала.
Для нас важно не создание продукта! но продолжали обслуживание и обучение пользователей. Благодаря нашим специальным средствам связи с нами вы получите подробное руководство по использованию продукта и другие соответствующие тренинги, св
FREE

Necessary for traders: tools and indicators Waves automatically calculate indicators, channel trend trading Perfect trend-wave automatic calculation channel calculation , MT4 Perfect trend-wave automatic calculation channel calculation , MT5 Local Trading copying Easy And Fast Copy , MT4 Easy And Fast Copy , MT5 Local Trading copying For DEMO Easy And Fast Copy , MT4 DEMO Easy And Fast Copy , MT5 DEMO «Кооператив QQ: 556024» "Сотрудничество WeChat: 556024" «Совместная электронная почта: 55602
FREE

Алгоритм работы индикатора Sup Trend заключается в определении господствующего направления движения цены путем алгоритмического анализа ценовых значений за определенный период времени. При рассчете данного индикатора сперва рассчитываются логорифмические приросты по цене закрытия, что позволяет отфильтровать тренд, сезонность и прочие вкрапления которые портят картину волатильности, затем по полученным данным строится стандартно-квадратическое отклонение. Алгоритм учитывает измерение цен, также
Least Square MA Описание: Индикатор Least Square Moving Average позволяет оценить направление движения рынка и его возможные развороты. Индикатор представляет собой линию, которая отображается в ценовом окне. Входные параметры: LSMA_Period - период расчета скользящей средней по методу наименьших квадратов; Prediction – число свечек, по которому строится прогнозная скользящая средняя по методу наименьших квадратов при условии, что скорость ее (падения или роста сохранится); Display_Bars - количе

Necessary for traders: tools and indicators Waves automatically calculate indicators, channel trend trading Perfect trend-wave automatic calculation channel calculation , MT4 Perfect trend-wave automatic calculation channel calculation , MT5 Local Trading copying Easy And Fast Copy , MT4 Easy And Fast Copy , MT5 Local Trading copying For DEMO Easy And Fast Copy , MT4 DEMO Easy And Fast Copy , MT5 DEMO
Strongly recommend trend indicators, automatic calculation of wave standard and MT5 ve
FREE

The Volume Heatmap indicator visually shows the INTENSITY of the volume taking into account the concept of standard deviation. Purpose of the Indicator: High volumes are common where there is a strong consensus that prices will increase. An increase in volume often occurs at the beginning of a new upward trend in the price of an asset. Some technical analysts do not rely on trend confirmations without a significant increase in volume. Low volumes usually occur when an asset is heading for a down
FREE

The Volume Heatmap indicator visually shows the INTENSITY of the volume taking into account the concept of standard deviation. Purpose of the Indicator: High volumes are common where there is a strong consensus that prices will increase. An increase in volume often occurs at the beginning of a new upward trend in the price of an asset. Some technical analysts do not rely on trend confirmations without a significant increase in volume. Low volumes usually occur when an asset is heading for a down

Хотели бы вы увидеть будущие линии индикатора ZigZag ? Этот индикатор поможет вам в этом, благодаря тому, что модель индикатора построена на основе двух индикаторов: Historical Memory и ZigZag . Благодаря этому индикатор предсказывает линии ZigZag'а. Весьма удобен в качестве помощника, служит ориентиром будущего характера движения цены. Прогноз рассчитывается методом поиска в истории наиболее похожего участка (паттерн) на текущий. Индикатор рисуется в виде линии, показывающей исторический и

Индикатор Average Price производит расчет средних цен открытых позиций BUY и открытых позиций SELL, с учетом размера открытых позиций, комиссий и свопов. Индикатор строит среднюю линию открытых позиций BUY, после пересечения которой, ценой снизу вверх, суммарная прибыль по всем позициям BUY по текущему инструменту, становится больше 0. Индикатор строит среднюю линию открытых позиций SELL, после пересечения которой, ценой сверху вниз, суммарная прибыль по всем позициям SELL по текущему инструмен

Тарифный план Koala Engulf Pattern
Шаг 1: Бесплатно для первых 20 загрузок.
Шаг 2: Аренда 10 $ / год для следующих 20 загрузок.
Шаг 3: Аренда 20 $ / год для следующих 20 загрузок.
Step4; Закупочная цена за пожизненное использование для следующих 100 загрузок 39 $.
Шаг 5: Окончательная пожизненная цена этого продукта составляет 99 $.
Введение в шаблон "Поглощение коалы"
Профессиональный индикатор MT5 для обнаружения паттерна поглощения Price Action.
Полез

Necessary for traders: tools and indicators Waves automatically calculate indicators, channel trend trading Perfect trend-wave automatic calculation channel calculation , MT4 Perfect trend-wave automatic calculation channel calculation , MT5 Local Trading copying Easy And Fast Copy , MT4 Easy And Fast Copy , MT5 Local Trading copying For DEMO Easy And Fast Copy , MT4 DEMO Easy And Fast Copy , MT5
DEMO
砖图 Renko PRO->>>
The display of the brick map on the main map.
The Renko chart ideal
FREE

Индикатор автоматически строит значимые трендовые линии и отображает сигналы на покупку и продажу. Сигналы формируются на отражение и на пробой от линий поддержки и сопротивления. При появлении сигнала индикатор отображает его в виде стрелки заданного цвета а также отправляет заданный во входных параметрах тип сообщений. В настройках индикатора можно задавать тип сигнала, максимальное расстояние до трендовой линии, тип оповещений а также настройки линий и стрелок. Индикатор имеет панель на котор
FREE

Necessary for traders: tools and indicators Waves automatically calculate indicators, channel trend trading Perfect trend-wave automatic calculation channel calculation , MT4 Perfect trend-wave automatic calculation channel calculation , MT5 Local Trading copying Easy And Fast Copy , MT4 Easy And Fast Copy , MT5 Local Trading copying For DEMO Easy And Fast Copy , MT4 DEMO Easy And Fast Copy , MT5 DEMO
Can set the cycle for other varieties of K line graph covered this window, fluctuations obse
FREE

Necessary for traders: tools and indicators Waves automatically calculate indicators, channel trend trading Perfect trend-wave automatic calculation channel calculation , MT4 Perfect trend-wave automatic calculation channel calculation , MT5 Local Trading copying Easy And Fast Copy , MT4 Easy And Fast Copy , MT5 Local Trading copying For DEMO Easy And Fast Copy , MT4 DEMO Easy And Fast Copy , MT5 DEMO Fibo: from KTrade 1. Automatically calculate and analyze the band. -> Get the desired band 2.
FREE

The Chaikin Money Flow (CMF) is an indicator created by Marc Chaikin in the 1980s to monitor the accumulation and distribution of a stock over a specified period. The default CMF period is 21 days. The indicator readings range between +1 and -1. Any crosses above or below 0 can be used to confirm changes in money flow, as well as buying or selling momentum, but many traders look for divergences to predict trend reversal based on volume. This indicator was developed not only to be used by man
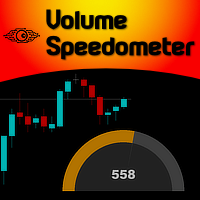
Imagine the ability to have Volume Speed second by second presented to you in the form of a speedometer... Well, imagine no more... Welcome to the new Minions Labs creation: Volume Speedometer . Volume Speedometer is a Minions Labs idea that was born trying to show in realtime what is happening with the Volume Flow of orders (or Ticks, if you don't have that) during the day. This indicator was created to be used in Intraday trading and the goal is to give you a "heads up" when the Volume flow is
Hi, I'm a Japanese EA developer.
I made an indicator for MT5. It can be used as a guide for trends and as a guide for entry / exit.
Please use it by pasting it on a chart of about 1 minute to 15 minutes.
If you like, please watch the video.
Various usages 1. It is used to recognize the environmental advantage of buying or selling with the color of the line. If the line is red, it is advantageous to buy. If it is blue, it is advantageous to sell. Neither if there is no line. 2. Used as

ATR Moving Average draws a moving average of the standard Average True Range( ATR ) in the same window.
Settings Name Description ATR period
Set Price per iod for ATR calculation
ATR level Set ATR value for thresholding( only whole number, ignore leading zeros e.g. 0.00089 = 89 ) MA Period Set moving Average Period MA Method Set moving average method( Simple, Exponential, Smoothed and Linear Weighted ) MA Shift
Set moving average shift
Enable Alerts ? Generate Alert when ATR crosses
FREE

Продвинутая мультисимвольная/мультитаймфреймная версия индикатора "Candle Pattern Finder for MT5 " (Поиск свечных паттернов на основе книги Грегори Л. Морриса «Японские свечи. Метод анализа акций и фьючерсов»). Индикатор ищет свечные паттерны по всем символам окна "Market Watch" и по всем стандартным таймфреймам от M1 до MN1. При возникновении паттерна на любом символе/таймфрейме индикатор дает сигнал (текстовый, звуковой, отправка сообщения на мобильник и эл.почту).
Таким образом, размещая инд

Описание
SuperCCI - индикатор, основанный на стандартном индикаторе CCI. Он определяет и отображает схождения/расхождения на рынке и формирует соответствующие точки входа. Также с помощью индекса торгового канала он определяет направление тренда и отображает уровни поддержки и сопротивления .
Features Не перерисовывается. Показывает точки входа. Показывает направление текущего тренда и уровни поддержки/сопротивления. Имеет оповещения. Рекомендации
Используйте конвергенцию/дивергенцию для

In this indicator you choice a data to be used from yesterday (high, low, open, close, etc) to automatically draw an line to be the zero. And, from that a percentage deviation ("Percentage to be used") is calculated and used to draw others line to both side until a limit be reached.
Both sides can have diferrent colours as show in screenshots. Also, more than one indicator can be used at same time.
FREE

Necessary for traders: tools and indicators Waves automatically calculate indicators, channel trend trading Perfect trend-wave automatic calculation channel calculation , MT4 Perfect trend-wave automatic calculation channel calculation , MT5 Local Trading copying Easy And Fast Copy , MT4 Easy And Fast Copy , MT5 Local Trading copying For DEMO Easy And Fast Copy , MT4 DEMO Easy And Fast Copy , MT5 DEMO
The homeopathic indicator is also called the CCI indicator. The CCI indicator was propos
FREE

"Spotting emerging trends, defining correction periods, and anticipating reversals can benefit your trading in many ways..." So be it: Higher Highs & Lower Lows indicator. This is an indicator created by Vitali Apirine and presented to the public through the article "Time To Buy. Time to Sell - It's a Stochastic, Higher Highs & Lower Lows" in the Stocks & Commodities magazine . This is a Momentum indicator that helps determine the direction of a trend. Higher Highs and Lower Lows are two indicat
FREE

FXC iDeM-DivergencE MT5 Indicator
This is an advanced DeMarker indicator that finds trend-turn divergences on the current symbol. The indicator detects divergence between the DeMarker and the price movements as a strong trend-turn pattern.
Main features: Advanced divergence settings
Price based on Close, Open or High/Low prices Give Buy/Sell open signals PUSH notifications
E-mail sending Pop-up alert Customizeable Information panel Input parameters: DeM Period: The Period size of the DeMarke

For those who feel that regular RSI is too fast and too noisy to be used on regular trades or in EAs and want to have an alternative to meter the Momentum of the Price, here is a solution presented on the great article of the Technical Analysis of Stocks & Commodities magazine (April, 2015), by Vitali Apirine, called: Slow Relative Strenght Index . Its reading is almost the same as the regular RSI, but its levels of Overbought and Oversold are 80 and 20 instead. SRSI is very powerful to show div
FREE

FXC iCCI-DivergencE MT5 Indicator
This is an advanced CCI indicator that finds trend-turn divergences on the current symbol. The indicator detects divergence between the CCI and the price movements as a strong trend-turn pattern.
Main features: Advanced divergence settings
Price based on Close, Open or High/Low prices Give Buy/Sell open signals PUSH notifications
E-mail sending Pop-up alert Customizeable Information panel Input parameters: CCI Period: The Period size of the CCI indicator.
C

A stochastic oscillator is a momentum indicator comparing a particular closing price of a security to a range of its prices over a certain period of time. The sensitivity of the oscillator to market movements is reducible by adjusting that time period or by taking a moving average of the result. It is used to generate overbought and oversold trading signals, utilizing a 0-100 bounded range of values. This indicator show 8 stochastic on one chart.
FREE

The Oscar, one of my favorite indicators. This is my enhanced Version of it with more options and better visuals. Many different averaging methods Oscar changes color on signal cross, but not too volatile (3% extra threshold) Adaptable Divisor, higher numbers lead to more signals, due to higher fluctuations. Its a fast but quite accurate trend direction indicator. Play around with the settings and make it match to your setup. GL trading Please follow me on Twitter https://twitter.com/semager and
FREE
MTF Moving Average High Low line. I use it in my MT5 and MT4 robots in the round. Look at the robots and indicators I put up under my name. Good luck trading! :)
MTF Moving Average (Mozgó Átlag) High (felső) Low (alsó) line (vonala). MT5 és MT4 robotomban használom a fordulóban. Nézd meg a nevem alatt milyen robotokat és indikátort raktam fel . Sok sikert a kereskedéshez! :)

Projeção de alvos harmônicos com dois cliques, os alvos possuem melhor qualidade quando ancorados em candles climáticos, seja de ignição ou exaustão ou em pivôs de alto volume.
Funciona com qualquer ativo (volume real e volume tick), em qualquer tempo gráfico, ações, indicies, futuros, forex, criptomoedas, commodities, energia, mineiro e qualquer outro. As projeções devem respeitar os princípios de confluência e simetria, portanto não devem ser utilizados unicamente como critério de decisão, se

This indicator draws a vertical line repeatedly at the set time. The number of lines that can be set can be set arbitrarily. In addition, it is possible to set 4 types of lines. It is possible to change different times, colors, line types, etc. The time can be set to any time in minutes.
In the next version, we plan to display the high and low prices within the setting range.
FREE

Custom Spread Indicator *Please write a review, thanks!
Also MT4 version is available
Spread Indicator show the current spread in pips with color codes. Handle 3 levels, Low, Medium, High. You can set levels and colors for each level (eg. Low: Green, Medium: Orange, High: Red), and can choose display position on the chart.
There is two spread calculation mode: -> Server spread value -> Ask - Bid value
Can set opacity, for better customization. When spread jump bigger, then display do
FREE

The Didi Index is an indicator that helps in the identification of the so called “Didi Needles” (Agulhada do Didi), a method created by the experienced Brazilian trader Odir Aguiar (Didi).
DIDI NEEDLES EXPLAINED
The concept of the needles is simple: 3 moving averages are added to the chart (by default 3, 8 and 20 periods, simple mode), and whenever all 3 averages pass simultaneously inside the real body of a candle, the needling occurs. It was named after the movement of passing a thread th

Moving Average Distance Indicator
The “Moving Average Distance Indicator” calculates the difference between the instrument's price and the moving average of your choice, showing this difference in percentage values or in price. In other words, it indicates how far the price is from the moving average.
What is it for?
The great advantage of this indicator is the ease to compare movement expansions that occurred in the past, at different price levels, as the indicator works in a levell

This Indicator adding power to traditional zigzag indicator. With High-Low numbers in vision it will be easier to estimate change of trend by knowing the depth of each wave. Information including points, pips, percentage%, and #bars can be displayed based on configuration. All information is real-time update. This indicator is especially useful in sideway market to buy low sell high.
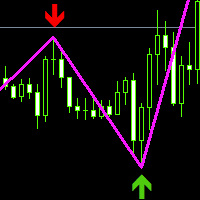
Данный показатель основан на вторичной разработке zigzag, добавлена стрелка высот и низких точек, линия добавлена грубо, цвет изменен. можно хорошо показать текущий сигнал входа в рынок, в настоящее время больше чем пустые. в процессе ручной работы на реальных дисках обнаружена более точная информация, которая может быть использована в сочетании с другими показателями для определения торговых точек и имеет большую справочную ценность. Данный показатель сам по себе определяет свои будущие функ
FREE

Торговля пивотами:
1.pp pivot
2. r1 r2 r3, s1 s2 s3
Necessary for traders: tools and indicators Waves automatically calculate indicators, channel trend trading Perfect trend-wave automatic calculation channel calculation , MT4 Perfect trend-wave automatic calculation channel calculation , MT5 Local Trading copying Easy And Fast Copy , MT4 Easy And Fast Copy , MT5 Local Trading copying For DEMO Easy And Fast Copy , MT4 DEMO Easy And Fast Copy , MT5 DEMO
Сотрудничество QQ: 556024 "
Со
FREE

Индикатор контролирует уровень STOPLEVEL. При изменении уровня сигнализирует оповещением. STOPLEVEL - минимальный отступ в пунктах от текущей цены закрытия для установки Stop ордеров, или минимально допустимый уровень стоп-лосса/тейк-профита в пунктах. Нулевое значение STOPLEVEL означает либо отсутствие ограничения на минимальную дистанцию для стоп-лосса/тейк-профита, либо факт использования торговым сервером внешних механизмов динамического контроля уровней, которые не могут быть транслиро
FREE

Necessary for traders: tools and indicators Waves automatically calculate indicators, channel trend trading Perfect trend-wave automatic calculation channel calculation , MT4 Perfect trend-wave automatic calculation channel calculation , MT5 Local Trading copying Easy And Fast Copy , MT4 Easy And Fast Copy , MT5 Local Trading copying For DEMO Easy And Fast Copy , MT4 DEMO Easy And Fast Copy , MT5 DEMO Расширенные полосы Боллинджера:
1. Рельс Боллинджера изменит цвет в зависимости от направлен
FREE

Индикаторы для трендовых!
Торговая система, построенная на трех скользящих средних. Торгуйте по тренду и позвольте прибыли расти. Necessary for traders: tools and indicators Waves automatically calculate indicators, channel trend trading Perfect trend-wave automatic calculation channel calculation , MT4 Perfect trend-wave automatic calculation channel calculation , MT5 Local Trading copying Easy And Fast Copy , MT4 Easy And Fast Copy , MT5 Local Trading copying For DEMO Easy And Fast Copy , M
FREE
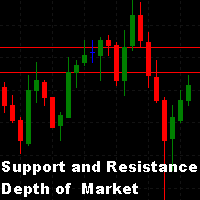
Мы часто ищем на графике точки поддержки и сопротивления. Один из методов, который можно использовать, - это количество лотов, предлагаемых в книге заказов. Этот индикатор ищет самые большие лоты в книге заказов и рисует их на графике в виде линий, тем самым определяя наибольшую концентрацию лотов, предлагаемых на централизованном фондовом рынке в то время, таким образом настраивая возможные линии поддержки и сопротивления.
- Количество линий для рисования может быть определено пользователем;

VWAP - это внутридневной расчет, используемый в основном алгоритмами и институциональными трейдерами для оценки того, где торгуется акция, относительно ее средневзвешенного объема за день. Дневные трейдеры также используют VWAP для оценки направления рынка и фильтрации торговых сигналов. Этот индикатор используется для анализа и расчета Vwap от определенной точки на графике, что широко используется для анализа начала движения цены, взаимосвязи с объемом.
- Множественные Vwaps на одном графике
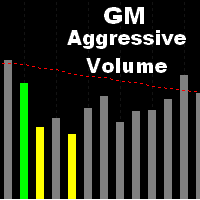
Объем - это ресурс, используемый аналитиками с различными методологиями именно потому, что он показывает подтверждение движений и прогресса рынка. Это индикатор, который анализирует финансовое количество, которое было продано в течение определенного периода.
Этот индикатор анализирует объем для каждой свечи, при чрезмерном увеличении он отличается от других цветной полосой.
Помимо информирования в виде цветных полос, этот индикатор позволяет выдавать звуковое предупреждение при возникновени

his is a custom indicator based on double-average crossing and arrow marking.
Make multiple lists when blue arrows appear up.
Make a blank list when the red arrow appears down.
When the pink line crosses the green line upwards, the pink line is above, the green line is below, the golden fork appears, and the blue arrow appears.
When the pink line crosses down through the green line, the pink line is below, the green line is above, a dead fork appears, and a red arrow appears.
This is
FREE

Time your Entry and Exits with Average True Range (ATR) Trailing Stops ATR Trailing Stops are primarily used to protect capital and lock in profits on individual trades but they can also be used, in conjunction with a trend filter, to signal entries. The indicator will help make your calculation of stop loss easier as it will be visually aiding you in choosing where to put your stoploss level on the chart by calculating the current value of ATR indicator. For those who are unfamiliar with ATR, i
FREE
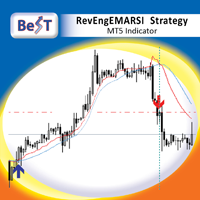
BeST_RevEngEMARSI Strategy is an MT5 Indicator that is based on the indicator RevEngEMARSI by Giorgos Siligardos that was presented in his article " Reverse Engineering RSI (II) " ( TASC_Aug 2003 ) as a new variation of his inverse-RSI indicator and which transforms the Exponential moving average of RSI into a curve in the price graph, simplifying the price projection method and improving its visual representation. BeST_RevEngEMARSI Strategy while implementing the crossings with its Moving Aver

For those traders who really care about Volume as an important vector information on Price Action, here is an exclusive idea & creation from Minions Labs: Volume Speed . The Volume Speed indicator shows you visually how much time (in seconds, minutes, hours, you choose) the Volume took to reach the Average Volume of the past bars. This way you can have the exact idea of "what is happening right now with the Volume of the current bar..." and take action accordingly with your strategy, having even

Секвента Демарка (Sequential) - индикатор, демонстрирующий развитие тренда, его структуру. Довольно точно отображает начальную и конечную точки, важные точки перелома. Срабатывает по открытию свечи, поэтому перерисовок не будет никогда.
Здесь нет сложных формул, только статистика, отсчёт свечей, выбранных по определённым критериям. При этом индикатор может давать очень точные сигналы для входа, особенно при поддержке какого-нибудь индикатора уровней, например, этого . Алгоритм нахождения сигнал

Join Deriv link on profile>>>
GET THIS FULL COPY AND GET ANOTHER FREE INDICATOR ONE OF THE BEST AND USEFULL INDICATORS IN THE WORLD ..This is the one of the best usefull indicators which has chosen to be used by top traders in the world.
AUTOMATIC SUPPORT AND RESISTANCE This way of trading is also called Supply and demand, On this way of trading you can see auto colours appear where the market changes direction buying or selling Direction.
ALL KIND OF PAIRS METALS AND INDICIES ARE INCLUDE
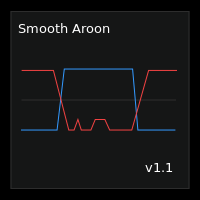
Smooth Aroon is a version of the Aroon Up and Down with smoothing and filtering.
Features :
Smoothing : You have smoothing from 0 to 99 . To smooth a signal, find the maximum value of the points in question then set the smoothing level above the maximum value. For example : If you want to smooth all signals below 30, then you should set the smoothing level above 30 This also smooths all signals above 70, since the Aroon Up and Down Oscillates between 0 and 100. Filtering : If you only

This plots Fibonacci deviation levels above and below a moving average of the price. Companion indicator to the " Golden Bull Wave Trader " expert advisor which uses volume\price trend to determine price reversals. https://www.mql5.com/en/market/product/56291 The expert advisor and this indicator were created in order to: Identify ideal and repeatable trade entries with high level of certainty Create a day trading strategy which doesn’t require a hard SL and TP Use alternate risk management me

Necessary for traders: tools and indicators Waves automatically calculate indicators, channel trend trading Perfect trend-wave automatic calculation channel calculation , MT4 Perfect trend-wave automatic calculation channel calculation , MT5 Local Trading copying Easy And Fast Copy , MT4 Easy And Fast Copy , MT5 Local Trading copying For DEMO Easy And Fast Copy , MT4 DEMO Easy And Fast Copy , MT5 DEMO MACD называется скользящей средней конвергенции и расхождения, которая создается на основе дво
FREE
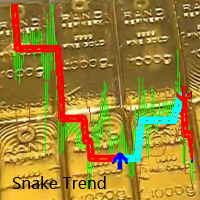
Содержание индекса: 1. Контрольная цена, относится к контрольной цене. В краткосрочной перспективе цена колеблется непрерывно и беспорядочно, и краткосрочная судьба будет казаться непредсказуемой. 2. Справочное направление тренда
Предлагать: Ослабьте краткосрочные колебания линии K и следуйте средне- и долгосрочному тренду.
"Расти вместе!" «Кооператив QQ: 556024» "Сотрудничество WeChat: 556024" «Совместная электронная почта: 556024@qq.com»
"Тенденция формируется или умирает, и

Нам часто нужно знать внезапное изменение тренда, которое происходит на графике, и это можно подтвердить с помощью индикаторов.
Индикатор показывает моменты разворота тренда и то, как смещается цена.
Пользовательский фон, не нужно настраивать цвета на графике, просто перетащите индикатор!
Индикация стрелками.
- Синяя стрелка: восходящий тренд.
- Розовая стрелка: нисходящий тренд.
ПРИМЕЧАНИЕ. Индикатор бесплатен, ответ службы поддержки может занять некоторое время.
FREE

Простой индикатор объема по цвету свечи!
- Пользовательский фон!
- Поддерживает объем по тикам или реальный объем.
Исходный индикатор объема Metatrader не отображает цвета полосы в соответствии с цветом свечи, он меняет цвет только тогда, когда объем свечи больше, чем у предыдущей, это иногда создает путаницу для новичков и не знает реального причина изменения цвета.
Бесплатный индикатор, поддержка может занять некоторое время, чтобы ответить!
FREE

This indicator is created by using an exclusive algorithm to indicate you Buy or Sell in an accurate way all the possibles reversals within a normalized trending bands. The main goal for this algorithm is to achieve fast profitable movements and aggressive retracement. Thanks to the normalized bands, using the noises of the market. We have added the "Golden Trade", we define it as the perfect order: For those orders that had the perfect entry price. They were always in profit, or the final pr

Time to Trade Trading timing indicator is based on market volatility through 2 ATR indicators to determine the timing of a transaction. The indicator determines the times when the market has strong volatility in trend. When histogram is greater than 0 (blue) is a strong market, when histogram is less than 0 (yellow) is a weak market. Should only trade within histograms greater than 0. Based on the histogram chart, the first histogram value is greater than 0 and the second histogram appears, this
FREE

Это версия MT5. Это алгоритм для раннего обнаружения изменений тренда. Вы должны попробовать несколько значений для параметра мультипликатора (1 < <10 рекомендуется). На первый взгляд вы можете увидеть эффективные записи. Это, по сути, один из строк, что Гелег Faktor первоначально было. Но он был удален, потому что он больше не нужен. Других строк было достаточно для эффективности G.Faktor, но я все еще хотел поделиться этим. Всегда тест, прежде чем использовать его на живой счет, так что вы пол
FREE

Это версия MT5 Вот несколько показателей, которые работают вместе. Он в основном работает с движущихся средних и различных уровней ATR создания динамического канала, через который цена осушенных. Как я всегда рекомендую, вы должны попробовать его, прежде чем использовать его вживую, так что вы понимаете, как это работает. Сигнал входа на рынок похож на другие индикаторы MA, но с этим у вас также есть графический анализ момента, когда тренд найден и динамические уровни, чтобы скорректировать стоп
FREE

Это версия MT5. Получить К-Математика MT4 здесь Проверьте это, и если вам это нравится, просто наслаждайтесь этим. Попробуйте различные значения, чтобы найти параметр, который лучше всего подходит для вашей торговли. Восходящий сигнал, если индикатор окрашен зеленым газоном и медвежьим сигналом, если индикатор серый. Вы можете использовать сам линию для задней остановки при открытии ордеров. Это всего лишь инструмент. Дополнение. Это не стратегия. Объедините его с собственным анализом Просто ска
FREE
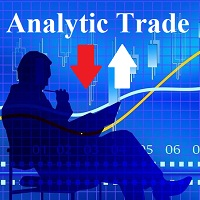
Индикатор Analytic Trade - это полноценная торговая система. Он состоит из 4 частей: Первая - это стрелочки, показывающие наиболее оптимальные точки открытия и закрытия ордеров. Стрелка вверх - сигнал на покупку, вниз - на продажу. Вторая - это информационная панель в правом верхнем углу. Крупным шрифтом обозначена текущая цена, над ней показаны: максимум дня, расстояние от текущей цены до него и разность максимума и минимума (в пунктах). Под ней расположены: минимум дня, расстояние до минимума,
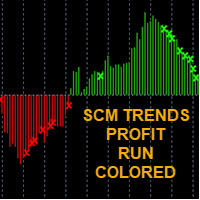
-EASY TO FOLLOW TRENDS -RED SELL / GREEN BUY -CROSS SIGNAL IS MEAN "TRENS WARNING" TO EXIT ORDER (WEAK TRENDS)
-WITH AUDIBLE ALERT ON/OFF
SCM indicator with different colors at levels 0, 100 and -100. The cross is a signal for " Exit" This exit signal is effective especially in short-term breakout trades, because it prevents early exiting at small corrections.
*****TIP EURUSD/BTC TF 10 min is work very Well****
****** GOLD TF15min is work very Well***** (after TF 15min show exit buy an

Описание
Impulse Angle - индикатор, который идентифицирует на рынке импульсы и отображает на графике угол их наклона.
Рекомендации
Вы можете использовать данный индикатор для определения тренда (импульса) и соответственно для определения направления открытия позиции или закрытия противоположной позиции.
Параметры
===== _INDICATOR_SETTINGS_ ===== - настройки расчета индикатора
Maximum History Bars - максимальное количество баров истории для расчета индикатора. Average True Range Perio

The Hybrid Stochastic indicator is a Stochastic RSI described by the famous Tushar Chande and Stanley Kroll in their book called " The New Technical Trader" . The main goal of this indicator is to generate more Overbought and Oversold signals than the traditional Relative Strength indicator (RSI). Combining these 2 indicators expands the range of the overbought and oversold territory. The idea behind it is to use the Stochastic formula over RSI values. If you want to know more about its internal
FREE
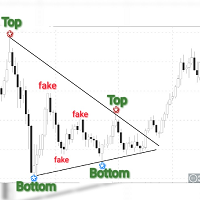
Obaforex Tops & Bottoms is a trading tool born out of a personal need to accurately filter tops and Bottoms and ensure consistency in the way tops and bottoms are picked for technical analysis. Mt4 version https://www.mql5.com/en/market/product/53637
It does not repaint (once top or bottom is printed, it don't disappear) It only prints tops and bottoms after a specified No of bars or candles to the right
This tool is expected to significantly improve the decision making of almost any form o
Узнайте, как легко и просто купить торгового робота в MetaTrader AppStore - магазине приложений для платформы MetaTrader.
Платежная система MQL5.community позволяет проводить оплату с помощью PayPal, банковских карт и популярных платежных систем. Кроме того, настоятельно рекомендуем протестировать торгового робота перед покупкой, чтобы получить более полное представление о нем.
Вы упускаете торговые возможности:
- Бесплатные приложения для трейдинга
- 8 000+ сигналов для копирования
- Экономические новости для анализа финансовых рынков
Регистрация
Вход
Если у вас нет учетной записи, зарегистрируйтесь
Для авторизации и пользования сайтом MQL5.com необходимо разрешить использование файлов Сookie.
Пожалуйста, включите в вашем браузере данную настройку, иначе вы не сможете авторизоваться.