Смотри обучающее видео по маркету на YouTube
Как купить торгового робота или индикатор
Запусти робота на
виртуальном хостинге
виртуальном хостинге
Протестируй индикатор/робота перед покупкой
Хочешь зарабатывать в Маркете?
Как подать продукт, чтобы его покупали
Новые технические индикаторы для MetaTrader 5 - 3
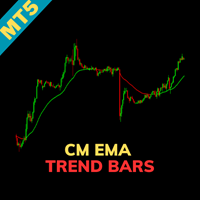
Indicator Name: CM EMA Trend Bars Overview: The CM EMA Trend Bars indicator is a straightforward yet effective tool that changes the color of price bars based on their relationship to the Exponential Moving Average (EMA). This visual cue helps traders quickly identify trend direction and potential trading opportunities. Key Features: Dynamic Bar Coloring: The indicator changes the color of the bars depending on whether they are above or below the EMA, providing a clear visual representation of t
FREE

Coral trend is a trend-following indicator that is widely popular among FOREX traders . It is usually used as a confluence with other indicators. It uses combinations of moving averages with complex smoothing formulas! It has two configurable parameters: Coefficient - smoothing ratio (*)
Applied price Calculation: Coral = (-0.064) * B6 + 0.672 * B5 - 2.352 * B4 + 2.744 * B3
FREE
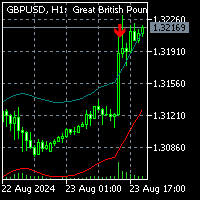
To get access to MT4 version click here . This is the exact conversion from "Nadaraya-Watson Envelope" by " LuxAlgo ". (with non-repaint input option) This is not a light-load processing indicator if repaint input is set to true . All input options are available. Buffers are available for processing in EAs. I changed default input setup to non-repaint mode for better performance required for mql market validation procedure . Here is the source code of a simple Expert Advisor operating based on

The true strength index is a technical indicator used in the analysis of financial markets that attempts to show both trend direction and overbought/oversold conditions. It was first published William Blau in 1991. The indicator uses moving averages of the underlying momentum of a financial instrument. The True Strength Index (TSI) is a momentum oscillator that ranges between limits of -100 and +100 and has a base value of 0.
FREE
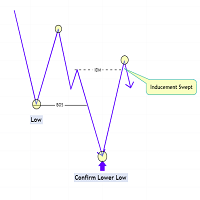
The Market Structure with Inducements & Sweeps indicator is a unique take on Smart Money Concepts related market structure labels that aims to give traders a more precise interpretation considering various factors.
Compared to traditional market structure scripts that include Change of Character (CHoCH) & Break of Structures (BOS) -- this script also includes the detection of Inducements (IDM) & Sweeps which are major components of determining other structures labeled on the chart.
SMC &
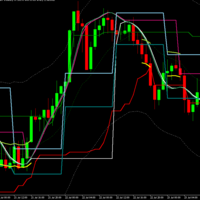
Mega Analyzer MT5 Indicator: A Comprehensive Trading Solution In the dynamic world of trading, having an edge can make all the difference. The "Mega Analyzer MT5 Indicator" offers traders that edge, providing a powerful tool that deciphers market movements with precision and clarity. Designed for both novice and experienced traders, this indicator is tailored to enhance decision-making and optimize trading strategies by revealing key price levels and market conditions that often go unnoticed by
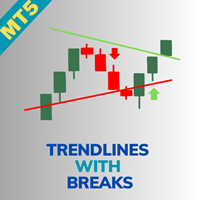
Indicator Name: Trendlines with Breaks [LuxAlgo] Overview: The Trendlines with Breaks [LuxAlgo] indicator provides traders with pivot point-based trendlines that highlight real-time breakouts. This tool is highly customizable, allowing users to adjust the steepness of trendlines, choose different slope calculation methods, and receive alerts on trendline breakouts. Key Features: Pivot Point-Based Trendlines: The indicator automatically generates trendlines based on pivot points, providing a clea
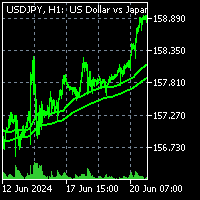
To get access to MT4 version please click here . This is the exact conversion from TradingView: "Liquidity Weighted Moving Averages" by "AlgoAlpha ". This is a light-load processing and non-repaint indicator. All input options are available expect time frame input . Buffers are available for processing in EAs. You can message in private chat for further information/changes you need. Thanks for downloading
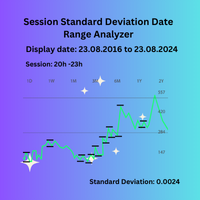
Session Standard Deviation Date Range Analyzer: Evaluate the standard deviation of each bar's price (high, low, close, open, weighted, median, and typical) within defined trading sessions and date ranges, providing detailed insights into price volatility and market behavior. **Note:** When the trading platform is closed, the indicator may not load correctly. To ensure it works, you may need to load the indicator, unload it, and then load it again. **Note:** : This indicator can only be used wit
FREE
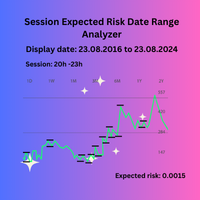
Session Expected Risk Date Range Analyzer: Analyzes price data across specified date ranges to provide detailed insights into financial risk and volatility, using each bar's price metrics for accurate risk assessment.
The Session Expected Risk Date Range Analyzer is a sophisticated tool designed to offer traders and analysts detailed insights into the expected financial risk across specific date ranges. Unlike traditional session-based analysis, this indicator focuses on calculating risk met
FREE

This is a early support and resistance indicator. It will allow you to choose how many candles back. You can use it on all timeframes. Change the color as you like. You can use it with other indicators for better entry prediction it will give you trend for bear market and bull market. It will help you predict sideways market trending market and falling market. Save trading

ATREND: Как это работает и как его использовать Как это работает Индикатор "ATREND" для платформы MT5 разработан для предоставления трейдерам надежных сигналов на покупку и продажу с использованием комбинации методов технического анализа. Этот индикатор в первую очередь использует среднюю истинную амплитуду (ATR) для измерения волатильности, наряду с алгоритмами обнаружения тренда для выявления потенциальных движений рынка. Оставьте сообщение после покупки и получите специальный бонусный подаро

HiperCube AutoTrend Lines Этот индикатор поможет вам легко определить уровни поддержки и сопротивления, нарисовать линии на графике и узнать, где находится важная точка на рынке. Этот инструмент — лучший способ полуавтоматизировать вашу торговлю, выполняя часть работы за вас. Сопротивление или поддержка — важные уровни, которые иногда трудно определить, но теперь это не вызовет у вас еще больше путаницы HiperCube Autotrends предназначен для любого таймфрейма Все виды стратегий, скальпинг, свинг
FREE

Добро пожаловать в HiperCube Renko Candles
Этот индикатор предоставляет вам реальную информацию о рынке, преобразуя ее в стиль Renko Candle.
Определение Графики Renko — это тип финансовых диаграмм, которые измеряют и отображают изменения цен, используя кирпичи (или бары) для представления движения цен. В отличие от традиционных графиков свечей, графики Renko не отображают информацию, основанную на времени, а фокусируются исключительно на колебаниях цен.
Особенности: Индикатор в отдельных
FREE

Финансовый Индикатор SolarTrade Suite: Comet Market Indicator - Ваш Надежный Проводник в Мире Финансовых Рынков!
Это индикатор периодов, который использует особые инновационные и передовые алгоритмы для рассчета своего значения, а также имеет приятный глазу дизайн и имеет дополнительные функции.
Понять показания этого индикатора очень просто: зеленая вертикальная линия - начало нового периода. В качестве дополнительных функций: - несколько раз кликните в верхней половине главного окна графи
Бесплатный индикатор спреда для MetaTrader 5 Этот индикатор предоставляет детальный анализ спреда на MetaTrader 5, одного из важнейших параметров для трейдеров, так как он представляет собой разницу между ценой покупки (Ask) и ценой продажи (Bid) актива. Индикатор включает: Средний спред : Рассчитывается как среднее значение между максимальным и минимальным спредом, наблюдаемым в течение дня. Текущий спред : Отображает текущий рыночный спред. Минимальный спред : Показывает минимальное значение с
FREE

Индикатор "Fair Value Gap" (FVG) - Откройте Мощь Рыночных Дисбалансов Мир трейдинга полон скрытых возможностей, но только те, у кого есть правильные инструменты, могут эффективно их идентифицировать и использовать. Наш Индикатор FVG создан, чтобы помочь вам в этом. Если вы трейдер, стремящийся улучшить свои навыки чтения рынка и находить лучшие точки входа и выхода, Индикатор FVG станет вашим идеальным помощником. Что такое Fair Value Gap (FVG)? Концепция Fair Value Gap относится к разрыву между
Что такое "Schaff RSX"? "Schaff RSX" сочетает в себе эффективность индекса относительной силы (RSX) с точностью цикла Шаффа, создавая уникальный индикатор, который поможет вам легко определить лучшие моменты для входа и выхода с рынка. Это как иметь радар, который обнаруживает скрытые торговые возможности, давая вам конкурентное преимущество, которое другие трейдеры просто не могут себе позволить игнорировать. Почему выбрать "Schaff RSX"? Четкая и интуитивно понятная визуальная простота : Цвета

«HiperCube USD INDEX (DXY /USDX) » — это финансовый бенчмарк, представляющий собой производительность определенной группы активов, таких как акции, облигации или сырьевые товары, стоимость которых выражена в долларах США. Эти индексы помогают инвесторам отслеживать и сравнивать производительность определенных секторов или рынков с течением времени. Выражаясь в долларах США, индекс обеспечивает последовательную меру оценки инвестиций независимо от национальной валюты активов или географического

Добро пожаловать в HiperCube VIX
Этот индикатор предоставляет вам реальную информацию о рынке объема sp500 / us500
Определение HiperCube VIX, известный как индекс волатильности CBOE, является широко признанным показателем рыночного страха или стресса. Он сигнализирует об уровне неопределенности и волатильности на фондовом рынке, используя индекс S&P 500 в качестве прокси для широкого рынка. Индекс VIX рассчитывается на основе цен опционных контрактов на индекс S&P 500.
Особенности: Пользо
FREE

Добро пожаловать в HiperCube DonChian
Этот индикатор предоставляет вам полезную информацию о цене, показывая, куда цена, вероятно, пойдет вверх или вниз.
Особенности: Индикатор в главных окнах Настройте цвета свечей Настройте период индикатора Установите параметры
Как интерпретировать: Восходящий тренд: если некоторые свечи поднимаются выше верхней полосы, это означает, что, возможно, приближается бычий тренд. Нисходящий тренд: если некоторые свечи опускаются ниже нижней полосы, это означ

ADX — очень популярный и полезный индикатор, поэтому многие ведущие трейдеры рекомендуют использовать его в качестве фильтра для плохих сделок или в сочетании с другими видами анализа.
С HiperCube ADX вы получите первоклассный опыт, используя прекрасный и отличный индикатор для своей торговли.
ОСОБЕННОСТИ: Полностью настраиваемый Настройте свой график! Пользовательский цвет для гистограммы В дополнительных окнах для четкого отображения основного графика Для его разработки использовались чат
FREE

HiperCube Market Profile!
Market Profile — это графическое представление, которое объединяет информацию о цене и времени в виде распределения. Он отображает информацию о цене на вертикальной шкале (ось Y) и информацию об объеме на горизонтальной шкале (ось X). Этот тип диаграммы дает представление о рыночной активности, позволяя трейдерам визуализировать и оценивать справедливую рыночную стоимость в режиме реального времени.
Функции: Пользовательские цвета Пользовательский график Четкая инф
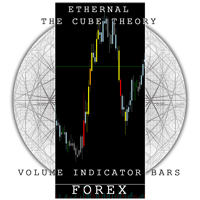
Cube Bars Forex - это индикатор для мета трейдера 5, созданный мной Томасом Лекимом для раскрашивания свечей на основе пиков объема крупных инвесторов на рынке форекс. Он отслеживает пики покупки и продажи и раскрашивает свечи в соответствии с количеством денег, вложенных другими роботами. Это мощный инструмент против больших роботов, потому что он определяет моменты, когда он должен принимать решения. Его можно настроить в соответствии с валютной парой, которую вы будете использовать. Он имеет
The Omega Trend Indicator is an advanced tool that has been specifically designed to detect market trends early, and follow them efficiently. The indicator draws two lines. The main (thicker) Trend Line represents the presumed lower or upper volatility limits of the current market trend. A break in the main Trend Line indicates a potential reversal or shift in the movement of the trend. The Trend Line also indicates the best point to place a stop loss order. In Omega Trend Indicator, the Trend L
FREE

Crash 1000 Scalping Indicator for the Crash 1000 Deriv Synthetic Index. Introduction The Crash 1000 Scalping Indicator is a specialized tool designed for the Crash 1000 index on the Deriv Synthetic market. This indicator is particularly useful for scalping on the M1 timeframe, helping traders to identify precise entry and exit points for buy positions. It is designed to be non-repainting, providing clear signals with audible alerts and push notifications, and is compatible with mobile devices th
Индикатор Подтверждения Входа для MT5: Точное Торговое Решение для Волатильных Индексов Индикатор Подтверждения Входа для MetaTrader 5 (MT5) — это мощный и универсальный инструмент, специально созданный для трейдеров, которые сосредоточены на торговле волатильными индексами. Независимо от того, хотите ли вы заработать на продолжении тренда или определить ключевые точки разворота, этот индикатор предоставляет четкие и действенные сигналы, которые помогут улучшить вашу торговую стратегию. Поддержи

The utility draws pivot levels for the selected timefram in classic method. Pivot = (high + close + low) / 3 R1 = ( 2 * Pivot) - low S1 = ( 2 * Pivot) - high R2 = Pivot + ( high - low ) R3 = high + ( 2 * (Pivot - low)) S2 = Pivot - (high - low) S3 = low - ( 2 * (high - Pivot)) you can change the timeframe, colors and fontsize. also you can change the text for the levels.
Have fun and give feedback...
FREE
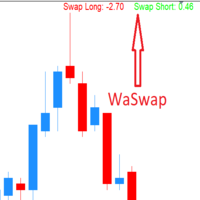
WaSwap MT5 Indicator shows the current Swap Long and current Swap Short with color.
* Set the Swap Threshold and the color to identify when the current swap is below or above the Spread Threshold.
* Set X axis and Y axis and chose the Corner and the Anchor to position the Swap Label on the chart.
* Write the font and the font size for more confort.
* Activate alert if the current Swap Long or the current Swap Short is below the swap threshold.
* The user will never swing with a negati
FREE

YOU CAN NOW DOWNLOAD FREE VERSIONS OF OUR PAID INDICATORS . IT'S OUR WAY OF GIVING BACK TO THE COMMUNITY ! >>> GO HERE TO DOWNLOAD
The Volatility Ratio was developed by Jack D. Schwager to identify trading range and signal potential breakouts. The volatility ratio is defined as the current day's true range divided by the true range over a certain number of days N (i.e. N periods). The following formula is used to calculate the volatility ratio: Volatility Ratio (VR) = Today's True Rang
FREE
BBTrend is a powerful trend analysis tool designed to provide a clear overview of market volatility and trends at a glance.
This indicator calculates the difference between two Bollinger Bands of different periods,
visually indicating the strength of upward or downward trends to traders. Clear Trend Visualization: The upward trend is represented in green, and the downward trend in red,
allowing traders to intuitively grasp the direction and strength of the trend. Standardized Percentage D
FREE
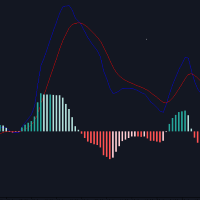
Overview : Introducing the Custom MACD Indicator for MetaTrader 5, inspired by the popular TradingView MACD but enhanced with additional features. This indicator provides traders with more flexibility and better visual cues for decision-making. Key Features : Custom Histogram Colors : Set your preferred color scheme for the MACD histogram to improve visibility and match your trading chart style. Recalculated Histogram Values : Get more accurate signals with our recalculated histogram values, des
FREE
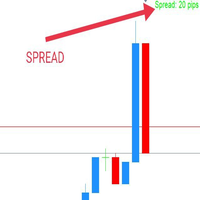
WaSpread MT5 Indicator shows the current spread in pips with color.
* Set the Spread Threshold and the color to identify when the current spread is below or above the Spread Threshold.
* Set X axis and Y axis and chose the Corner and the Anchor to position the Spread Label on the chart.
* Write the font and the font size for more confort.
* Activate alert if the current spread is above the spread threshold.
* For more precision, the user can choose to show the decimal numbers.
* The
FREE
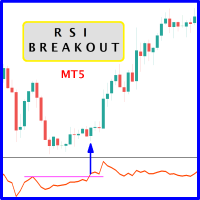
The likelihood of farther price movement increases when Relative Strength Index oscillator "RSI" breaks through its historical resistance levels in conjunction with prices breakout of resistance levels. It's strongly encouraged to confirm price breakout with oscillator breakout since they have comparable effects to price breaking support and resistance levels; similar perception is applied to short trades. Concept is based on find swing levels which based on number of bars by each side to confir
FREE
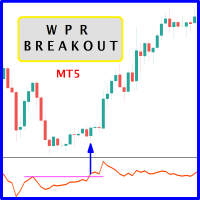
The likelihood of farther price movement increases when Larry Williams Percentage Range oscillator "WPR" breaks through its historical resistance levels in conjunction with prices breakout of resistance levels. It's strongly encouraged to confirm price breakout with oscillator breakout since they have comparable effects to price breaking support and resistance levels; similar perception is applied to short trades. Concept is based on find swing levels which based on number of bars by each side t
FREE
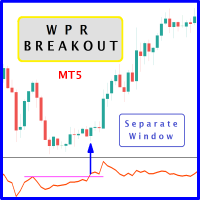
The likelihood of farther price movement increases when Larry Williams Percentage Range oscillator "WPR" breaks through its historical resistance levels in conjunction with prices breakout of resistance levels. It's strongly encouraged to confirm price breakout with oscillator breakout since they have comparable effects to price breaking support and resistance levels; similar perception is applied to short trades. Concept is based on find swing levels which based on number of bars by each side t
FREE

The indicator shows the price or volume in milliseconds, great for identifying entry patterns by price or volume aggression, and fast scalping. Features Timeframe in milliseconds Price aggression oscillator Customizable screen The indicator can indicate entry movements, such as: Crossing with a high slope before the first 500 ticks of the chart Identifying wave patterns
The speed of the chart display will depend on your hardware, the lower the milliseconds the more it will require from the har
FREE
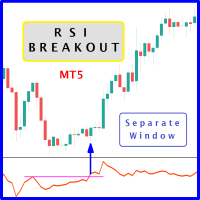
The likelihood of farther price movement increases when Relative Strength Index oscillator "RSI" breaks through its historical resistance levels in conjunction with prices breakout of resistance levels. It's strongly encouraged to confirm price breakout with oscillator breakout since they have comparable effects to price breaking support and resistance levels; similar perception is applied to short trades. Concept is based on find swing levels which based on number of bars by each side to confir
FREE
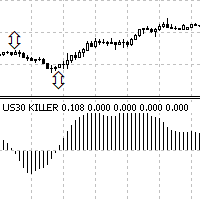
Us30 killer non repaint non repaint (means that the arrows that appear on the chart will not disappear or redraw). Us30 killer consists of 2 black arrows and a histogram. if black arrow appears above the current price look for selling opportunities ( See figure 3) if black arrow appears below current price look for buying opportunities. (See figure 3) The indicator works on all timeframes recommended is M5 TO Monthly Timeframe.
Хотите повысить эффективность вашей торговли на MT5? Представляем сигнальный индикатор, который станет вашим надежным помощником на пути к успеху! Этот уникальный индикатор использует стрелки и меняющую цвета скользящую среднюю, чтобы максимально упростить процесс принятия торговых решений. Когда тренд меняется на восходящий, индикатор окрашивает линию в синий цвет, предупреждая вас о возможном росте цены. Если же тренд разворачивается вниз, линия становится красной, сигнализируя о возможном пад

Adjustable Consecutive Fractals looks for 2 or more fractals in one direction and sends out a on screen alert, sound alert and push notification, for strong reversal points .
Adjustable Consecutive Fractals, shows the fractals on chart along with a color changing text for buy and sell signals when one or more fractals appear on one side of price.
Adjustable Consecutive Fractals is based Bill Williams Fractals . The standard Bill Williams fractals are set at a non adjustable 5 bars, BUT withe
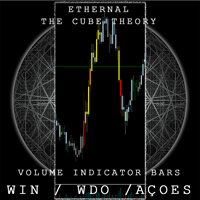
The Cube Bars Brasil pinta os candles de acordo com o volume , excelente para saber os picos de compra e venda . Pode ser regulado livremente pelo usario . Possui regulagem de parametro de entrada para que o usuario tenha a liberdade de regular o colume de acordo com o ativo que escolher . Possui 4 cores que diferenciam os candles de acordo com o tamanho do volume naquele instante
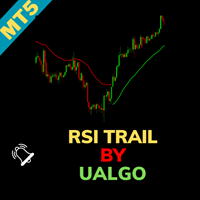
RSI Trail [UAlgo] Indicator for MetaTrader 5 The RSI Trail [UAlgo] indicator is a sophisticated technical analysis tool designed to enhance trading strategies by leveraging the Relative Strength Index (RSI) in conjunction with various moving average calculations. This indicator dynamically plots support and resistance levels based on RSI values, offering clear visual signals for potential bullish and bearish market conditions. Key Features:
Dynamic Support and Resistance Levels: The indicator
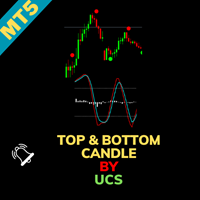
UCS_Top & Bottom Candle Indicator for MetaTrader 5 The UCS_Top & Bottom Candle is an innovative experimental indicator designed for MetaTrader 5. Based on momentum, this indicator identifies the top and bottom candles for most swing movements, assisting traders in making precise market entries and exits. Key Features: Momentum-Based Analysis: Utilizes momentum to detect the top and bottom candles for swing trading opportunities. Customizable Settings: Percent K: Set the Percent K value (default
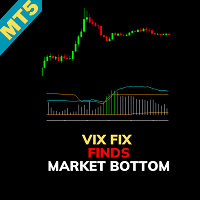
Indicator Name: CM_Williams_Vix_Fix Finds Market Bottoms Overview: The CM_Williams_Vix_Fix Finds Market Bottoms indicator is an advanced tool designed to identify market reversal points across various asset classes. Inspired by the original work of Larry Williams, this indicator provides similar insights to the VIX for stock indices but with the added flexibility of functioning effectively across all asset types. Key Features: Versatility Across Asset Classes: Unlike traditional indicators that
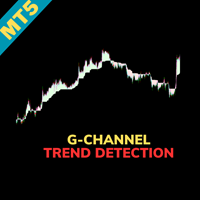
Indicator Name: G-Channel Trend Detection Overview: The G-Channel Trend Detection indicator offers a unique approach to trend analysis, leveraging AlexGrover's G-Channel methodology. This indicator provides a clear and simplified view of market trends by identifying bullish and bearish conditions based on price interactions with the G-Channel boundaries. Key Features: Trend-Based Market Analysis: The indicator determines trend direction by monitoring price action relative to the G-Channel bounda
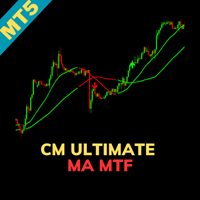
Indicator Name: CM_Ultimate_MA_MTF_V2 - Added Tilson T3 Overview: The CM_Ultimate_MA_MTF_V2 is a powerful moving average indicator that offers a high degree of customization and flexibility for traders. It supports multiple types of moving averages, including the advanced Tilson T3, and provides features such as multi-timeframe analysis, cross detection, and visual highlights. Key Features: Multi-Timeframe Flexibility: The indicator defaults to the current timeframe on the chart but allows users

Session Average Date Range: Analyze and average the low - high of specific trading sessions within custom date ranges, offering insights into price movements and market behavior over selected periods. The "Session Average Date Range" tool is an advanced analytical utility designed to empower traders and analysts by allowing them to dissect and evaluate the high and low range of specific trading sessions within a user-defined date range. This tool provides a flexible and precise approach to analy
FREE

Enhance Your Trading with Buraq Bars Indicator! Take your trading to the next level with Buraq Bars ! This easy-to-use indicator draws bars on your chart whenever the RSI (Relative Strength Index) crosses above or below the levels you choose, giving you clear signals to help you trade better. Key Features: Set Your Own RSI Levels: Choose the levels for overbought and oversold that work best for you. Clear Visual Signals: Bars appear on your chart when the RSI crosses your levels, making it easy
The Day Trading Price Pattern indicator is an indicator of entry points that searches for and displays Price Action system patterns on dozens of trading instruments and on all standard time frames: (m1, m5, m15, m30, H1, H4, D1, Wk, Mn). Show all the main Price Patterns are introduced in the Ebook Day Trading With Price Action - Galen Wood You won't never miss any potential trading setup.
Want to send all the signals to your Telegram Channel? Checkout this guide
Advantages
1. Patterns:
FREE

Introducing the Volume Order Blocks indicator, a game-changing tool designed for traders who demand precision and clarity in their market analysis. This advanced indicator not only identifies order blocks but also integrates crucial volumetric data, allowing you to gauge the strength of these blocks with unparalleled accuracy. MT4 version - https://www.mql5.com/en/market/product/121237/ Key Features of the Volume Order Blocks: Bullish & Bearish Order Blocks: Easily visualize and differentiat

Order block hunter indicator is the best indicator for hunt the order blocks that area where there has been a large concentration of limit orders waiting to be executed Order blocks are identified on a chart by observing previous price action and looking for areas where the price experienced significant movement or sudden changes in direction .This indicator does that for you by using very complicated codes and helps you to take the best areas To buy and sell because it make marks at the best a

Индикатор Haiken Ashi для MT5 Улучшите свой торговый анализ с помощью индикатора Haiken Ashi для MT5. Этот мощный инструмент преобразует стандартные ценовые данные в более плавные, трендовые свечи, что упрощает идентификацию рыночных тенденций и потенциальных точек разворота. Ключевые особенности: Четкая идентификация тренда: Визуально различайте восходящие и нисходящие тренды по различным цветам свечей. Снижение шума: Фильтруйте ценовые колебания, обеспечивая более четкое представление об осно
FREE
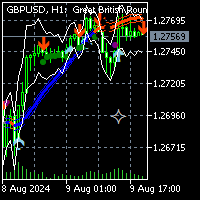
To get access to MT4 version please click here . This is the exact conversion from TradingView: " SSL Hybrid" by Mihkel00.
This is a light-load processing and non-repaint indicator. All input options are available. Buffers are available for processing in EAs. You can message in private chat for further information/changes you need. Thanks for downloading
Индикатор Индекса Силы Валюты (Currency Strength Index - CSI) ПЕРЕД АКТИВАЦИЕЙ ИНДИКАТОРА НЕ ЗАБУДЬТЕ УСТАНОВИТЬ "TRUE" ДЛЯ ОТОБРАЖЕНИЯ ПАР Индикатор Индекса Силы Валюты (Currency Strength Index - CSI) — это мощный инструмент, используемый в торговле на Форекс для измерения относительной силы основных валют. Этот индикатор помогает трейдерам определить самые сильные и слабые валюты в любой момент времени, что позволяет принимать более обоснованные торговые решения. Основные характеристики: Сравн

SuperTrend — это один из самых эффективных и широко используемых технических индикаторов в трейдинге, идеально подходящий для определения направления тренда и генерации сигналов входа и выхода. Этот индикатор основан на волатильности и тренде, динамически адаптируется к рыночным условиям, обеспечивая трейдеров ясной визуальной информацией. Основные характеристики: Обнаружение тренда: SuperTrend следует за рыночным трендом, рисуя линию, которая располагается выше цены в нисходящем тренде и ниже в

Благодаря техническим и логическим манипуляциям брокерской компании, я прошел долгий путь, чтобы вывести этот индикатор, который объединяет многочисленные стратегии, обладающие следующими возможностями:
Определение рыночного тренда: понимание общего тренда рынка.
Точки разворота: определение потенциальных точек, в которых рынок может изменить направление.
Точки входа и выхода: определение оптимального времени для входа и выхода из сделок.
Для полного понимания того, как использовать это
Enhance Your Trading Strategies with the "Order Block" Indicator for MT4 Discover the "Order Block" Indicator: The "Order Block" Indicator for MT4 is designed to help you precisely identify order blocks in the market by marking the highs and lows of the order block candles. This powerful tool enables you to understand where large institutions place their orders, improving your ability to predict market movements. Key Features: Precise Order Block Detection: Automatically highlights the highs and

In the world of trading, the key to success lies in having the right tools at the right time. Our innovative Volume Profile indicator was developed with one goal in mind: to provide traders with unprecedented access to vital market activity information. This cutting-edge tool allows you to not only see where and when volumes are traded but also to understand market depth with clarity never seen before. Main Features: Temporal Flexibility: Set the analysis range up to 1800 minutes to perfectly ma

Maximize Your Trading Opportunities with the "Auto Trendlines" Indicator Discover the "Auto Trendlines" Indicator: "Auto Trendlines" is the essential tool for every technical trader. This indicator automatically plots trend lines, pinpointing support and resistance levels with surgical precision. It's ideal for those looking to capitalize on market breakouts and reversals. Key Features: Automatic Trendline Plotting: Identifies and draws crucial trend lines without manual intervention. Advanced C

Optimize Your Trading Decisions with the "autoFibo" Indicator Discover the "autoFibo" Indicator: "autoFibo" is the essential analysis tool for traders who want to fully leverage Fibonacci levels without the hassle of manual plotting. This indicator automates the Fibonacci retracement process, providing instant visual access to key support and resistance zones. Key Features: Automatic Fibonacci Retracement: Automatically plots Fibonacci levels, making it easy to identify support and resistance zo

Enhance Your Trading Performance with the "Better Volume" Indicator Discover the "Better Volume" Indicator: The "Better Volume" is the essential market volume analysis tool for traders aiming to stand out. It analyzes tick volumes with unprecedented accuracy, featuring an advanced moving average function (PERIOD_MA) and customizable buy and sell alerts. Key Features: Advanced Volume Analysis: Recognize volume peaks signaling crucial price movements. Intuitive Buy and Sell Alerts: Stay one step a

DTFX Algo Zones are auto-generated Fibonacci Retracements based on market structure shifts.
These retracement levels are intended to be used as support and resistance levels to look for price to bounce off of to confirm direction.
USAGE Figure 1 Due to the retracement levels only being generated from identified market structure shifts, the retracements are confined to only draw from areas considered more important due to the technical Break of Structure (BOS) or Change of Character

This indicator identifies and highlights market inefficiencies, known as Fair Value Gaps (FVG), on price charts. Using a custom algorithm, the indicator detects these areas of imbalance where the price moves sharply, creating potential trading opportunities. Indicator Parameters: Bullish FVG Color (clrBlue) : Color used to highlight bullish inefficiencies. The default value is blue. Bearish FVG Color (clrRed) : Color used to highlight bearish inefficiencies. The default value is red. Bullish FVG
FREE
Darvas Flow is a revolutionary trading indicator that combines the classic Darvas Box method with modern market flow analysis. Developed for serious traders, Darvas Flow offers a powerful and intuitive tool for identifying trading opportunities. This indicator has been through backtesting on the XAUUSD M30 pair for 6.5 years. If you are interested, please visit this EA product : https://www.mql5.com/en/market/product/121320
Key Features: Darvas Box Method Implementation : Darvas Flow au
FREE
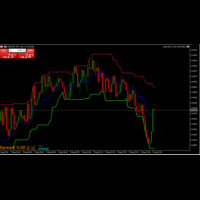
The Donchian Channel Indicator I created is a powerful tool for analyzing price trends and volatility. By plotting the highest high and lowest low over a specified period, it helps identify potential breakout opportunities and trend reversals. This indicator is valuable for traders seeking to understand market dynamics and make informed decisions based on price movements. Its simplicity and effectiveness make it an essential addition to any trading strategy.
FREE

The Market Structure Analyzer is a powerful tool designed for traders who follow market structure and smart money concepts. This comprehensive indicator provides a suite of features to assist in identifying key market levels, potential entry points, and areas of liquidity. Here's what it offers:
1. Swing High/Low Detection : Accurately identifies and marks swing highs and lows, providing a clear view of market structure.
2. Dynamic Supply and Demand Zones: Draws precise supply and demand zo
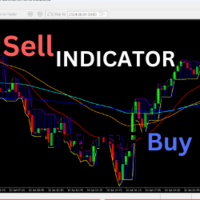
Welcome to a highly versatile and customizable trading indicator designed to elevate your trading strategy. This indicator integrates four moving averages (MAs) and order blocks, providing you with a powerful tool for market analysis and decision-making. Key Features: Four Moving Averages (MAs): This indicator allows you to utilize up to four different moving averages simultaneously. You can adjust each MA's period, color, and style to tailor the indicator to your specific trading needs. Whether
FREE

Overview: The US Dollar Index (DXY) is a key financial indicator that measures the strength of the US Dollar against a basket of six major world currencies. This index is crucial for traders and investors as it provides a comprehensive view of the overall market sentiment towards the US Dollar and its relative performance. All Products | Contact Composition: The DXY's composition is as follows: Euro (EUR): 57.6% Japanese Yen (JPY): 13.6% British Pound (GBP): 11.9% Canadian Dollar (CAD): 9.1%
FREE

Breakthrough signal indicator for the MT5 platform: Your reliable assistant in the world of trading!
We are pleased to present you with an innovative signal indicator, which was created in collaboration with an outstanding mathematician. This indicator combines advanced algorithms and the best of the world of mathematical analysis, providing traders with a unique tool for predicting market movements.
Why is this indicator unique?
1 .Entry signals without redrawing If a signal appears, it
MetaTrader Маркет - лучшее место для продажи торговых роботов и технических индикаторов.
Вам необходимо только написать востребованную программу для платформы MetaTrader, красиво оформить и добавить хорошее описание. Мы поможем вам опубликовать продукт в сервисе Маркет, где его могут купить миллионы пользователей MetaTrader. Так что занимайтесь только непосредственно своим делом - пишите программы для автотрейдинга.
Вы упускаете торговые возможности:
- Бесплатные приложения для трейдинга
- 8 000+ сигналов для копирования
- Экономические новости для анализа финансовых рынков
Регистрация
Вход
Если у вас нет учетной записи, зарегистрируйтесь
Для авторизации и пользования сайтом MQL5.com необходимо разрешить использование файлов Сookie.
Пожалуйста, включите в вашем браузере данную настройку, иначе вы не сможете авторизоваться.