Смотри обучающее видео по маркету на YouTube
Как купить торгового робота или индикатор
Запусти робота на
виртуальном хостинге
виртуальном хостинге
Протестируй индикатор/робота перед покупкой
Хочешь зарабатывать в Маркете?
Как подать продукт, чтобы его покупали
Новые технические индикаторы для MetaTrader 5 - 19
Market Structure Patterns is an indicator based on smart money concepts that displays SMC/ICT elements that can take your trading decisions to the next level. Take advantage of the alerts , push notifications and email messages to keep informed from when an element is formed on the chart, the price crosses a level and/or enters in a box/zone. Developers can access the values of the elements of the indicator using the global variables what allows the automation of trading

Познакомьтесь с мощью индикатора Demark Trends для всестороннего анализа трендов и получения торговых идей. Индикаторы Demark славятся своей эффективностью в оценке рыночных трендов и точек истощения. Наш индикатор Demark Trends переносит этот опыт на новый уровень, автоматически рисуя точные линии тренда на вашем графике. С настраиваемыми параметрами, включая количество свечей в расчетах, настройки сигнала и цвета линий, у вас полный контроль над вашим анализом. Независимо от того, являетесь ли
FREE

Введение индикатора Индикатор разработан по формулам скользящей средней, которая более стабильна и имеет меньшее запаздывание, чем RSI или CCI. Индикатор имеет три значения индикатора, период скользящей средней и цвета линии можно менять вручную. Что может дать вам этот индикатор? Точные сигналы входа: индикатор рисует сигналы со стрелками вверх и вниз. Многопериодный анализ тренда: загрузив этот индикатор на график большого таймфрейма и график маленького таймфрейма, эффект от его использов

Автоматический профиль объема с фиксированным диапазоном с оповещениями для MT5
Этот индикатор показывает, где цена провела больше времени, выделяя важные уровни, которые можно использовать в торговле.
и может отображать плотность цен с течением времени, выделяя наиболее важные ценовые уровни, области значения и контрольное значение данной торговой сессии. Этот индикатор можно прикрепить к таймфреймам между M1 и D1, и он будет показывать профиль рынка для дневных, недельных, месячных или да

Стандартный Индикатор Fractals Bill Williams с возможностью указания количества свечей для формирования. Индикатор работает на любых графиках и таймфреймах.
Настройки: candles -количество свечей слева и справа на основе которых строиться фрактал (в классическом индикаторе это значение всегда 2 )
Контакт: Если у вас возникли какие-либо вопросы или требуется помощь, пожалуйста, свяжитесь со мной через личное сообщение. Автор: Fertikov Serhii, Больше моих индикаторов, советников, скриптов д
FREE

Imbalance / FVG MTF Mark Imbalance on chart of Selected Multi Time frames. Trend is Manually set to filter signals in the chosen direction by a button on the chart. .
Futures Auto Mark Imbalance / FVG on chart on selected time frames
Select time frames by buttons on chart
Popup Alert, Push Notification or email when New Imbalance Form
Popup Alert, Push Notification or email when Imbalance is Taken out
Select Alert Mode to be a single or multiple Imbalance ( OR / AND option ) when Imbalan

Gold TL MTF – это прекрасный биржевой технический индикатор. Алгоритм индикатора анализирует движение цены актива и отражает трендовые линии по фракталам заданного таймфрейма (ТФ).
Преимущества индикатора: И ндикатор выдает сигналы с высокой точностью. Подтвержденный сигнал индикатора не исчезает и не перерисовывается. Торговать можно на торговой платформе MetaTrader 5 любого брокера. Торговать можно любыми активами (валюты, металлы, крипто валюты, акции, индексы и т.д.). Торговать можно на
FREE

Adaptive Moving Average (AMA) — трендовый индикатор, использующий скользящую среднюю и фильтр рыночного шума. Особенностью индикатора являются точки синего и красного цветов, показывающие силу тренда.
Рекомендации по торговле:
Вспомогательный индикатор Определение тренда Определение силы тренда Определение потенциальной точки разворота Главный индикатор Показывает точки входа свинг-торговли Выступает динамической поддержкой и сопротивлением Рекомендации по использованию: Любой инструмент Любой
FREE

The UT Bot Alert Indicator is an advanced technical analysis tool designed to help traders optimize their trading performance. This innovative indicator is based on the proven UT Bot system, which utilizes multiple indicators to deliver accurate signals that can help traders make better decisions. The UT Bot Alert Indicator provides a range of features that can help you stay on top of market trends and capitalize on opportunities. Here are some of its key functionalities: Trend Analysis: The UT

50% Off Today Only! Price Goes Back Up at 11 PM (EST)
uGenesys Volume Indicator: Your Key to Mastering Market Volume Analysis What Traders Are Saying: "A must-have indicator...really a game-changer." – wuzzy66 "Amazing indicator...strongly recommend to beginners." – joinbehar Understanding Market Volume: Volume in the market is a critical indicator of movement and opportunity. The uGenesys Volume Indicator is specially crafted to pinpoint when the market has the most volume, allowing you t

The TTM Squeeze is a trading strategy developed by John Carter of Trade the Markets that uses the combination of Bollinger Bands and Keltner Channels to identify periods of low volatility, followed by periods of high volatility. The strategy is based on the principle that low volatility periods are typically followed by high volatility periods and is used to identify potential trading opportunities. When the Bollinger Bands move inside the Keltner Channels, it is referred to as a squeeze, and i
FREE

Simple ATR (Average True Range) Channel to find your Stop Loss and/or Take Profit. Indicator allows to draw a second multiplier if you need different values for SL and TP. Leave the second multiplier to 0 if not used.
Settings + Length
+ Smoothing
+ Multiplier #1 (default 1.5)
+ Multiplier #2 (set to 0 if not used)
+ High price
+ Low price
+ show price line
+ colors can be changed
Please leave wishes in the comments. Reviews are also welcome.
FREE

Supply and Demand Indicator + FREE Currency Strength Meter ADD-ON Looking for a powerful tool that can help you identify the most reactive zones in the forex market? Our supply and demand indicator for MetaTrader 4 and 5 is exactly what you need. With its advanced algorithms and real-time analysis, this indicator helps traders of all experience levels make informed trading decisions. The supply and demand indicator is a cutting-edge tool that helps traders identify areas where buyers and sellers
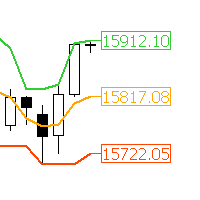
"AV Donchian Channel MT5" is an indicator for MetaTrader 5, which shows the current prices of the donchian channels and the middle line.
Multiple AV Donchian Channel indicators can be placed on one chart. The center line can be used for trailing.
See also Richard Dennis Turtle Trader strategy.
Settings:
- Donchian Channel Period
- Colors and widths of the lines
- Colors and widths of price labels
Please report bugs to me.

You may find this indicator helpfull if you are following a session based strategy. The bars are colored according to the sessions. Everything is customisable.
Settings: + Asia Session: zime, color, high, low + London Session: zime, color, high, low + US Session: zime, color, high, low
Please feel free to comment if you wish a feature and/or give a review. Thanks.
FREE

This Indicator is based on Mr. Dan Valcu ideas.
Bodies of candles(open-close) are the main component used to indicate and assess trend direction, strength, and reversals.
The indicator measures difference between Heikin Ashi close and open.
Measuring the height of candle bodies leads to extreme values that point to trend slowdowns. Thus quantifies Heikin Ashi to get earlier signals.
I used this indicator on Heiken Ashi charts but, it's possible to choose to calculate Body size based on
FREE

A pivot point is an intraday technical indicator used to identify trends and reversals mainly in equities, commodities, and forex markets . Pivot points are calculated to determine levels in which the sentiment of the market could change from bullish to bearish, and vice-versa.
the swing daily is an advanced pivot points indicator that grants the user control over many aspects of the trading levels that you'll get familiar with in the controls section it's used mainly to locate intraday

INTRODUCTION The Fib Autotrendline is a basic tool that analysts use to find out when a security's trend is reversing. By determining the support and resistance areas , it helps to identify significant changes in price while filtering out short-term fluctuations, thus eliminating the noise of everyday market conditions. It is an excellent tool for any trader who follows indicators that use swing highs and swing lows . How to Use the fib Auto Trendline Indicator The Fib Auto Trendline

Versus USD рассчитывает изменение цены каждой основной валюты по отношению к доллару США и отображает ясное и сравнительное представление их производительности для каждого периода или бара, индексируемого курсором в текущем временном интервале диаграммы с полосами прогресса. Кроме того, он помечает стрелкой бар/период, где данная валюта испытала наибольшее или наименьшее изменение курса по сравнению с другими валютами, тем самым обеспечивая более точную оценку производительности валюты. Доллар С

Это индикатор торговых сессий который может отображать все уровни ( Open-High-Low-Close ) для четырех сессий. Сессии могут быть нарисованы линиями или с заливкой как свечи, линии могут быть продлены до следующей сессии. Вы можете легко скрывать/показывать каждую сессию нажатием на горячие клавиши. Также вы можете видеть ASR (средний диапазон сессий) (горячая клавиша по умолчанию «A»). Это похоже на расчет ADR, только он рассчитывается на основе последних X-сессий, что позволяет увидеть пот

Introducing our A.I Currency Strength Meter Forex Indicator, a state-of-the-art tool designed to provide forex traders with real-time insights into the strength of various currencies. Leveraging the latest advancements in artificial intelligence and machine learning, this innovative indicator analyzes market data in real-time, providing users with accurate and up-to-date information to inform their trading decisions. In addition to its cutting-edge algorithms, the Currency Strength Meter For

The HighsAndLowsPro indicator for MetaTrader 5 marks local highs and lows in the chart. It distinguishes between weak and strong highs and lows. The line thicknesses and colours can be individually adjusted. In the default setting, the weak highs and lows are displayed thinner, the strong ones thicker. Weak highs and lows have 3 candles in front of and behind them whose highs are lower and lows are higher. The strong highs and lows have 5 candles each.
FREE
Интеллектуальный индикатор ZigZag. Имеет всего две настройки. Чем выше значения, тем более значимые экстремальные значения показывает. Область применения. Для определения тренда. Направление рисования линии. Для распознавания многочисленных паттернов. Если наложить два индикатора на один график с быстрыми и медленными значениями. Изменив цвет одного из них, то очень хорошо можно разложить движение цены на волны. Индикатор может оказаться отличным помощником для разметки графика и обозначения к
Add an image or logo on a chart. Parameters: "File name for On mode" - location of image file depending MQL5 folder. "Background object" - set the logo as a background object. “x”, “y” – coordinates on the chart, from which the logo shows. If you want to delete the logo, just remove ea from the chart. The suggested resolution for the image is 200x200 pixels. You can use this ea while recording a video.
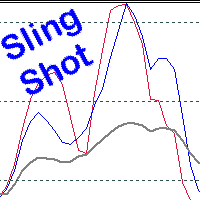
Scalping, Mean reversion or Position trading strategy
Get into an established trend on a pullback in the market. Use the Pinch in the indicator for profit taking. Use the Pinch as a mean reversion strategy, scalping back to a moving average line.
Input Parameters Fast Sling Shot configuration. Slow Sling Shot configuration. Dual Sling Shot configuration. Price line configuration. Trigger zones or levels. Example of Sling Shot trade idea: Price line sets the mood, below the baseline level (5

HighQualityMap是一个很好的中长线交易指示器,这个指标可以单独使用,尤其是用在M30或者大于M30的时间框架下,它能很好的体现出趋势的走向,以及转折点,你可以很快的从这个指示器上寻找到最佳的buy和sell位置,同时也能很好根据指示器去坚守自己的持仓定订单。指标不含有未来函数,不会重新绘制,不仅能够应用到自己的手动交易过程中,还能完全可以写入到自己的EA中。(如果你感觉到这个指标能够帮助你进行更准确的交易,请帮忙给个好评,希望我的作品能够帮助更多有需要的人) ===================参数列表===================== 所有参数均采用默认参数即可,无需更改,若为激进型交易者,可以根据自己的需要来调整参数。 =================参考使用方法=================== 此指标可以适用于任何交易品种,使用周期框架大于M30相对更准确。

If you are using naked eyes to find candlestick patterns on your chart it's a good thing but it requires your time and attention and still you miss some patterns here and there. Don't worry! This indicator will help you to find "Harami Candlestick Pattern" on your chart very easily. *Note: Default inputs are set for EURUSD H1 (1 hour) timeframe. This is an alert system which gives you alerts whenever harami candlestick pattern happens. Types of alerts it can give you are: 1. Audible Alerts - Thi
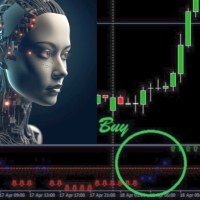
Introducing Trend Fusion 444F, a powerful MQL4 indicator designed to determine market direction using multiple trading indicators. This comprehensive tool offers a unique fusion of technical analysis techniques that help traders make informed decisions in various market conditions. Key Features: Comprehensive Analysis: Trend Fusion 444F combines several widely-used trading indicators to provide a multi-dimensional view of the market. The indicators include Moving Averages, MACD, RSI, DeMarker,

"Индикатор "BIG FIGURE INDICATOR" автоматически идентифицирует и рисует горизонтальные линии на графиках цен на определенных уровнях, таких как целые числа или половинные числа (например, 1,0000 или 1,5000 в валютной торговле). Эти уровни считаются психологически значимыми, поскольку они представляют собой округленные цифры, на которые могут сосредоточиться крупные трейдеры и инвесторы, что может привести к потенциальным уровням поддержки или сопротивления. Этот индикатор может помочь трейдерам
FREE

Это четкий индикатор для оценки максимумов и минимумов, и он хорошо работает для колеблющегося рынка.
Акционная цена 49$ → 59$
функции хорошо оценивает верх и низ Без перерисовки, без дрейфа Быстрый расчет, без задержек Богатый режим напоминания Можно настроить несколько параметров и цветов
параметр "======== Главная ========" HighLowPeriod1 = 9 HighLowPeriod2 = 60 HighLowPeriod3 = 34 HighLowEMAPeriod = 4 MASignalPeriod = 5 "======== Уведомить ========" UseAlertNotify = истина; UseMetaQuo
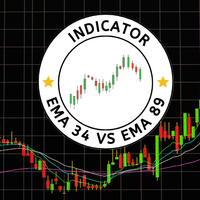
Индикатор "EMA43 vs EMA89" является мощным инструментом для трейдеров, которые ищут возможности для выявления разворотов тренда и потенциальных сделок. Этот индикатор отображает два скользящих средних, EMA34 и EMA89, на графике. Когда эти скользящие средние пересекаются, генерируется сигнал на покупку или продажу, указывая на потенциальное изменение направления тренда. Особенности: Прост в использовании: Просто добавьте индикатор на свой график и начните получать сигналы, когда EMA34 и EMA89 пер

Представляем RSIScalperPro - революционный индикатор на основе RSI для MetaTrader 5, специально разработанный для скальпинга на графике одной минуты. С RSIScalperPro у вас будет мощный инструментарий для точных сигналов входа и выхода, чтобы повысить вашу торговую эффективность. RSIScalperPro использует два различных индикатора RSI, которые предоставляют четкие сигналы для уровней перекупленности и перепроданности. Вы можете настроить временные периоды и ограничительные значения двух RSI в соот

The Nadaraya Watson Envelop indicator for MT5 is a popular tool used by traders to identify trends and potential buy/sell signals. The indicator is based on a non-parametric regression model that uses kernel smoothing to estimate the underlying trend of the market. The resulting envelopes are then plotted around the trend line, providing traders with an indication of where prices are likely to fluctuate. One of the key features of this indicator is its ability to send alerts, emails, and notific

Индикатор ICT Implied Fair Value Gap (IFVG) является важной составляющей частью системы Smart Money Concepts (SMC). Он ищет и показывает на графике современный паттерн - Разрыв справедливой стоимости ( FVG ). Этот паттерн представляет собой формирование дисбаланса трех свечей, которое основано на обнаружении несоответствия между спросом и предложением. Так получается, когда цена быстро движется в одном направлении, не встречая сопротивления. В результате образуется разрыв, "гэп", который может б

This Indicator is based on the Indice gaps between todays open price and yesturdays closing price. On Metatrader these are not shown as we only see a 24hr chart. If we want to know the gap between the open at 16:30 and yesturdays close at 23:30 on the SP500 this EA will reveal the gap. On Indices these types of Gap close approximately 60% of the time within the same day and is demonstrated on the panel which records previous gap closures and provides to the user a statistical proof of gaps clos

You can change the time period of the chart at the touch of a button. You can also change multiple charts at the touch of a button. You can also change multiple charts at the touch of a button, saving you the trouble of changing time periods.
We are live-streaming the actual operation of the system. Please check for yourself if it is usable. Please check it out for yourself. https://www.youtube.com/@ganesha_forex
We do not guarantee your investment results. Investments should be made at y

AutoScroll automatically scrolls the chart by the set width (pips). You can see the next milestone without having to operate the chart yourself. You can concentrate on trading.
We are live-streaming the actual operation of the system. Please check for yourself if it is usable. Please check it out for yourself. https://www.youtube.com/@ganesha_forex
We do not guarantee your investment results. Investments should be made at your own risk. We sharll not be liable for any disadvantage or damage

The time until the end of the bar is counted down. Therefore, you can time your order while watching the chart. You can concentrate on your trading.
We are live-streaming the actual operation of the system. Please check for yourself if it is usable. Please check it out for yourself. https://www.youtube.com/@ganesha_forex
We do not guarantee your investment results. Investments should be made at your own risk. We sharll not be liable for any disadvantage or damage caused by the use of the in

Fibonacci automatically draws Fibonacci retracement, Because Fibonacci automatically draws Fibonacci retracement, you can know at a glance the price to buy at a push or sell back. Therefore, you can trade in favorable conditions in a trending market.
We are live-streaming the actual operation of the system. Please check for yourself if it is usable. Please check it out for yourself. https://www.youtube.com/@ganesha_forex
We do not guarantee your investment results. Investments should be mad

The system automatically draws resistance and support lines, The system automatically draws resistance and support lines, so you can see at a glance the price range where you are most likely to encounter resistance. Therefore, you can trade in price zones where you are less likely to encounter resistance.
We are live-streaming the actual operation of the system. Please check for yourself if it is usable. Please check it out for yourself. https://www.youtube.com/@ganesha_forex
We do not guar

The TrendLinePro indicator for MetaTrader 5 creates a trend line based on the last candle highs and lows. The number of candles to be used to determine the direction can be selected yourself. The trend line can also be used to set an SL. Changes in trend directions can optionally be displayed with an arrow. Input Parameters: Number of Candles for Distance: 3 Display Direction Changes Arrows: false

An indicator based on support and resistance levels with many signals (per candle) Can be used in all time frames Can be used in all symbol Blue lines: upward trend. Red lines: downward trend
How It work: This indicator gives signals based on support and resistance levels as well as some complex calculations. Based on past data
As you know, one of the most important trade options are support and resistance levels.
Get good signals using this indicator.
How To work: Run the indicator.

Indicator details The Moving Average Retracement Boundaries(M.A.R.B) shows the average retracement level above or below the given moving average.It shows the first upper boundary (which is the average retracement above the moving average ),the second upper boundary (which is double the first upper boundary),the first lower boundary (which is the average retracement below the moving average) and the second lower boundary (which is double the first lower boundary).
How to use it 1.It can be used
FREE

BestPointOfInitiation是一个很好的短线交易指示器,能与 ShortBS ( https://www.mql5.com/zh/market/product/96796 )完美的配合,可以很好的指出最佳的buy和sell位置,指标不含有未来函数,不会重新绘制,不仅能够应用到自己的手动交易过程中,还能完全可以写入到自己的EA中。(如果你感觉到这个指标能够帮助你进行更准确的交易,请帮忙给个好评,希望我的作品能够帮助更多多有需要的人) ===================参数列表===================== fastPeriod: 9 slowPeriod:30 PassivationCoefficient:5 =================参考使用方法=================== 此指标可以适用于任何交易品种,能够用在任何周期。

Displays symbol tabs for easy access when trading, symbols that are coloured are symbols you have trades running on.
The indicator immediately shows the specified currency pair in the open window after clicking it. You no longer need to open a new window to view each chart thanks to the indicator. Additionally, it enables traders to concentrate on their trading approach by just keeping a small number of charts displayed.
FREE

it depends on ATR period to get swing points to help make better trading decisions blue dot and red dot is the default color scheme of course you can change it later if you'd like you can change the following : ATR PERIOD sending notifications number of times to send notifications sending notifications to your smart phone that's it very simple to use just drag and drop and follow the trend

it depends on channels and moving average in sketching the chart in two colors the default colors are gold and light blue to highlight the area of downtrend and the area of uptrend TO ADJUST THE INDICATOR YOU CAN CHNGE THE FOLLOWING: 1- the look back period which affects the length of the moving average 2- the multiplier which affects the point of swing in the trend 3- the channel shift which affects how close the line is moving to the price the default settings are the best for the indicator B
This is a modern MACD indicator based on regular MACD indicator. It also has alert system included. This indicator gives you alerts when base line of MACD indicator crosses above or below Zero level so you can look for Buy or Sell opportunity. Available Alerts: 1. Audible Alerts on Chart / Trading Terminal window. 2. Alerts on your email. 3. Alerts on your mobile phone. Type of Alerts Explained: 1. Audible_Chart_Alerts - Audible alerts and Popup message on your computer’s tr
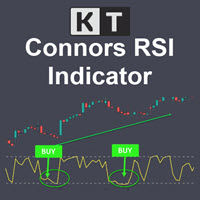
KT Connors RSI is a modified and more advanced version of the original Connors RSI developed by Larry Connors. It was designed to help traders generate trade signals based on short-term price movements.
The Connors combine the standard RSI calculation with two additional elements: a short-term RSI, ROC, and a moving average.
Features Provides more transparent and more actionable buy and sell signals using the overbought/oversold zones. Incorporates short-term RSI and moving average, provid

Slopes are an increasingly key concept in Technical Analysis. The most basic type is to calculate them on the prices, but also on technical indicators such as moving averages and the RSI.
In technical analysis, you generally use the RSI to detect imminent reversal moves within a range. In the case of the Blue indicator, we are calculating the slope of the market price and then calculating the RSI of that slope in order to detect instances of reversal.
The Blue indicator is therefore used

Экономьте время и принимайте более точные решения с закрепленными VWAP Если вы хотите испытать мощь этого инструмента, вы можете скачать бесплатный индикатор закрепленных VWAP для MT5 . Помимо того, что этот индикатор работает независимо, он также является расширением для бесплатной версии Sweet VWAP. Это потому, что, когда вы кликаете на бесплатную версию, тот VWAP, который вы видите на указателе мыши, будет закреплен. И для лучшего понимания, тот, кто будет закреплен там, - это этот индикатор

Добро пожаловать в индикатор Twin Peak MT5 --(Двойная вершина/ Двойная дно)-- Индикатор «Двойная вершина и дно» — это инструмент технического анализа, предназначенный для выявления потенциальных моделей разворота на рынке.
Он определяет области, где цена сделала два последовательных пика или впадины почти одинаковой высоты, за которыми последовало движение цены в противоположном направлении.
Этот паттерн указывает на то, что рынок теряет импульс и может быть готов к развороту тренда. *Свяж
ICT Template Indicator visualizes and automatically updates all important ICT elements for Scalpers, Day and Swing traders. It allows you too keep your chart clean and bring any elements by just one click to the buttons. Thanks to mobile notifications on external liquidity levels, you will not miss any opportunity and you don't have to sit behind the screens whole day. Each element has fully customizable colours, width, line types, max timeframe to be shown etc... so you can really tweak your ch

Мультивалютный и мультитаймфреймовый индикатор Heikin Ashi. Отображает текущее состояние рынка. На панели вы можете видеть направление, силу и количество баров текущего тренда. Также, с помощью цвета, отображаются свечи консолидации/разворота цены. В параметрах можете указать любые желаемые валюты и периоды. Также индикатор может отправлять уведомления при изменении тренда или появлении разворотных и прорывных свечей. По клику на ячейке будет открыт данный символ и период. Heikin-Ashi — японский

Этот индикатор предназначен для определения времени наибольшей торговой активности внутри дня. После этого вычисления индикатор строит наиболее значимые торговые уровни. Сравнение этих уровней с реальным движением цены может дать информацию о силе и направлении рыночных тенденций.
Особенности работы индикатора Таймфрем должен быть ниже D1. Рекомендуемые таймфреймы: M15, M30 и H1. Таймфреймы выше H1 могут дать слишком грубую картину. А использование таймфремов ниже M15 может привести к появлен
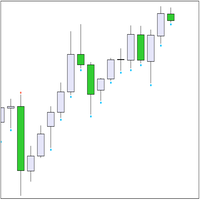
The trend indicator "Trend Two Moving Average" uses two types of Arrow to display calculation results - these are "Trend UP" and "Trend DN". Arrows "Trend Up" are drawn By price 'Low' bar , A Arrows "Trend DN" - By price 'high'. The trend search algorithm is based on the analysis of the price of a bar and the values of two 'Moving Average' indicators. The trend direction is calculated on the current (zero) bar. Therefore, it is

A heatmap is a graphical representation of data in two dimensions, using colors to display different factors. Heatmaps are a helpful visual aid for viewers, enabling the quick dissemination of statistical or data-driven information. The MP Heatmap indicator provides a graphical representation of the relative strengths of major currencies compared to others, organizing data from pairs into color-coded results and producing a clear overview of the entire Forex market. The MP Heatmap indicator dis
FREE

uGenesys AI - 90% Accurate Daytrading Indicator
Introducing the ultimate forex trading indicator system, uGenesys AI, powered by cutting-edge AI technology and advanced analytical techniques, including Time-Series Analysis and Genetic Algorithms. Our AI-powered trading system leverages the power of time-series analysis to identify trends and patterns in historical price data, allowing traders to make informed predictions about future market movements. By analyzing vast amounts of data, our sys

Introducing "Congestion Breakout MT5" - the indicator that helps you identify congestion zones in your chart and alerts you when the price breaks through them. Traders know that congestion zones can be key areas of price action and can indicate potential turning points in the market. However, spotting these zones and anticipating breakouts can be a difficult and time-consuming task. That's where "Congestion Breakout" comes in. This powerful indicator uses advanced algorithms to analyze the pri

To get access to MT4 version please click here . This is the exact conversion from TradingView: "SwingArm ATR Trend Indicator" by " vsnfnd ". Also known as : "Blackflag FTS" by "Jose Azcarate" This is a light-load processing and non-repaint indicator. All input options are available except multi time frame. Buffers are available for processing in EAs. Extra option to show buy and sell signal alerts. You can message in private chat for further changes you need.

The euro index (Euro Currency Index, EURX) is an average indicator of changes in the exchange rates of five currencies (US dollar, British pound, Japanese yen, Swiss franc and Swedish krona) against the euro. Displays a Eur X chart in a seperate window below the main chart. YOUR BROKER MUST HAVE THESE SYMBOLS FOR THE INDICATOR TO WORK Based on EUR/USD, EUR/JPY, EUR/GBP, EUR/CHF and EUR/SEK All these pairs must be added to Market Watch for the indicator to work correctly As this is calculated usi
FREE
This is a simple arrow system based on MACD indicators Main/Base line and MACD Levels. It gives you alerts when MACD's Main Line crosses above/below certain level. Which type of alerts available? 1. It paints on chart Up/Down Arrows. 2. Popup message and sound alert in trading terminal window. 3. Push notification or Alert on your android and ios mobile phones (requires MT4 or MT5 app installed!)

Simple supply and demand indicator which should help identify and visualize S&D zones. Settings:
Color for supply zones, color for demand zones - default colors are set for dark (black) background.
Number of how much zones should be created above and below current price - value "3" means there will be 3 zones above current price and 3 zones below current price. Principle:
When price creates "V", reversal zone is registered. Rectangle filled based on zone type (supply / demand) is drawn if pri

This is a simple arrow system based on Engulfing Candlestick Pattern. It gives you alerts on your smartphone when there is an engulfing candlestick pattern happens. Which type of alerts available? 1. It paints on chart Up/Down Arrows. 2. Popup message and sound alert in trading terminal window. 3. Push notification or Alert on your Android and IOS mobile phones (requires MT4 or MT5 app installed!) *Note: Use it on higher timeframes like H4 (4 hours), D1 (1 Day) then find trade opportunities on s

Displays trends in current chart. You can display trends of multiple timeframes in one chart by inserting this indicator as often as you want. Key features: displays trend line by finding highs and lows counts number of high/low of current trend in different color (long/short) allows you to display multiple timeframe trends in one chart Settings: Indicator Name: if you want to show M5 and H1 on one chart add TITrend twice to your current chart and rename M5 to "TITrendM5" and H1 to "TITrendH1" C

Визуальный стиль полос VWAP 1.0 Индикаторы финансового рынка являются важными инструментами, используемыми трейдерами и инвесторами для анализа и принятия решений на финансовых рынках. VWAP и полосы Боллинджера — два популярных инструмента технического анализа, которые трейдеры используют для измерения рыночных тенденций и волатильности цен. В этом продукте мы предлагаем объединить два индикатора для создания уникального продукта, обеспечивающего всесторонний анализ рыночных тенденций и волатил
Очень простой но эффективный индикатор.
В основе лежит линия KijunSen индикатора Ichimoku, на которой построена скользящая средняя МА. Сигналы на покупку или продажу возникают в моменты пересечения этих двух линий. Я часто использую линию KijunSen индикатора для своей торговли: когда цена находится ВЫШЕ этой линии, я сосредотачиваюсь исключительно на ПОКУПКАХ, в то время как при её положении НИЖЕ — на ПРОДАЖАХ. Кроме того, после усреднения линии KijunSen и создания скользящей средней Kijun

Индикатор реального волчка
Он обнаруживает точную волчку на графике со сбалансированным соотношением высоты тела и фитиля, что является истинным значением волчка, которое отличает его от Молотов и Доджи или Нулевой свечи.
Этот индикатор отображает иконку с крыльями на количестве волчков, найденных на графике.
Настройки включают
Количество баров: настроить поиск по количеству баров.
Цвет значка: изменить цвет значка
Код значка: изменить код крыла для значка
FREE

CZSC Индекс фрактального типа
Функции:
Проведена тщательная обработка отношения включения
Удобно использовать вызов советника, чтобы определить, является ли это классификацией верх-низ, и статус в «Учимся торговать акциями 93: взаимосвязь между двумя таблицами и внутренней частью структуры тренда 2»
Показать классификацию сверху вниз со стрелками
Покажите возможные ручки разными цветами
Отношение включения двух соседних K-линий дает определение: все высокие и низкие точки K-линии на

** All Symbols x All Timeframes scan just by pressing scanner button ** *** Contact me to send you instruction and add you in "Channel Scanner group" for sharing or seeing experiences with other users. Introduction: The Channel pattern is described as the area located between two trend lines. This area is used for a measure of a trading range. In this case, the upper trend line connects price highs while the lower trend line connects price lows. Also when it comes to breakout points, it
MetaTrader Маркет предлагает каждому разработчику торговых программ простую и удобную площадку для их продажи.
Мы поможем вам с оформлением и подскажем, как подготовить описание продукта для Маркета. Все продаваемые через Маркет программы защищаются дополнительным шифрованием и могут запускаться только на компьютере покупателя. Незаконное копирование исключено.
Вы упускаете торговые возможности:
- Бесплатные приложения для трейдинга
- 8 000+ сигналов для копирования
- Экономические новости для анализа финансовых рынков
Регистрация
Вход
Если у вас нет учетной записи, зарегистрируйтесь
Для авторизации и пользования сайтом MQL5.com необходимо разрешить использование файлов Сookie.
Пожалуйста, включите в вашем браузере данную настройку, иначе вы не сможете авторизоваться.