Смотри обучающее видео по маркету на YouTube
Как купить торгового робота или индикатор
Запусти робота на
виртуальном хостинге
виртуальном хостинге
Протестируй индикатор/робота перед покупкой
Хочешь зарабатывать в Маркете?
Как подать продукт, чтобы его покупали
Новые технические индикаторы для MetaTrader 5 - 15

MT4 Version Understanding market sentiment is a critical aspect of successful trading. Market sentiment refers to the overall feeling or attitude of traders and investors towards a particular financial instrument, such as a stock, currency pair, or cryptocurrency. It is a collective perception of market participants' emotions and beliefs about the asset's future price direction. Market sentiment can be bullish (positive), bearish (negative), or neutral (sideways). Knowing the market sentiment ca
ボリンジャーバンドは、価格変動を分析するためのテクニカル分析の1つのツールになります。
ボリンジャーバンドには、中心線と2つのバンドがあります。
中心線は、一般的には移動平均線(通常は20日間の単純移動平均)として計算されます。この中心線は、一定期間の価格の平均値を表しています。 ボリンジャーバンドのバンドは、中心線の上と下に等間隔で配置されます。通常は中心線から2つの標準偏差分だけ離れた位置に設定されます。 拡大(Expansion)とは、ボリンジャーバンドが広がる状態を指します。
つまり、上下のバンドが中心線から離れ、価格の変動範囲が広がっていることを示します。拡大は、相場が活発になり、価格の大幅な変動が起こりやすいことを示すことがあります。 収縮(Contraction)とは、ボリンジャーバンドが狭くなる状態を指します。
つまり、上下のバンドが中心線に近づき、価格の変動範囲が狭まっていることを示し、相場が方向感を失い、一時的に価格変動が鈍化していることを示すことがあります。 ボリンジャーバンドの収縮と拡大は、価格変動のパターンや相場の特徴を捉えるために重要な指

C300 SYNTHETIC INDICATOR 1MIN CHART Update V2 No repaint
*The indicator will not give a sell sign if the market conditions are not in place. *With all 3 strategy criteria in place the strategy based indicator signals 1-3 trades per day. *The drawdown can range to very high you need to place your own target profit and stop loss according to your risk management system . *The indicator is designed for only C300 and the 1min chart .
NB :Note this strategy based indicator will be free only f
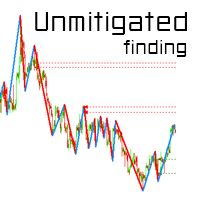
SMC Unmitigated Finding is a indicator for find unmitigated supply and demand in previous legs of price
Settings Zigzag Settings ZZDepth - by Default is 12.
ZZDeviation - by Default is 5.
ZZBackStep - by Default is 3. Horizontal Line Settings SupportColor- color for Support line.
ResistanceColor - color for Resistance line. Settings Num of Show - Number of Support & Resistance Show.
Crash 500 indicator Update V2 No Repaint
This indicator works with a custom build in strategy The indicator will only give a sell sign when market conditions are in place. Only for sell. Apply own risk management target profit and stoploss. When market conditions are met the sell sign will indicate you to enter a sell position and you will have to apply your risk management system accordingly. This is only for Crash 500 market and only 1min chart
NB: Please note this indicator will be fr
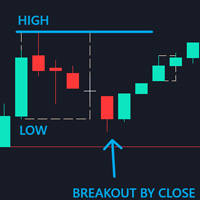
Control Candle is the candlestick which holds multiple inside bars and are in control until its high low range is broken by close of any candlestick. When control candle is broken, price may act on these control candle as support and resistance.
This indicator create rectangles on chart which will help you find control candles fast.
Control candle indicator box is customizable by color, style, width and other options in indicator settings.

3 candel indicator in 1 !!! The 3 most important candel indicator in 1 packadge. Help trader in chart visualisation, prevent reversal !!! Doji : Gravestone Doji, Long Legged Doji, Dragonfly Doji. Engulfing : Bullish, Bearish. Hammer : red hammer, green hammer. Fully parametrable indicator icon color config and alarm. Free life time update !!! Just try our demo for free.

Представляем Didi Index Volume - технический индикатор анализа, разработанный бразильским трейдером Одиром Агуиаром, который отличается передовым и мощным подходом к выявлению возможностей на финансовом рынке. Доступный на различных платформах, Didi Index Volume стал неотъемлемым инструментом для трейдеров, ищущих точные инсайты и ценную информацию для своих торговых стратегий.
Индикатор объединяет известный Didi Index, созданный Одиром Агуиаром, с интеллектуальным использованием объема торго

Introducing the Kangaroo Hunter - Your Ultimate Edge in Forex Trading ATTENTION Forex Traders! Are you in constant pursuit of high-probability trade setups? Or maybe you're a novice trader struggling to pinpoint precise entry and exit points? Our solution, the Kangaroo Hunter, is about to revolutionize your trading journey. This meticulously designed indicator simplifies and refines the art of identifying the often elusive Kangaroo Tail patterns in the Forex market, pushing your trading strateg

Introducing the "Cybercycle Trend" Forex Oscillator, a powerful technical indicator designed to enhance your trading experience in the foreign exchange market. This innovative tool utilizes advanced algorithms to identify and analyze market trends, providing you with valuable insights and helping you make informed trading decisions.
The Cybercycle Trend Forex Oscillator is specifically designed to detect and measure cyclical price movements in the forex market. By incorporating this oscillato
FREE

To get access to MT4 version please click here . - This is the exact conversion from TradingView: "CM Super Guppy" by "FritzMurphy" - This is a light-load processing indicator. - This is a non-repaint indicator. - This is not a multi time frame indicator. - Buffers are available for the lines on chart. - You can message in private chat for further changes you need. Thanks for downloading
MT5インジケータ TC-Alerts 開発経緯:
実はFXで簡単に勝てる手法があるんです。 それは。。。 主要な(4時間足以上、4時間足、日足、週足)のレジスタンスとサポートラインの反発を狙う FXは一方向には進まず90%以上で 必ず、必ずと言っていいほど、 どこかで反発します 。そこは大抵主要なレジスタンスとサポートラインまたは主要なフィボナッチラインなのです。
なのでそこに水平線を引いて ただ待つ のです。そこに到達したら、1分足や5分足に落として
長いヒゲ、ダブルボトム、ダブルヘッド、トリプルボトム、トリプルヘッド、三尊、逆三尊などの反転の形成を確認してエントリーする。 または、こちらを使用して
https://www.mql5.com/ja/market/product/53987
強弱が弱くなってきたのを確認してエントリーすればいいのです。
これだけです。シンプルです!!
うまく行くと、長期足レベルでレジスタンスとサポートライン間、つまり頭から尻尾まで取れる可能性もありますし、リスクリワードが異常にいいです。
そのためには、チャートに主要なレジスタンスと

Calculates the price change on each timeframe: floating or last closed bars.
My #1 Utility : includes 65+ functions | Contact me if you have any questions | MT4 version You can select the shift of the calculated basr: Floating (current) bars; The last closed (previous) bars; The type of price value can be selected using the blue switch on the top row: Pips; Market points; Percentage value (%); Price value; The method of calculating the bar size can be selected using the b
Market screener: Spread and Swap, for selected Symbols. You can customize the list: set only the Symbols (currency pairs) that are needed. The number of Symbols is unlimited. The list can be sorted in ascending or descending order (Symbol name). The panel can be moved to any place on the chart. You can also minimize the panel. Displayed values: Current market price (BID); Spread size; Swap, for Long positions; Swap, for Short positions; Overall P/L of the entire account; My #1 Utility : includ
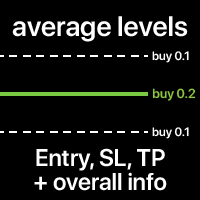
The average Entry, SL and TP levels of all trades on the Symbol. The levels can be calculated together, or separately for Buy and Sell trades. You can optionally display additional info: Level price, total Lot size, floating P/L. The styles and colors of the levels are customizable. My #1 Utility : includes 65+ functions | Contact me if you have any questions | MT4 version In the settings of the indicator, you can configure: Average Entry level: on/off; Average SL level: on/off; Average

Meet the Tweezer Hunter, an essential tool for every Forex trader looking to make accurate, trend-following trades. This powerful, intuitive indicator helps traders spot potential trend reversals before they happen, providing a significant advantage in the fast-paced world of Forex trading. The Tweezer Hunter is more than your average tweezer candle indicator; it's designed with a built-in trend identification feature that accurately detects whether the market is bearish or bullish. By integrat

This indicator uses candlesticks with large real bodies to predict possible market structure shift. Displacement is a very powerful move in price action resulting in strong selling or buying pressure. Generally speaking, displacement will appear as a single or a group of candles that are all positioned in the same direction. These candles typically have large real bodies and very short wicks, suggesting very little disagreement between buyers and sellers. Often, a displacement will occur just af

ICT, SMC, Smart Money Concept, Support and Resistance, Trend Analysis, Price Action, Market Structure, Order Blocks, Breaker Blocks, Momentum Shift, Strong Imbalance, HH/LL/HL/LH, Fair Value Gap, FVG, Premium & Discount Zones, Fibonacci Retracement, OTE, Buyside Liquidity, Sellside Liquidity, Liquidity Voids, Market Sessions,Market Time, NDOG, NWOG,Silver Bullet,ict template
На финансовом рынке точный анализ рынка критически важен для инвесторов. Чтобы помочь инвесторам лучше понять тенденции

The indicator displays a renko chart and a supertrend indicator in real time. After installing the indicator, the window will display the Renko chart and the supertrend indicator in the same window. This allows you to more clearly and visually see the entry and exit points when a trend reversal occurs. The signal to open a position is the intersection of the Renko candlestick of the supertrend indicator point and the appearance of the opposite signal of the supertrend indicator.
The indicator
FREE

The Game-Changing Engulfing Candle Hunter - Your Guide to Profitable Trend Trading
Step into the realm of trading possibilities with our revolutionary product - The Engulfing Hunter. Designed by traders for traders, this dynamic indicator combines the potency of engulfing candlestick patterns and the versatility of proprietary trend detection system, offering a trading edge unlike any other. Engulfing candlestick patterns have always been a revered tool in the arsenal of seasoned traders. Acti

To test the adviser, do you open a separate account for each of them? this is very inconvenient, but thanks to this indicator, this is no longer a problem!
Do not be too lazy to read the full description and do not close the page ahead of time, this indicator is needed by almost every trader, no matter if he trades with his hands or uses advisors.
Buying this indicator as a gift you will receive an adviser with not bad results.. if you have already received a gift from me from othe

Easy to use buy and sell signals with arrows. Non Repainting indicator. Non Lagging indicator. Down Arrows indicate sell and up arrows indicate buys. Works on any market and on any time frames. Arrow colors can be changed to match chart colors. Audible alerts. Periods can be changed to phase out false signals. Please remember to follow the trend like with any indicator.
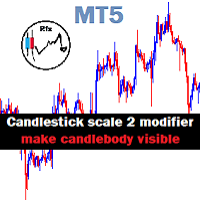
Chart Candlestick scale 2 zoom will visible instead of just a tiny unrecognized line make it look neat and tidy Instruction.
If you don't like the candles colors, you can do so by changing color. read below:
-Colors must be changed in the indicator setting.
-It won't change through the Chart properties to modify.
-After changing the color, save it as template so it wont change the colors to default value.
FREE

Smart Currency Strength is a powerful yet simple indicator that measures the strength of individual currencies.
It features a graphic panel that lists the main currencies and their strength in each timeframe, ranging from 0 (most oversold) to 100 (most overbought). The strength for all currencies in the current timeframe is also shown in a separate window as a multi-line graph, where each currency is represented with a different color, this allows you to monitor the evolution of strength tre

SourcePoint是一个很好的中长线交易指示器,他能独立使用,也可以去其他趋势型指标独立使用,可以很好的指出最佳的buy和sell位置,指标不含有未来函数,不会重新绘制,不仅能够应用到自己的手动交易过程中,还能完全可以写入到自己的EA中。建议配合BS TrendLine( https://www.mql5.com/zh/market/product/96476?source=Site+Market+My+Products+Page ) 一起使用。 (如果你感觉到这个指标能够帮助你进行更准确的交易,请帮忙给个好评,希望我的作品能够帮助更多有需要的人) ===================参数列表===================== fastP: 12 slowP:26 avgP:9 =================参考使用方法=================== 此指标可以适用于任何交易品种,能够用在任何周期。 每次形成一个交点,就是一个交易机会,同时也是一个持仓平仓点位。建议配合大小周期一起使用,这样更容易让你找到更精准的入场位置和出场位置

Moving Average Crossover Indicator. Add this Easy Indicator to your charts. The indicator indicates when to buy and when to sell. When the line is orange that is a sell signal. When the line is green that is a buy signal. Easy to use and colors can be changed so suit your charts. Easy to use. Follow the indicator and enter your buy and sell signals. Work on any market and on any timeframe.
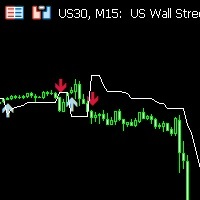
**Features:**
1. **Innovative Trend Tracking:** The UT BOT Simple Indicator leverages the power of the Average True Range (ATR), a renowned volatility measure, to calculate precise trailing stop values, providing unparalleled insights into market trends.
2. **Customizable Settings:** Flexibility is paramount in any trading strategy. With this in mind, our indicator allows you to adjust the ATR periods and other key parameters to tailor the tool to your trading style and strategy.
3. **Rea

Закрытие предыдущего дня и смещение баров для MetaTrader! Индикатор Закрытие предыдущего дня и смещение баров - это инструмент, разработанный для улучшения технического анализа и принятия решений в торговле. С помощью этого индикатора вы получите подробную информацию о уровнях открытия, максимума, минимума и закрытия любого бара, что позволит провести точный и всесторонний анализ движения рынка. Представьте себе возможность поместить один таймфрейм в другой, позволяя детально анализировать кажды
FREE

Статистика панели управления учетной записью
Это инструмент, который поможет вам иметь сфокусированное представление, чтобы узнать о прибылях и убытках вашего счета, чтобы вы могли отслеживать их, а также проводит анализ просадки, чтобы узнать полученный риск. Скачав и активировав его в личном кабинете, вы должны привязать его к любому символу например EURUSD H1, тогда с этого момента инструмент начнет отслеживать вашу статистику
панель полностью расширена, ее можно скрыть и переместить куд
FREE

Представляем нашу последнюю новинку в индикаторах MetaTrader 5, созданную для значительного улучшения вашего торгового рабочего процесса с помощью высокой функциональности и простоты использования. Он включает в себя мощный набор функций, разработанных для того, чтобы помочь вам оптимизировать анализ графиков и максимально использовать ваши торговые решения. Вот краткий обзор его потрясающих возможностей: Быстрое рисование объектов : Сэкономьте драгоценное время с функцией быстрого рисования. П

Welcome to the presentation of the AI Channel indicator, a powerful tool that uses artificial intelligence for price channel analysis in the financial market. In this session, we will explore how this revolutionary indicator can assist investors and traders in making more informed and strategic decisions. Let's get started! I. What is the AI Channel indicator? AI Channel is an indicator developed based on advanced artificial intelligence algorithms. It utilizes historical price data of financial
FREE
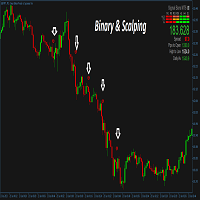
This is a trend following system for Binary options traders and forex scalpers. It is carefully crafted and recognizes periods of WATERFALL in the market and gives the trader the advantage and opportunity of riding with the momentum. It works on all timeframes and currency pairs especially high liquidity pairs. Avoid news events 15mins before and after. Always have your money management script or system in place. Tested on Deriv synthetics as well, please check screenshots. The mt4 version can b

JCAutoStm 简繁塞壬模型 1.Zigzag3浪,大中小三浪代表市场潮流、趋势、涟漪。 2.自动识别当前三浪的走势,命名每一种结构形态。 Zig123下跌3浪5浪7浪:D3/D5/D7,下跌中继形态:DRF1/DRF2/DRF3,底部反转形态:BRP1,BRP2,BRP3,特殊结构下跌5浪后底部反转结构Zig123D5BRP1/2 Zig123上涨3浪5浪7浪:U3/U5/U7,上涨中继形态:URF1/URF2/URF3,顶部反转形态:TRP1,TRP2,TRP3,特殊结构上涨5浪顶部反转结构Zig123U5TRP1/2 3.趋势线绘制,分别以大中小三浪相邻的高低点进行绘制。 绘制的原则是,收敛形态。 4.三浪有效SR,F3,F6,F12,F15,绘制水平线。 MACD背离线
FREE

Creating an Index: Importance, Customization, and Weighting Options for MT5 Trading Indicator Designing your index is crucial for efficient symbol tracking in the world of trading. With a powerful MT5 trading indicator, you gain the flexibility to construct an index that suits your preferences, whether it's an equal weighted or custom weighted one. Unlike widely-known indexes like the S&P 500, which heavily favor certain winners, this indicator empowers you to curate a basket of symbols and assi
The Scalper v2 will give you accurate guidance to trade with. It has indications with arrows and it sends notifications. This software was built based on the RSI,MACD,Martingale, Ema 50 and 200, Aligator, SMA 30,50, ADX, Volumes percent range, variable dynamics and fibonacci levels. all of these indicators have something in common, it allows analysis, support and resistance, accurate signals for buy and sell, overbought and oversold market analysis. I have combined all of these indicators into o
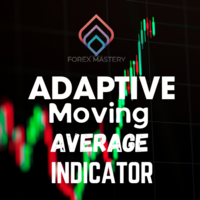
The Adaptive EMA consists of 3 lines: Yellow, Blue and Red If a yellow line appears, it means the market is entering Consolidation, Range, Contraction and no opportunities are available. If a Blue line appears, It means prices are accumulating, and now being marked up, so you are now entering a buy market with a strong Bullish trend. If a Red line appears, it means prices are now being marked down, price distribution is underway, so you are now entering a Sell market with a strong Bearish trend.

Добро пожаловать в индикатор Provlepsis
"Provlepsis" - это высокоуровневый индикатор, разработанный для рынка MQL. Анализируя предыдущие бары в тот же самый час дня, он точно рассчитывает потенциальный диапазон движения рынка, предоставляя ценную информацию о будущих колебаниях цен. В отличие от традиционного индикатора ATR, "Provlepsis" учитывает фактор времени, что делает его более мощным инструментом, адаптирующимся к различным рыночным условиям. В ночное время индикатор предсказывает более
FREE

Smart Drawing Assist PRO MT5. Buttons will appears next to the selected object. The buttons are straightforward and amazingly easy to use. Features are as follow: Draw zigzag . Enabling you to draw patterns, draw zigzag, and draw shapes. All you have to do is click the button and start clicking point to point and it will draw automatically. Change object color . Rectangle/Trendline/HLine/Vline/Text/Price Arrow/Arrowed Line/ and your suggestion please. Flatten trendline . make a perfect flat line

Super Trend Plus is a trading system that uses four Supertrends set with different parameters. The idea behind this system is that when three Supertrends move in the same direction, there is a strong trend confirmation, but entry occurs only when the fourth Supertrend also moves in the same direction as the other three. For example, the first Supertrend could be used with a volatility multiplier of 3 and a period of 10, the second Supertrend with a volatility multiplier of 3 and a period of 12,

This indicator uses the Zigzag indicator to identify swing highs and swing lows in the price chart. Once it has identified the swing highs and swing lows, it can use them to determine potential support and resistance levels. A support level is formed when the price drops and bounces back up from a swing low, indicating that there is buying pressure at that level. A resistance level is formed when the price rises and reverses downward from a swing high, suggesting selling pressure at that level.
FREE

The RFOC Symbol Background was created to display the name of the asset and the current timeframe in the background of the chart.
Displaying the name of the asset at the bottom of the chart is often used by traders who are designing the screen for spectators, making it easier to identify the asset and the timeframe during a class, for example.
It is available for the user to select the font size (small, medium or large) and select the color for better viewing according to the background colo
FREE

The Available Range Bands Technical Indicator draws two lines on the chart indicating the maximum limits (bands) expected for buying and selling for the current period (candle). These limits can be accessed by buffers 0 and 1 respectively.
In addition, it displays in the lower right corner the current average values of the real volatility, the last price, the predicted range of movement available for buying (% and points) and the predicted range of movement available for selling (% and points
FREE

The Graphic Alignment Context (GAC) Technical Indicator measures the vertical difference of the simple average price of a financial instrument in the context of three different timeframes determined by a defined number of bars or candles (periods) to determine the strength of the buy or sell trend. sale. Ascending average prices indicate Buying strength (1), Descending average prices indicate Selling strength (-1) and any scenario different from the previous two conditions indicates Neutrality
FREE
Индикатор Volatility Proper Index отображает в отдельном окне индекс волатильности торгового символа. Для расчета волатильности используется расчет отклонений цены от скользящей средней.
Параметры индикатора: Period - количество последних баров для которых производится расчет индекса волатильности . MinThreshold - минимальное отклонение цены от скользящей средней, при котором это отклонение учитывается в расчетах .
AveragePeriod - период скользящей средней , по умолчанию = 30 послед

To get access to MT4 version please click here . This is the exact conversion from TradingView: "Candle body size" by "Syamay". This is a light-load processing indicator. This is a non-repaint indicator. Buffers are available for processing in EAs. All input fields are available. You can message in private chat for further changes you need. Thanks for downloading
FREE
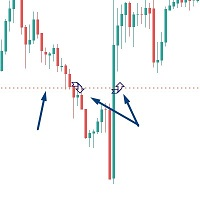
Introductory Offer! *** Only $47 - normal price $97 !! *** Ends soon - don't miis it!! The Close Above or Below Price Indicator is part of my suite of Price and Trendline Alerts Indicators. I'm excited to introduce the Close Above or Below Price Indicator – part of my new suite of Price and Trendline Alert Indicators – fantastic tools designed to alert you when candles close above or below significant prices in the markets you trade. With this indicator, you can set up to 4 price alerts on a
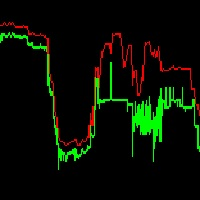
It is super imporant to know what the spread is on your charts!
This indicator displays the Ask High of the past bars, similar to that of the backtester. This allows you to see the spread of bars in real time.
The spread of the bar is the ask-bid price. The spread of a bar is the minimum spread of any ticks found within that bar. I hope this makes sense.
If you have any questions or feedback, let me know - thank you.

This is one of my preferred indicators where it plots on the chart Railroad Track candles, i.e. candles that have similar size. It is a very good indicator for trend direction. In the settings there is an option for Max candle size and Min candle size and also for the percentage for the tolerance between the Min and Max candle size. The candles values are calculated for High and Low. Have fun and enjoy trading! P.S. Please send me a message or leave a comment with any suggestions or improvements

XP Speed Meter the best indicator that measures the price/tick’s currency speed for you. It will give you the ability to know when the pair moving fast or slow . So, you can trade or not trade. It’s very important tool for scalper traders – news traders. Even for trend traders it will be useful to know if the market is trending fast or slow . XP Speed Meter is better than the volume type indicators of course. Because it shows the currency speed on the run-time without any lacking like what the v

To get access to MT4 version please click here . This is the exact conversion from TradingView: "RedK_Supply/Demand Volume Viewer v3.0" by "RedKTrader" This is a light-load processing and non-repaint indicator. All input options are available. Buffers are available for processing in EAs. You can message in private chat for further changes you need. Thanks for downloading
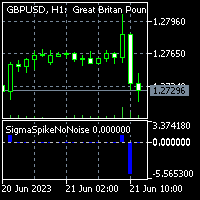
To get access to MT4 version please click here . This is the exact conversion from TradingView: "Sigma Spikes No Noise" by "irdoj75" This is a light-load processing and non-repaint indicator. All input options are available. Buffers are available for processing in EAs. You can message in private chat for further changes you need. Thanks for downloading...
This will find a possible reverse area and show entry signal and this strategy is using every candle and calculate them
buyer should us e with other indicators to get the best trade entry like Macd , RSI , or EMA . SMA.
Make sure try demo first it will supprise you all because how good it is
i hope you guy enjoy it but my coding is not good, so i cant code any EA for this , my own strategy
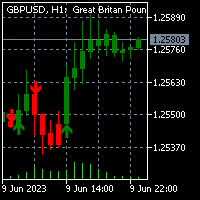
To get access to MT4 version please click here . This is the exact conversion from TradingView: "UT Bot Alerts" by "QuantNomad". This is a light-load processing and non-repaint indicator. Buffers are available for processing in EAs. You can message in private chat for further changes you need. Here is the source code of a simple Expert Advisor operating based on signals from UT Bot Alerts . #include <Trade\Trade.mqh> CTrade trade; int handle_utbot= 0 ; input group "EA Setting" input int magic_

Вы устали упускать выгодные рыночные тренды? Вы хотели бы иметь надежный инструмент, который мог бы точно и точно определять продолжение тренда?
Не смотрите дальше! Наш индикатор продолжения тренда призван усилить вашу торговую стратегию и помочь вам опережать конкурентов.
Индикатор продолжения тренда — это мощный инструмент, специально созданный для помощи трейдерам в выявлении и подтверждении паттернов продолжения тренда на различных финансовых рынках.
Независимо от того, торгуете ли в

5/10 копий по 30$ ---> следующая 50$ // версия MT4
Forex Vigor - это технический индикатор, который оценивает силу импульса 8 основных валют (EUR, GBP, AUD, NZD, USD, CAD, CHF, JPY). Индикатор опирается на математические расчеты, которые измеряют отсутствие корреляции между 28 валютными парами. Для расчета их значений он анализирует процентную разницу между ценами закрытия с помощью метода линейно-взвешенного усреднения (LWMA) плюс статистическая система, которая исключает значения, не пр

This indicator builds upon the previously posted Nadaraya-Watson Estimator. Here we have created an envelope indicator based on kernel smoothing with integrated alerts from crosses between the price and envelope extremities. Unlike the Nadaraya-Watson Estimator, this indicator follows a contrarian methodology. Please note that the indicator is subject to repainting. The triangle labels are designed so that the indicator remains useful in real-time applications.
Settings
Window Size: Dete

This Engulfing Candle Indicator as the name implies can detect engulfing candlestick patterns on the chart. The indicator alerts the user of the presence of an engulfing candle (Bearish engulfing candle and Bullish engulfing candle) by using visual representation of arrows on the chart. - Blue arrow for Bullish engulfing - Red arrow for Bearish engulfing Extra modifications can be added based on request.
FREE

To get access to MT4 version please click here . This is the exact conversion from TradingView: "[SHK] Schaff Trend Cycle (STC)" by "shayankm". This is a light-load processing indicator. This is a non-repaint indicator. Buffers are available for processing in EAs. All input fields are available. You can message in private chat for further changes you need. Thanks for downloading
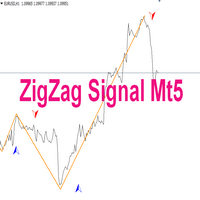
Описание индикатора: Индикатор - ZigZag Signal создан на основе известного и популярного индикатора - ZigZag. Индикатор можно применять для ручной, или автоматической торговли советниками. 1. Для ручной торговли у индикатора - ZigZag Signal имеются алерты разных уведомлений. 2. В случае применения в советниках у индикатора имеются сигнальные буферы на покупки и продажи. Также можно прописать и вызвать индикатор в качестве внешнего ресурса и других возможностях настроек и применений: (напишите

What is it? ️ Moving Average Band is a tool that represents the moving average as a band ️ It dynamically adjusts according to market volatility What does it provide me? ️ A more realistic view: By incorporating volatility, it improves the identification of support and resistance zones ️ Informed decisions: It offers an enriched evaluation of trends and price movements How do I interpret it? ️ With MAB, the moving average line becomes a band, a zone ️ When the band narrows, volatility decr

To get access to MT4 version please click here . This is the exact conversion from TradingView: "ZLSMA - Zero Lag LSMA" by "veryfid". This is a light-load processing indicator. This is a non-repaint indicator. Buffers are available for processing in EAs. All input fields are available. You can message in private chat for further changes you need. Thanks for downloading
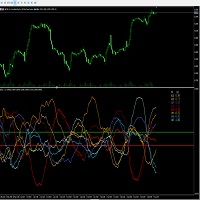
Качественный индикатор рассчитывает разницу между валютными парами USD, EUR, GBP, AUD, JPY, CHF, NZD, CAD. Расчёт ведётся в онлайн режиме вычисляет спрос и предложение между собой в различных связках. Отображение можно наблюдать в двух режимах общий всех восьми пар а также конкретно по выбранной паре. Важным показателем индикатора является нулевая ость что указывает общий тренд валют и их преимущество по отношению друг к другу. Индикатор работаем во всех режимах времени.
Индикатор обнаруживает начало нового тренда не прямым способом, а сравнением двух прогнозных значений, построенных с учетом доступной истории. Его действие основано на предположении о том, что прогнозируемая (исторически нормальная) цена и реальная цена отличаются вследствие появления “новой” силы (несбалансированного воздействия на рынок), как правило такое воздействие при неустойчивом рынке приводит к существенной коррекции рынка. Устойчивость рынка индикатор не отслеживает, поэтому рекоме

The MultiTimeframe Volume Zones Indicator is a powerful tool designed to provide traders with comprehensive insights into market dynamics. It combines several essential features, including volume analysis, Dow Zones, buy and sell arrows, candle timer, and market movement across different time frames. This all-in-one indicator equips traders with valuable information to make informed trading decisions. Key Features: Volume Analysis: Gain a deep understanding of market sentiment and strength by an
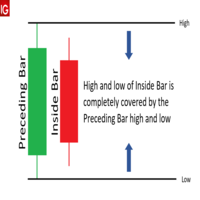
The Inside bar indicator can detect where inside bars occur in the charts and will change the color of the candle based on user inputs. Please note that the color can differ based on the current color of the candle due to supposition of the colors. Here are the characteristics of an inside bar pattern: High: The high of the bearish candle is lower than the high of the previous bullish candle. Low: The low of the bearish candle is higher than the low of the previous bullish candle. Body: The bo
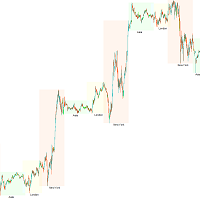
Торговые сессии, часы работы рынка, времена сессий, часы Форекса, расписание торгов, время открытия/закрытия рынка, часовые пояса для торговли, индикаторы сессий, рыночные часы, ICT, Asia KillZone, London Killzone, New York Killzone.
Трейдеры должны обращать внимание на влияние часовых поясов на торговлю, поскольку различные времена активности рынка и объемы торгов могут непосредственно влиять на волатильность и возможности торговли валютными парами. Чтобы помочь трейдерам получить всеобъемлю
FREE

Индикатор средневзвешенной цены по объему — это линейный индикатор, который отображается в главном окне графика MT5. Индикатор отслеживает типичную цену, а затем торговый объем, используемый для автоматического смещения линии индикатора в направлении интенсивно торгуемых цен. Именно по этим ценам было продано наибольшее количество контрактов (или лотов). Затем эти взвешенные цены усредняются по прошлым периодам, и индикатор показывает линейное исследование по этим ценам.
Индикатор в этом пост
Индикатор Logarithmic Moving Average представляет собой скользящее среднее, которое инвертирует формулу экспоненциального скользящего среднего.
Известно, что многие трейдеры используют логарифмические графики для анализа продолжительности ценовых колебаний. Индикатор в этом посте можно использовать для анализа логарифмического значения цены на стандартном графике с временной шкалой.
Трейдер может задать следующие входные параметры:
MAPeriod [по умолчанию: 9] — установите большее чи
Представляем индикатор Draw On Chart: раскройте свою креативность на графиках!
Устали бороться с проблемами аннотирования ваших торговых графиков, пытаясь понять свои анализы или эффективно передать свои идеи? Вам больше не придется искать решение! Мы рады представить индикатор Draw On Chart - революционное средство, позволяющее легко рисовать и аннотировать непосредственно на графиках всего лишь несколькими щелчками или движениями вашего пера.
Наш инновационный индикатор Draw On Chart разр
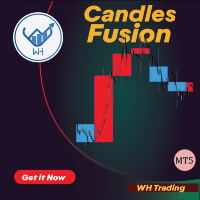
Candles Fusion — это мощный индикатор MT5 , который улучшает ваш торговый анализ, отображая свечи старшего таймфрейма на текущем таймфрейме.
Эта уникальная функция предоставляет трейдерам всестороннее представление о движении цены на различных таймфреймах, что позволяет им принимать более обоснованные торговые решения.
Функции:
Наложение нескольких таймфреймов. Настраиваемый выбор таймфрейма. Четкая визуализация. Обновления в реальном времени. Удобный интерфейс.
Candles Fusion —
MetaTrader Маркет - лучшее место для продажи торговых роботов и технических индикаторов.
Вам необходимо только написать востребованную программу для платформы MetaTrader, красиво оформить и добавить хорошее описание. Мы поможем вам опубликовать продукт в сервисе Маркет, где его могут купить миллионы пользователей MetaTrader. Так что занимайтесь только непосредственно своим делом - пишите программы для автотрейдинга.
Вы упускаете торговые возможности:
- Бесплатные приложения для трейдинга
- 8 000+ сигналов для копирования
- Экономические новости для анализа финансовых рынков
Регистрация
Вход
Если у вас нет учетной записи, зарегистрируйтесь
Для авторизации и пользования сайтом MQL5.com необходимо разрешить использование файлов Сookie.
Пожалуйста, включите в вашем браузере данную настройку, иначе вы не сможете авторизоваться.