Смотри обучающее видео по маркету на YouTube
Как купить торгового робота или индикатор
Запусти робота на
виртуальном хостинге
виртуальном хостинге
Протестируй индикатор/робота перед покупкой
Хочешь зарабатывать в Маркете?
Как подать продукт, чтобы его покупали
Бесплатные технические индикаторы для MetaTrader 5 - 8

The big figure is a crucial aspect of forex trading, serving as a reference point for trade execution, risk management, and technical analysis. By understanding the importance of the big figure and incorporating it into their trading strategies, forex traders can improve their decision-making process and increase the likelihood of successful trades. Why is the Big Figure Important? The big figure is important for several reasons: Simplification: Traders often refer to the big figure when discu
FREE
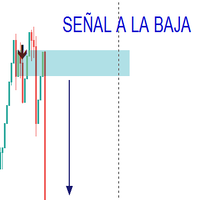
El indicador trabaja con patrones funcionales y divergentes obteniendo del mercado las mejores señales para compra y venta, ha sido testeado por 2 años mediante la estrategias personalizada. El indicador envia la señal para la compra y venta de acuerdo al analisis desarrollado en el mercado. Solo ha sido comprobado en el mercado de indice sintetico (CRASH, BOOM VOLATILITY, STEP)
FREE

Overlay indicator on chart between 2 pairs
The Timeframe Overlay indicator displays the price action of timeframes on a single chart, allowing you to quickly assess different timeframes from a single chart. The advantage is to observe and follow the correlations of price movements in real time to help you find potential trades at a glance.
---- Symbol 1 ----
Symbol = EURUSD
Correlation Inverse = false
Display = true
Ratio
FREE

Channels indicator does not repaint as its based on projecting the falling and raising channels. As a trader you need a path to be able to place your buy and sell trades such as: Supply and Demand , Falling & raising channels. Falling and raising channels can be in any time frame and also can be in all time frames at the same time and the price always flows within these channels. Experienced trades will draw the key levels and channels around the time frames. But, they will not be able to draw
FREE
Amazing RSI + ATR Dashboard Indicators are useful for traders, but when you put them into a dashboard and can scan 28 symbols at once they become even better, and when you can also combine different indicators and timeframes to give you synchronized alerts they become awesome. When this product gets 20 reviews I will add another indcator free to this dashboard as a thank you. This easy to use dashboard provides you with the RSI and ATR indicators, use them individually or together to create p
FREE

Скользящая средняя Алана Хала, более чувствительная к текущей ценовой активности, чем обычная MA. Быстрее реагирует на изменение тренда, четче показывает движение цены. Цветная версия индикатора. Развитие оригинальной версии индикатора от Sergey <wizardserg@mail.ru>. Подходит для всех таймфреймов.
Параметры Period - период сглаживания, рекомендуемые значения от 9 до 64. Чем больше период, тем мягче индикатор. Method - метод сглаживания, меняет отзывчивость и силу индикатора
FREE
Session Bias This Strategy of bias useful for those who follow TRADESHARE on youtube. This script is designed by BokaroTraderFx for traders who want assistance in determining their session bias, particularly for those who trade within sessions typically represented by a single 4-hour candle. The method involves using price action to establish a daily bias, guiding decisions on whether to focus on buys, sells, or both. The analysis is based on the previous daily and 4-hour candle closes, fo
FREE

One of the best trend indicators available to the public. Trend is your friend. Works on any pair, index, commodities, and cryptocurrency Correct trend lines Multiple confirmation lines Bollinger Bands trend confirmation Trend reversal prediction Trailing stop loss lines Scalping mini trends Signals Alerts and Notifications Highly flexible Easy settings Let me know in the reviews section what you think about it and if there are any features missing.
Tips: Your confirmation line will predict tr
FREE

Andrew Pitch fork is one of the most interesting string trend & Channel & Fibo technical analysis , it's like ALL in ONE tool would be very enough for you.
FYI, This indicator will expire by end of July 2022.
Using 2 Andrew pitch Forks with 2 different time frames on same chart is really very hard working and might be impossible , but with this indicator is possible now , moreover , using this method as Candle Volume based analysis give strong trust for your trade.
I assume if you are hav
FREE

Minimalist style BB indicator fully filled with a single color. Indicator type: Technical Indicator You are too confused with the complicated zigzag lines in the BB indicator, especially when your strategy has many indicators combined, it looks like a mess and we will no longer see any candlesticks on the chart for technical analysis s. This indicator was born to solve that. See more: New tradingview indicator: Order Block TV | Minimalist Price Action Strategy | Subscribe It is designed
FREE

Индикатор, отображающий время основных торговых рынков мира. Он также показывает текущую сессию. Очень прост в применении. Не занимает много места на графике. Можно использовать вместе с советниками и другими панелями, такими как VirtualTradePad . Версия с классическим отображением. Дорогие друзья и пользователи наших советников, добавляйте Ваши оценки в разделе Отзывы Все обновления наших программ для форекс - бесплатны ! Это бесплатная торговая утилита! Другие характеристики: В входных пара
FREE

PreCogniTrade : Un Indicador Técnico Avanzado para Predecir el Mercado (Fase Beta) El PreCogniTrade es un indicador técnico revolucionario diseñado para los traders que buscan una ventaja competitiva en los mercados financieros. Este indicador no solo analiza las tendencias actuales, sino que también predice los movimientos futuros de los precios con una precisión asombrosa, lo que lo convierte en una herramienta de incalculable valor para cualquier estrategia de trading. Características Pr
FREE

Introduction
The SuperBands Indicator is a sophisticated technical analysis tool designed to provide traders with a clear visual representation of price movements within well-defined bands. This indicator is specifically engineered to filter out minor price fluctuations and market noise, offering traders a more accurate and reliable view of price trends and potential reversal points.
Signal
Buy when price breaks below the "Extremely oversold" band (darker red color) and then clos
FREE

Finally a Metatrader version of the very popular (and expensive) Market Cipher B indicator, or the Vumanchu Cipher B + Divergences very popular on Tradingview platform.
This tool is very heavy on calculations, total are 31 plots using 97 buffers from several indicators. On my mid end computer, timeframes below M15 start getting a bit laggy, so it would require a powerful computer to run it properly at very low timeframes. It's still usable here, but somewhat sluggish response in Metatrader (l
FREE

Presentation
Another indicator that makes scalping on tick charts easier, it displays an Heiken Ashi graph in Ticks.
It allows to detect entry points and trend reversals. Recommended number of ticks in a candle : 5, 13 or 21.
Parameters Ticks in candle: Number of ticks in a candle (default 5), Displays Trend arrows : displays a trend arrow based on EMA8 and EMA20 crossing, Displays MM50, Displays MM100, Max Candle (CPU): number of candles max to manage, low value will save ressources of
FREE

Описание :
мы рады представить наш новый бесплатный индикатор, основанный на одном из профессиональных и популярных индикаторов на рынке форекс (PSAR), этот индикатор является новой модификацией оригинального индикатора Parabolic SAR, в индикаторе pro SAR вы можете видеть пересечение между точками и графиком цены, это пересечение не является сигналом, а говорит о возможности окончания движения, вы можете начать покупать с новой синей точки, и разместить стоп-лосс за один атр до первой синей
FREE
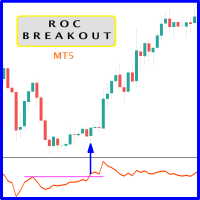
When prices breakout resistance levels are combined with Rate of Change oscillator "ROC" oscillator breaks out its historical resistance levels then probability emerges to record farther prices. It's strongly encouraged to confirm price breakout with oscillator breakout since they have comparable effects to price breaking support and resistance levels; surely, short trades will have the same perception. Concept is based on find swing levels which based on number of bars by each side to confirm
FREE

One of the best tools for analyzing volume,
Weis Wave was idelized by David Weis, to facilitate the reading of directional flow. For the VSA method disciples it is an evolution of the practices created by Richard Wycoff, facilitating a predictive reading of the market, always seeking an accumulation and distribution of the negotiated contracts.
Cumulative wave volume Range of wave ( removed) Average Wave volume Ref "Tim Ord lectures" ( removed)
FREE

Вилка Нео v5, разрабатывалась для торговой системы "Оракул", но постепенно дополнялась, например - углами Ганна и другими опциями... Можно создавать графические объекты с заданным цветом, стилем и толщиной, такие как: прямоугольники с заливкой и без, отрезки трендлиний и нестандартный инструмент - "вилка Нео" в виде трезубца, так же есть возможность интерактивно настраивать цветовую палитру прямо с графика, настраивать видимость объектов для разных ТФ, толщину и стили...
Панель переключается к
FREE

Индикатор контролирует уровень STOPLEVEL. При изменении уровня сигнализирует оповещением. STOPLEVEL - минимальный отступ в пунктах от текущей цены закрытия для установки Stop ордеров, или минимально допустимый уровень стоп-лосса/тейк-профита в пунктах. Нулевое значение STOPLEVEL означает либо отсутствие ограничения на минимальную дистанцию для стоп-лосса/тейк-профита, либо факт использования торговым сервером внешних механизмов динамического контроля уровней, которые не могут быть транслиро
FREE

Average Session Range: Calculate and Average the Sessions High-Low Range of Specific Time Sessions Over Multiple Days. The Session Average Range is a sophisticated and precise tool designed to calculate the volatility of specific time sessions within the trading day. By meticulously analyzing the range between the high and low prices of a defined trading session over multiple days, this tool provides traders with a clear and actionable average range. **Note:** When the trading platform is closed
FREE

Investment Castle Support and Resistance Indicator has the following features: 1. Dictates the direction of Buy or Sell trades based on Support and Resistance Levels automatically . 2. Candles stick colors will change to Red for Sell and Blue for Buy (Default settings, user can change from the inputs). 3. This indicator is built-in the Support & Resistance based Investment Castle EA which works with Psychological Key Levels "Support & Resistance".
FREE

TransitTrendlines this is a automatically trendline drawer, it draw both horizontal and diagonal trendlines. The horizontal trendlines are the pivot points of the day timeframe and the diagonal trendlines are based on the current time frames. You can adjust the diagonal trendlines by increasing the number of bars to draw the diagonal trendline and can also adjust the steepness. Note that the Horizontal trendlines are based on the day pivot points not currant time frame. Join mql5 transitbk98 cha
FREE

Данный индикатор сделан на основе индикатора Parabolic SAR. Он помогает пользователю определиться с направлением сделки. В утилиту также встроена функция звукового уведомления при появлении нового сигнала. Дополнительно доступна функция уведомления по email. Ваш e-mail адрес, а также параметры SMTP сервера должны быть указаны в настройках терминала MetaTrader 5 (вкладка "Почта"). Синяя стрелка вверх = Покупка. Красная стрелка вниз = Продажа. Line = Трейлинг стоп. Вы можете использовать один из м
FREE
Бесплатный индикатор спреда для MetaTrader 5 Этот индикатор предоставляет детальный анализ спреда на MetaTrader 5, одного из важнейших параметров для трейдеров, так как он представляет собой разницу между ценой покупки (Ask) и ценой продажи (Bid) актива. Индикатор включает: Средний спред : Рассчитывается как среднее значение между максимальным и минимальным спредом, наблюдаемым в течение дня. Текущий спред : Отображает текущий рыночный спред. Минимальный спред : Показывает минимальное значение с
FREE

BEHOLD!!!
One of the best Breakout Indicator of all time is here. Multi Breakout Pattern looks at the preceding candles and timeframes to help you recognize the breakouts in real time.
The In-built function of supply and demand can help you evaluate your take profits and Stop losses
SEE THE SCREENSHOTS TO WITNESS SOME OF THE BEST BREAKOUTS
INPUTS
MaxBarsback: The max bars to look back
Slow length 1: Period lookback
Slow length 2: Period lookback
Slow length 3: Period lookbac
FREE

Нужны тестировщики для нового эксперта, кому интересно пишите на почту 777basil@mail.ru
Расчет индикатора основан на изменении цены в истории и рассчитывается математически, пересчитывается каждый раз с новым поступлением данных. Может использоваться на разных таймфреймах. От границ индикатора в 70% происходит изменение направления движения цены, либо консолидация. Таким образом можно торговать, как по тренду, так и в середину канала от его границ. Лучше использовать в трендовой торговле для
FREE

Индикатор ICT Zone Arrow Indicator представляет собой инновационный инструмент, разработанный на основе принципов ICT . Он обеспечивает простоту и эффективность в определении ключевых торговых зон на рынке. Основан на концепции 'killzone', этот индикатор предоставляет трейдерам важные уровни поддержки и сопротивления, обнаруживая места, где потенциально могут происходить сильные изменения направления цен. Индикатор ICT Zone Arrow Indicator предоставляет наглядные графические отметки, которые п
FREE

The indicator represents the session boxes for the Asian, European and American sessions. It is possible to change the time of each session, such as color. It is also possible to disable the display of each session. You will find in input parameters variables to modify in format hh:mm. In Colors tab you can change the color of boxes of each sessions. If you need some implementations please contact me.
FREE
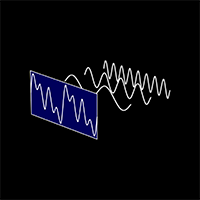
The "Cycle Extraction" indicator for MetaTrader 5 uses the Fast Fourier Transform (FFT) to discern cycles in financial time series. It facilitates the configuration of parameters such as the maximum number of bars, moving average settings, and specification of frequency thresholds, optimizing the analysis of repetitive market phenomena. Instructions Input Settings : Adjust variables such as Bar Count, Period, Method, and Applied to Price to customize the analysis to the user's needs. Data Visual
FREE

In this indicator you choice a data to be used from yesterday (high, low, open, close, etc) to automatically draw an line to be the zero. And, from that a percentage deviation ("Percentage to be used") is calculated and used to draw others line to both side until a limit be reached.
Both sides can have diferrent colours as show in screenshots. Also, more than one indicator can be used at same time.
FREE

The indicator allows you to simplify the interpretation of signals produced by the classical ADX indicator.
The position of the hight bars of the histogram relative to zero and the histogram coloring indicate the direction of price movement determined by the intersection of DI+ / DI-.
The position of the hight bars of the histogram relative to zero and the color indicate the strength of the price movement.
The indicator is a logical continuation of the series of indicators using this class
FREE

If you like to use traditional Moving Averages (like SMAs and EMAs) to provide your trades for dynamic levels of Support and Resistance, you will love the Adaptive Moving Average (AMA). Created in 1995 by Perry Kaufman and presented to the world in his book " Smarter Trading : Improving Performance in Changing Markets ", the Adaptive Moving Average (also known as KAMA - Kaufman Adaptive Moving Average) has the goal to be the perfect companion for following a trend without noise, but s
FREE

Overview: The AlphaTrend Indicator is a custom technical analysis tool designed for the MetaTrader 5 (MT5) trading platform. This indicator uniquely combines the Average True Range (ATR) and the Money Flow Index (MFI) to offer traders a novel approach to trend analysis and potential reversal points in the market. Key Features: ATR-Based Trend Analysis: Utilizes the Average True Range (ATR) to assess market volatility, aiding in identifying potential trend reversals. MFI Integration: Incorporates
FREE

This indicator show Gann Swing Chart (One Bar) with multi layer wave. 1. Wave layer F1: Gann waves are drawn based on candles. SGann wave(Swing of Gann) is drawn based on Gann wave of wave layer F1. 2. Wave layer F2: Is a Gann wave drawn based on the SGann wave of wave layer F1. SGann waves are drawn based on Gann waves of wave layer F2. 3. Wave layer F3: Is a Gann wave drawn based on the SGann wave of wave layer F2. SGann waves are drawn based on Gann waves of wave layer F3. ---------Vi
FREE

Japanese candlestick analysis has been in existence for hundreds of years and is a valid form of technical analysis. Candlestick charting has its roots in the militaristic culture that was prevalent in Japan in the 1700s. One sees many terms throughout the Japanese literature on this topic that reference military analogies, such as the Three White Soldiers pattern Unlike more conventional charting methods, candlestick charting gives a deeper look into the mind-set of investors, helping to establ
FREE

Личная реализация известного принципа торговли по тренду, известного как более высокий максимум (Higher High), более высокая цена закрытия (Higher Close), более низкий минимум (Lower Low), более низкая цена закрытия (Higher Close) (HHHC - HHHL). Для определения направление тренда, изменения тренда и зоны отката он использует только ценовое действие. Настраиваемый период прорыва Настраиваемые цвета и размеры Не перерисовывается Доступны все типы алертов Индикатор определяет три ценовые зоны: Зоны
FREE

Descubre el poderoso aliado que te guiará en el laberinto de los mercados financieros. Este indicador revolucionario te llevará de la incertidumbre a la claridad, permitiéndote identificar con precisión los puntos de inflexión del mercado. Mejora tus decisiones de entrada y salida, optimiza tus operaciones y ¡multiplica tus ganancias con confianza.
¡Para más información, te invitamos a unirte a nuestro canal de Telegram en https://t.me/Profit_Evolution ¡Allí encontrarás contenido exclusivo, a
FREE

Динамический индикатор поддержки и сопротивления - универсальный инструмент, объединяющий уровни поддержки и сопротивления с динамикой рынка в реальном времени. Путем учета предыдущих дневных максимумов и минимумов он предоставляет ценную информацию о психологии рынка и выявляет потенциальные уровни разворота цены или прорыва. Благодаря способности адаптироваться к изменяющимся рыночным условиям и настраиваемым параметрам, трейдеры могут опережать тренды и принимать обоснованные решения. Этот ин
FREE

Do you want to see the most relevant supports and resistances at a glance? Tired of tracing the levels by hand? Multi Levels Detector is an indicator for MetaTrader that will draw supports and resistances according to the parameters entered, and also offers the possibility of executing an alert every time the price reaches any of its levels.
SETTINGS UsePercentage: Allows you to configure whether the distances between levels will be measured in points, or by a percentage of the asset.
TimeFr
FREE

The MACD 2 Line Indicator is a powerful, upgraded version of the classic Moving Average Convergence Divergence (MACD) indicator.
This tool is the embodiment of versatility and functionality, capable of delivering comprehensive market insights to both beginner and advanced traders. The MACD 2 Line Indicator for MQL4 offers a dynamic perspective of market momentum and direction, through clear, visually compelling charts and real-time analysis.
Metatrader4 Version | All Products | Contac
FREE

Relative Volume or RVOL is an indicator that averages the volume of X amount of days, making it easy to compare sessions volumes.
The histogram only has 3 colors:
Green - Above average volume
Yellow - Average volume
Red - Below average volume
The default setting is 20 days, which corresponds more or less to a month of trading.
In this version is possible to choose between tick and real volumes (if you are using a broker which offers future contracts)
With the data obtaine
FREE

Jackson Support and Resistance V it a powerful advance support and resistance indicator which provide signal base on price action, it Design to make things easy for everyone to draw support and resistance. we believe most strategies are built with support and resistance as a foundation .Having support and resistance perfect can be a game change to you way of trading. It flexible to all instrument .don't forget to watch our video on how to us this indicator prefect and progressive.
FREE

Developed by Jack Hutson in the 80's, the Triple Exponential Moving Average (a.k.a. TRIX ) is a Momentum technical indicator that shows the percentage of change in a moving average that has been smoothed exponentially 3 times. The smoothing process was put in place in order to filter out price movements that are considered insignificant for the analysis period chosen. We at Minions Labs found hard to follow the smoothness of the original TRIX line, so we colored the TRIX line with BUY and SELL t
FREE

The Expert Advisor for this Indicator can be found here: https://www.mql5.com/en/market/product/116472 Introducing the Rejection Candle MT5 Indicator, a robust tool designed to revolutionize your trading experience on the MetaTrader 5 platform. Built to pinpoint potential reversals with precision, this indicator offers unparalleled insights into market sentiment shifts, empowering traders to seize profitable opportunities with confidence. Key Features: Advanced Rejection Candle Detection: Uncov
FREE

The HighsAndLowsPro indicator for MetaTrader 5 marks local highs and lows in the chart. It distinguishes between weak and strong highs and lows. The line thicknesses and colours can be individually adjusted. In the default setting, the weak highs and lows are displayed thinner, the strong ones thicker. Weak highs and lows have 3 candles in front of and behind them whose highs are lower and lows are higher. The strong highs and lows have 5 candles each.
FREE

John Bollinger created this indicator in 2010 as a way to read the original indicator (Bollinger Bands) in a more "technical" way, shown as an oscillator. The typical range of the Bollinger Bands %B is 0 - 0.5 - 1.0, where "0" represents the lower band, the "0.5" the middle band, and "1" the upper band. The line on the indicator represents the Closing prices. As simple as that.
SETTINGS
Bollinger Bands period of analysis Standard Deviation multiplier Shift Price type to be analyzed
If you
FREE

Schaff Trend Cycle (STC) "CON ALERTAS"
El Indicador Schaff Trend Cycle (STC) es una herramienta técnica utilizada en el trading e inversión para identificar tendencias y generar señales de compra o venta. ¿Qué es el Schaff Trend Cycle? El STC fue desarrollado por Doug Schaff para mejorar las medias móviles incorporando análisis de ciclos. Su objetivo es identificar tendencias y cambios de tendencia midiendo la fuerza y velocidad de los cambios de precio. Es un oscilador que mide la velocida
FREE

Стандартный Индикатор Fractals Bill Williams с возможностью указания количества свечей для формирования. Индикатор работает на любых графиках и таймфреймах.
Настройки: candles -количество свечей слева и справа на основе которых строиться фрактал (в классическом индикаторе это значение всегда 2 )
Контакт: Если у вас возникли какие-либо вопросы или требуется помощь, пожалуйста, свяжитесь со мной через личное сообщение. Автор: Fertikov Serhii, Больше моих индикаторов, советников, скриптов д
FREE

A heatmap is a graphical representation of data in two dimensions, using colors to display different factors. Heatmaps are a helpful visual aid for viewers, enabling the quick dissemination of statistical or data-driven information. The MP Heatmap indicator provides a graphical representation of the relative strengths of major currencies compared to others, organizing data from pairs into color-coded results and producing a clear overview of the entire Forex market. The MP Heatmap indicator dis
FREE

Это непараметрический зигзаг с несколькими режимами работы. Ребра идут вверх до тех пор, пока не встретится бар, максимум (high) которого ниже самого высокого минимума (low), а ребра вниз продолжаются до тех пор, пока не встретится бар, минимум (low) которого расположен выше самого низкого максимума (high); Развороты Ганна: ребро идет вверх пока high и low повышаются у каждого следующего бара; ребро идет вниз пока high и low понижаются у каждого следующего бара; внутренние бары (с более низким
FREE

Probability emerges to record higher prices when MACD breaks out oscillator historical resistance level. It's strongly encouraged to confirm price breakout with oscillator breakout since they have comparable effects to price breaking support and resistance levels; surely, short trades will have the same perception. As advantage, many times oscillator breakout precedes price breakout as early alert to upcoming event as illustrated by 2nd & 3rd screenshot. Furthermore, divergence is confirmed
FREE

The ATR Exit indicator uses the candle close + ATR value to draw trailing stop lines (orange under buys, magenta over sells) that advance with the trend until the trend changes direction. It uses a multiple of the Average True Range (ATR), subtracting it’s value from the close on buy, adding its value to the close on sell. Moreover, the trailing stop lines are generated to support the order’s trend direction (long or short): In an upward trend, the long trailing stop line (orange line under bu
FREE

Индикатор "Envelope of Adaptive Moving Average" является инструментом, который поможет вам принимать информированные решения на финансовом рынке. Он разработан для предоставления вам четкой картины направления тренда и потенциальных точек входа и выхода в ваших сделках. Этот индикатор основан на адаптивном скользящем среднем, что означает, что он автоматически корректируется под изменения в волатильности рынка. Это делает его особенно полезным на рынках, которые могут быть как спокойными, так и
FREE
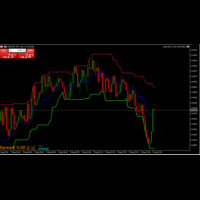
The Donchian Channel Indicator I created is a powerful tool for analyzing price trends and volatility. By plotting the highest high and lowest low over a specified period, it helps identify potential breakout opportunities and trend reversals. This indicator is valuable for traders seeking to understand market dynamics and make informed decisions based on price movements. Its simplicity and effectiveness make it an essential addition to any trading strategy.
FREE

Скользящая средняя Т3 Тиллсона была представлена миру технического анализа в статье «Лучшая скользящая средняя», опубликованной в американском журнале Technical Analysis of Stock Commodities. Разработанный Тимом Тиллсоном, аналитики и трейдеры фьючерсных рынков вскоре увлеклись этой техникой, которая сглаживает ценовой ряд, уменьшая при этом лаг (лаг), типичный для систем следования за трендом.
FREE

The "Trend Fishing Indicator" is a powerful custom indicator designed to help traders identify potential trend reversal points and capitalize on market momentum. This indicator uses multiple moving averages of varying periods to evaluate short-term and long-term market trends. By comparing the short-term moving averages against the long-term ones, it generates clear buy and sell signals that can guide traders in making informed trading decisions. Key Features: Multiple Moving Averages : Incorpor
FREE

This indicator uses a different approach from the previous version to get it's trendlines. This method is derived from Orchard Forex, and the process of making the indicator is demonstrated in there video https://www.youtube.com/watch?v=mEaiurw56wY&t=1425s .
The basic idea behind this indicator is it draws a tangent line on the highest levels and lowest levels of the bars used for calculation, while ensuring that the lines don't intersect with the bars in review (alittle confusing? I kno
FREE

En esta versión, las alertas están funcionando y en la versión que publicó, la zona muerta de atr era solo una zona muerta sin atr, por lo que también la convirtió en una zona muerta de atr.
Indicator input parameters input int Fast_MA = 20; // Period of the fast MACD moving average input int Slow_MA = 40; // Period of the slow MACD moving average input int BBPeriod=20; // Bollinger period input double BBDeviation=2.0; // Number of Bollinger deviations input int Sensetiv
FREE

ForexBob Candle Timer Is an amazing countdown time indicator which shows the time remaining for next candle to open. It can be used on any timeframe. It helps to plan your next trading action.
Inputs are simple Color - To change the color of displaying time. Size - To set the size of font Next for settings are used to set the location of time Font - To change the font type.
Please check my other products here https://www.mql5.com/en/market/my
FREE

The seven currencies mentioned are: GBP (British Pound): This is the currency of the United Kingdom. AUD (Australian Dollar): This is the currency of Australia. NZD (New Zealand Dollar): This is the currency of New Zealand. USD (United States Dollar): This is the currency of the United States. CAD (Canadian Dollar): This is the currency of Canada. CHF (Swiss Franc): This is the currency of Switzerland. JPY (Japanese Yen): This is the currency of Japan. Currency strength indexes provide a way to
FREE

Are you tired of trading without a clear direction ? Do market fluctuations and noise leave you feeling overwhelmed ?
Here is the solution you've been searching for! Imagine an indicator that simplifies trading, cuts through market noise, and provides crystal-clear signals. The Heiken Ashi OHLC Indicator does just that!
What does the Heiken Ashi OHLC Indicator do? It transforms traditional candlestick charts into a trader's dream. Instead of dealing with erratic price movements, you'll wi
FREE

The Spider ZIGZAG is an algorithm to determine how critical the current peak is by spreading several lines with different parameters instead of one line between each 2 peaks. 1. The more zigzag's lines meet at a peak the higher probability the market will go for correction or change direction. 2. Usually when 3-4 zigzag's lines meet at a peak, the market enters a correction period, this don't happen instantly, it might take some time. 3. Usually when 5-6 zigzag's lines meet at a peak, th
FREE
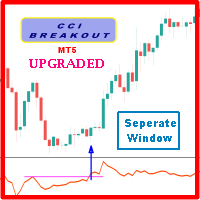
Probability emerges to record higher prices when Commodity Channel Index breaks out oscillator historical resistance level when exhibit overbought values. Since, oscillator breakout of support and resistance have similar effect as price breaks support and resistance levels, therefore, its highly advised to confirm price breakout with oscillator breakout; certainly, will have the same output in short trades. Concept is based on find swing levels which based on number of bars by each side of peak
FREE

Apply to the 5 minute timeframe against the major USD forex pairs. AUDUSD EURUSD GBPUSD USDCAD USDCHF USDJPY Highlights the PropSense Book Levels Turn on/off for Sydney, Asia, London and New York Sessions Shows the Tokyo and London Fixes Turn on/off for Tokyo and London Configure how many historical fixes to show Shows the Sessions Turn on/off visible indication for sessions (supports 4 sessions) Visibly shows the sessions (out of the box configuration for Sydney, Tokyo, London and New York) Hig
FREE

This tool is useful for indicating resistance and support levels It bases on zone in setting to identify top/bottom of candles and and draw rectangle according to those resistance/support level Beside user can edit the zone via dialog on specific timeframe and that value will be saved and loaded automatically. User can determine what strong resistance and support and make the order reasonably.
FREE

This indicator is very useful in observing the direction of the market. It allows users to enter multiple MA lines with specific display method. In addition, it is also possible to change the candle color same to color of the background of chart, so that we only focus on the MA lines. When a signal appears, represented by a red or green dot, we can consider opening a sell (red dot) or buy (green dot) order. Note: it need to set stoploss at the highest value of MA lines (with sell order) or lowe
FREE

This indicator is the converted Metatrader 5 version of the TradingView indicator "ATR Based Trendlines - JD" by Duyck. This indicator works by automatically and continuously drawing trendlines not based exclusively on price, but also based on the volatility perceived by the ATR. So, the angle of the trendlines is determined by (a percentage of) the ATR. The angle of the trendlines follows the change in price, dictated by the ATR at the moment where the pivot point is detected. The ATR percentag
FREE

Gatotkaca Support Resistance Trendline Indicator is a simple indicator that detects support, resistance and trendlines. It will helps you find breakout momentum based on lines calculated by this indicator. This is conceptually based on fractals, but with customizable periods. Compatible for any timeframes. You can customize how this indicator work by setting up the period input.
FREE

Индикатор VR Grid разработан для создания графической сетки с настройками, определяемыми пользователем. В отличие от стандартной сетки VR Grid используется для построения круглых уровней . В зависимости от выбора пользователя, шаг между круглыми уровнями может быть произвольным. Кроме того, в отличие от других индикаторов и утилит, VR Grid сохраняет положение сетки даже при изменении временного периода или перезагрузке терминала. Настройки, set файлы, демо версии, инструкции, решение проблем, мо
FREE
MetaTrader Маркет - единственный магазин, где можно скачать демоверсию торгового робота и подвергнуть его проверке и даже оптимизации на исторических данных.
Прочитайте описание и отзывы других покупателей на заинтересовавший вас продукт, скачайте его прямо в терминал и узнайте, как протестировать торгового робота перед покупкой. Только у нас вы можете получить представление о программе, не заплатив за неё.
Вы упускаете торговые возможности:
- Бесплатные приложения для трейдинга
- 8 000+ сигналов для копирования
- Экономические новости для анализа финансовых рынков
Регистрация
Вход
Если у вас нет учетной записи, зарегистрируйтесь
Для авторизации и пользования сайтом MQL5.com необходимо разрешить использование файлов Сookie.
Пожалуйста, включите в вашем браузере данную настройку, иначе вы не сможете авторизоваться.