Смотри обучающее видео по маркету на YouTube
Как купить торгового робота или индикатор
Запусти робота на
виртуальном хостинге
виртуальном хостинге
Протестируй индикатор/робота перед покупкой
Хочешь зарабатывать в Маркете?
Как подать продукт, чтобы его покупали
Бесплатные торговые роботы и индикаторы для MetaTrader 5 - 7

Why Secutor and If It Can Be Used With Prop Trading Challenges? One of the dirty truths of financial markets is that reliable scalping and high frequency trading algorithms depend on highly complex mathematical functions created by the hands of the brightest minds of programmers and mathematicians. In the world of institutional trading, 50-60 year old technical analysis tools are never used for the validation of any trade decision.
We took the institution way in the development of Secutor EA. O
FREE

With this free tool, you can easily visualize your trades on the chart, view take profit and stop loss values in points and percentages, and enter trades based on percentage of your account balance or specific amounts of money, among many other features. How does it work? Simply fill out the Start Price, TP (Take Profit), SL (Stop Loss), and Volume parameters, and click on the "Open Trade" button to immediately place the order/trade. The "Long" button allows you to select whether you want to Buy
FREE

Fractals Dynamic Fractals Dynamic – это модифицироанный бесплатный индикатор фракталов Била Вильямса, в котором можно вручную задавать количество баров слева и справа, тем самым строив на графике уникальные паттерны. Теперь все торговые стратегии, основанные, либо в основе которых присутствует индикатор Fractals Dynamic, будут иметь дополнительный сигнал.
Кроме того, фракталы могут выступать в качестве уровней поддержки и сопротивлений. А в некоторых торговых стратегиях показывать уровни ли
FREE

Chart Symbol Changer для MT5 - это индикатор / утилита, которая предлагает вам возможность изменить текущий графический символ, на который прикреплен, одним нажатием кнопки символа на его панели. Chart Symbol Changer для MT5 дает вам возможность настроить кнопки с 32 символами в соответствии с вашими личными предпочтениями, добавив пары, за которыми вы хотите следить и торговать чаще. Таким образом, вы никогда не упустите возможность, потому что вы можете быстрее просматривать рынок на св
FREE

Индикатор отображает стакан заявок, а также увеличивает его глубину, запоминая расположение заявок, ушедших за пределы текущего "окна" просмотра.
Возможности индикатора Отображение уровней открытых позиций. Имитация установки/отмены/редактирования отложенных ордеров непосредственно в отображаемом стакане.
Особенности работы индикатора Отображение стакана заявок работает только на тех торговых символах, для которых он транслируется брокером. Для обнуления информации о строках, которые были зафи
FREE

Are you tired of drawing Support & Resistance levels for your Quotes? Are you learning how to spot Support & Resistances? No matter what is your case, Auto Support & Resistances will draw those levels for you! AND, it can draw them from other timeframes, right into you current chart, no matter what timeframe you are using... You can also Agglutinate regions/zones that are too much closer to each other and turning them into one single Support & Resistance Level. All configurable.
SETTINGS
Timefr
FREE

Introducing the Candle Countdown - Your Ultimate Trading Companion! Elevate your trading experience with our innovative Candle Countdown . This powerful tool provides a clear, visual representation of the remaining time until the next candle closes, empowering you to make informed decisions and execute your trades with precision. Key Features: Real-time countdown display, seamlessly integrated into your trading charts Sleek, intuitive design that enhances your chart's visual appeal Adaptive view
FREE
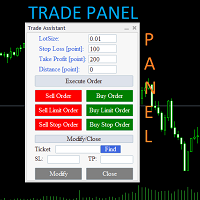
Trade Assistant Panel: Your Optimal Trading Ally "The Trade Assistant Panel" is a graphical tool for traders aiming to simplify and enhance their trading experience. It streamlines order execution and management, allowing you to focus on market analysis and decision-making. With just a few clicks, you can initiate various order types, ensuring that you always have full control over your trading strategy: Buy Orders Sell Orders Buy Stop Orders Buy Limit Orders Sell Stop Orders Sell Limit Orders Y
FREE
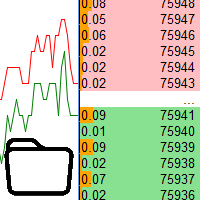
Использование в тестере стратегий данных с биржевого стакана Основные возможности: Одновременное использование нескольких инструментов, до 7 штук Визуализация стаканов С визуализацией стаканов доступно моделирование реального времени, так же ускорение или замедление Работа с библиотекой: Для данного продукта ещё необходима утилита для сохранения данных: https://www.mql5.com/ru/market/product/71642 Утилита для управления скоростью: https://www.mql5.com/ru/market/product/81409 Включаемый файл:
FREE
AvA 3 SET files
AvA 3 - HELLENIC: Dynamic Multi-Module Trading System AvA 3 - HELLENIC is a sophisticated Expert Advisor meticulously engineered for serious forex traders seeking exceptional versatility and precision in automated trading. This powerful EA integrates multiple trading modules within a flexible framework, delivering a complete trading solution adaptable to diverse market conditions. At its core, AvA 3 - HELLENIC features four specialized trading modules - ALPHA, BETA, GAMMA, and
FREE

This plugin is designed to enhance trading efficiency and risk management in scalping strategies. Key features include:
-One-Click Trade Execution: With a single click, the plugin opens two trades simultaneously, each with its own Take Profit (TP1 and TP2) targets. -Automatic Stop Loss Adjustment: The plugin automatically adjusts the Stop Loss (SL) to Break Even (BE) once the price reaches halfway towards TP1, securing partial profits. -Account Protection Features: It includes built-in protecti
FREE

Индикатор Haiken Ashi для MT5 Улучшите свой торговый анализ с помощью индикатора Haiken Ashi для MT5. Этот мощный инструмент преобразует стандартные ценовые данные в более плавные, трендовые свечи, что упрощает идентификацию рыночных тенденций и потенциальных точек разворота. Ключевые особенности: Четкая идентификация тренда: Визуально различайте восходящие и нисходящие тренды по различным цветам свечей. Снижение шума: Фильтруйте ценовые колебания, обеспечивая более четкое представление об осно
FREE

Сканер ценового действия Koala - Раскройте силу ценового действия Введение: Откройте для себя новый сканер ценового действия Koala - универсальный инструмент для многовалютного и многотаймфреймного анализа, предназначенный для выявления основных паттернов ценового действия и их отображения в интуитивной таблице сканера. Аннотация: Этот индикатор выходит за рамки обычного, предоставляя пользователям возможность выявлять ключевые паттерны ценового действия на различных валютах и таймфреймах. Особе
FREE

Дневник трейдера: Статистическая панель по анализу вашего торгового счета для MetaTrader 5. Подробный анализ вашего счета выводом информации на график в реальном времени. Версия МТ4
Полное описание +PDF Как купить
Как установить
Как получить файлы журналов Как тестировать и оптимизировать Все продукты от Expforex Сегодня актуальна торговля сразу по нескольким валютным парам. Однако чем больше количество сделок, тем сложнее анализировать прибыльность каждой из них. Анализ сдело
FREE

Silver Bullet ICT Indicator in MetaTrader 5 The Silver Bullet ICT Indicator is an advanced tool for MetaTrader 5 , designed to analyze market liquidity and key price levels during New York trading hours based on ICT (Inner Circle Trader) principles . This indicator identifies potential trade zones by monitoring high and low price movements and detecting liquidity absorption . When the price reaches a support or resistance level and then retreats to its prior range after capturing liquidity, the
FREE

Описание. Основой формирования графика Ренко является ценовой диапазон. Если цена выходит за его пределы, на графике отображается бокс выше или ниже предыдущего. В результате мы видим ценовое движение без дополнительного "шума" и важные уровни поддержки и сопротивления. Особенности. Для использования совместно с советником реализован дополнительный буфер-счетчик боксов. Для удобства и повышения скорости тестирования пользователь может использовать событие "новый бокс", которое индикатор генериру
FREE

This EA will make it Entry setup based on first FVG formed, and if the price come back it will open the Order You can set silver bullet time A.M or P.M based on your broker server time
Silver bullet time ( EST NY Time +4 ) London : 3 A.M. to 4 A.M. NewYork AM : 10 A.M. to 11 A.M. NewYork PM : 2 P.M. to 3 P.M.
Set the time for beginning setup.
For increace Accuracy you can set DAILY BIAS with BUY = True / False SELL = True / False You can learn from TTrades video daily bias
https://www.yout
FREE

Trading Notes is an innovative tool designed for traders to streamline their decision-making process by allowing them to write and display important reminders or short details directly over their trading charts. This essential feature ensures that traders have quick access to their personalized checklist before opening any positions, enhancing their trading efficiency and accuracy. MT4 Version - https://www.mql5.com/en/market/product/120613 Key Features: Five Customizable Input Fields: Trad
FREE
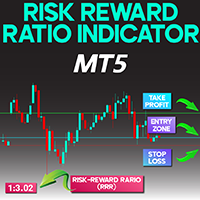
Risk Reward Indicator for MetaTrader 5
The Risk Reward Indicator for MetaTrader 5 is crafted to evaluate and display the Risk-to-Reward Ratio (RRR) with precision, placing the calculated value directly onto the trading chart.
This advanced risk assessment tool showcases the RRR in the upper-left corner of the screen and marks essential trade levels using three clearly defined horizontal lines:
• Green Line: Target Profit (TP)
• Red Line: Protection Stop (SL)
• Blue Line: Entry Point (EP) «Indic
FREE

BeST_Oscillators Collection is a Composite MT5 Indicato r including the Chaikin , Chande and TRIX Oscillators from which by default Chaikin and TRIX Oscillators but not Chande Momentum Oscillator are contained in MT5 platform. It also provides for each Oscillator the option of displaying or not a Mov. Average as a Signal Line and the resulting Signals as Arrows in a Normal (all arrows) or in a Reverse Mode (without showing up any resulting successive and of same type arrows).
Analytically fo
FREE

A fully automatic expert
Designed and produced 100% by artificial intelligence This robot is built by the free ChatGPT Ai. Also, to use the AI tool (a great assistant in MetaTrader), you can see this product : https://www.mql5.com/en/market/product/136348 All trades have profit and loss limits
Attributes: Usable:
in currency pair: EURUSD
in time frame: M30
on Account type: Any
in various brokers
in prop companies
with minimum capital ($100)
FREE

Индикатор PipTick Pivot автоматически вычисляет и отображает уровни пивотов и уровни поддержки и сопротивления. Пивоты могут быть рассчитаны по формулам: Classic, Floor, Fibonacci, Woodie, Camarilla или DeMark. Также имеется возможность выбора периода для расчета индикатора. Можно выбрать дневной, недельный, месячный или пользовательский период.
Типы пивотов Classic. Floor. Fibonacci. Woodie. Camarilla. DeMark.
Основные характеристики Индикатор показывает текущие и исторические уровни пивотов.
FREE
Level Box Tool is a powerful and user-friendly custom indicator designed for traders who utilize technical analysis tools like rectangles and trend lines to identify key support, resistance, and price zones. This tool simplifies and speeds up the process of marking chart levels, offering both visual clarity and precision with its fully customizable panel, and now includes price-cross alerts — so you’ll never miss a key level again. MT4 Version - https://www.mql5.com/en/market/product/136009/ Jo
FREE

Закрытие предыдущего дня и смещение баров для MetaTrader! Индикатор Закрытие предыдущего дня и смещение баров - это инструмент, разработанный для улучшения технического анализа и принятия решений в торговле. С помощью этого индикатора вы получите подробную информацию о уровнях открытия, максимума, минимума и закрытия любого бара, что позволит провести точный и всесторонний анализ движения рынка. Представьте себе возможность поместить один таймфрейм в другой, позволяя детально анализировать кажды
FREE

This is RSI with alarm and push notification -is a indicator based on the popular Relative Strength Index (RSI) indicator with Moving Average and you can use it in Forex, Crypto, Traditional, Indices, Commodities. You can change colors to see how it fits you. Back test it, and find what works best for you. This product is an oscillator with dynamic overbought and oversold levels, while in the standard RSI, these levels are static and do not change.
This allows RSI with alarm and push notifica
FREE

Индикатор MelonMask - Помогает ловить развороты тренда MelonMask — это мощный инструмент технического анализа, специально разработанный для профессиональных трейдеров, который помогает заранее обнаруживать развороты тренда. С помощью усовершенствованного алгоритма на основе Zigzag, он определяет ключевые точки разворота на рынке и предоставляет визуальные сигналы. Особенности индикатора: Зеленые и красные стрелки на точках разворота тренда Прогнозирует возможное направление следующей свечи Легк
FREE

Williams Wizard — это автоматизированная торговая система, разработанная для рынка и построенная на основе надежных торговых принципов. В отличие от многих других систем, он не использует сетку или стратегию мартингейла, которые часто могут приводить к рискованной и непредсказуемой торговле. Вместо этого в этой торговой системе используются высоконадежные и эффективные технические индикаторы, которые измеряют импульс рынка и помогают определить потенциальные возможности для покупки и продажи.Я р
FREE

HiLo Activator is a technical analysis indicator developed by Robert Krausz, a renowned hungarian trader with a career in the USA.
It is a trend indicator that helps you to predict the cange of the current trend. In an uptrend it is displayed at the bottom of the candles; in a downtrend it is displayed at the top.
Its only setting is the calculation period.
It is possible to have alerts when a new trend begin. Enjoy! This is a free indicator, but it took hours to develop. If you want to pay me a
FREE

Free TrendLine EA opens trades whenever the price on the chart interacts with or crosses your trend line. You simply draw the trend line manually then let the EA do the trading automatically according to the rules you give it. The settings available in the EA are explained below: Lots : The lot size for trading. RiskPercentage : Set a value other than zero to activate lot sizing by use of percentage of margin. TrendLineName: The name of the line to track. You can either * rename the trend li
FREE
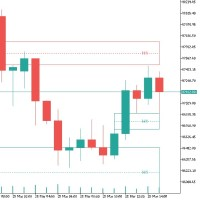
Имбаланс в трейдинге: основы и стратегии Имбаланс в трейдинге — это явление, при котором на рынке наблюдается дисбаланс между спросом и предложением. Это может проявляться как избыток ордеров на покупку (бычий имбаланс) или на продажу (медвежий имбаланс), что приводит к неэффективному ценообразованию и создает возможности для трейдеров. Технические аспекты - «Свечная Модель»: имбаланс часто представлен трехсвечной моделью, где вторая свеча длиннее остальных и определяет направление движения. - «
FREE

Display rectangles and trendlines list from Trading box Technical analysis tool. Objects are ordered in the list by pip distance that is difference between object price and Bid price. With this tool you will know which chart to look for next trading opportunity. No more switching between charts and searching for trades where price is close to rectangle zone or trendline support resistance level. Sorted Rectangles and Trendlines by pip distance - If you are trading on multiple charts, the
FREE
Eight indicator for 3 day/session/week setups. Indicator daily features: Daily close/high/low Weekly open/high/low/close Tokyo/London/New York sessions Alerts Signals and alerts for First Green days First Red days Inside days Outside days 3x days of breakout up 3x days of breakouts down Do not be stupid and take every signal. Learn 3day setups first.
FREE

Торговый советник разработан для автоматизации торговли на финансовых рынках с использованием индикаторов Bollinger Bands и ATR (Average True Range). Он предназначен для работы на платформе MetaTrader 5 и позволяет открывать и закрывать позиции в зависимости от текущих рыночных условий. Оптимизирован для работы на XAUUSD+ с таймфреймом M15 Принцип работы: Индикаторы: - Bollinger Bands: Используется для определения уровней перекупленности и перепроданности. Советник открывает позиции, когда
FREE
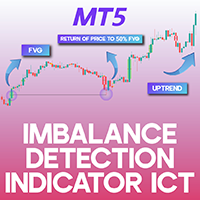
Imbalance Detection Indicator ICT MT5 The Imbalance Detection Indicator ICT MT5 is a specialized tool designed for the MetaTrader 5 platform to recognize three primary types of market imbalances: Volume Imbalances (VI), Opening Gaps (OG), and Fair Value Gaps (FVGs). To enhance readability, the indicator highlights bullish zones in green and bearish zones in red. These imbalances reflect discrepancies between Supply and Demand levels, often signaling areas where price reactions may occur. «Indi
FREE

Бесплатно для ознакомления, ознакомьтесь с платной версией, которая у меня есть за $198
https://www.mql5.com/en/market/product/136928
Этот бот использует стратегию пересечения скользящих средних (MA) со встроенным управлением рисками и дополнительной функциональностью Мартингейла.
Основные параметры:
MagicNumber — уникальный идентификатор для сделок бота, чтобы избежать конфликтов FixedLotSize — базовый размер сделки (например, 0,01) FastValue/SlowValue — периоды для быстрых и медленных MA
FREE

Highly configurable Stochastic indicator.
Features: Highly customizable alert functions (at levels, crosses, direction changes via email, push, sound, popup) Multi timeframe ability Color customization (at levels, crosses, direction changes) Linear interpolation and histogram mode options Works on strategy tester in multi timeframe mode (at weekend without ticks also) Adjustable Levels Parameters:
Stochastic Timeframe: You can set the lower/higher timeframes for Stochastic. Stochastic Bar S
FREE

Engulfing Candle Detector
Detectable pattern Double Candlestick Patterns Bullish Engulfing
The first candle is black candle. The second candle opens with a gap below the real body of the black candle but rallies upwards to close above the real body of the black candle. In other words, the second candle's real body completely engulfs the first candle's real body Bearish Engulfing
The first candle is white candle. The second candle opens with a gap above the real body of the white candle but dec
FREE

Представляем мощный индикатор NRTR (Nick Rypock Trailing Reverse) - обязательный технический инструмент для трейдеров, стремящихся определить развороты тренда и установить эффективные уровни трейлинг-стопов. Разработанный Ником Райпоком, этот индикатор имеет уникальный алгоритм, который адаптируется к постоянно меняющимся рыночным условиям, что делает его ценным дополнением к арсеналу любого трейдера.
Вот два популярных способа использования этого индикатора трейдерами:
1. Развороты тренда: И
FREE

Unlock the power of automated trading with the GA Parabolic SAR Expert Advisor (EA) , a cutting-edge tool designed to revolutionize your trading experience. Built around the highly reliable Parabolic SAR indicator, this EA empowers traders to capitalize on market opportunities with precision and efficiency. Whether you're a beginner or an experienced trader, the GA Parabolic SAR EA offers unparalleled flexibility, allowing you to customize a wide range of parameters to create a strategy tailo
FREE

Volume Profile Indicator – User Guide Description: The Volume Profile Indicator is a powerful tool designed for MetaTrader 5. It visualizes market activity using volume distribution across price levels, showing: Histogram of volume at each price bin POC (Point of Control) – the price with the highest traded volume Value Area – the range covering a configurable percentage of volume (e.g. 70%) Support levels: Min, Max, and Pivot Average tick size for BUY and SELL movements Inputs and Parameters:
FREE

Линии сопротивления скорости - м ощный инструмент для определения тренда и линий сопротивления. Индикатор строит линии с использованием экстремумов графика и специальных математических формул. Индикатор можно использовать для определения направления тренда и точек разворота. <---------------------------->
Параметры индикатора: "Depth of search" - глубина (в барах) поиска экстремумов графика "Back step of search" - минимальное расстояние (в барах) между экстремумами "Deviation of price" - допус
FREE
Данный индикатор позволяет переносить графические объекты (вертикальные, горизонтальные линии, текстовые метки и т.д.) с одного графика на другие. Например вы сможете перенести линии с графика GBPUSD с периодом H1 на график GBPUSD M15. Это позволит упростить выполнение графического анализа. Show label - показывать метку на графике, где установлен индикатор, чтобы не путаться;
Font size - размер текста метки;
Type of synchronisation - тип синхронизации Доступно три типа синхронизации:
all time
FREE

Improved Fair Value Gap Void MT5
The Improved Fair Value Gap (iFVG + Void) indicator for MetaTrader 5 is an advanced iteration of the traditional Fair Value Gap "FVG" indicator. Fair Value Gaps emerge following sharp price movements, marking crucial zones where supply and demand are unbalanced. Price action often gravitates back to these levels. This indicator visually marks bullish Fair Value Gaps (FVG) with green boxes and bearish Fair Value Gaps with red boxes. Additionally, it shades the us
FREE

Introducing the ZigZag Profile — a powerful tool designed to identify high-probability pivot zones where price action frequently reverses. This indicator analyzes historical price data to pinpoint key areas where price has pivoted multiple times, providing traders with actionable insights into potential support and resistance levels. The ZigZal Profile indicator continuously scans for zones where price has reversed direction the most, highlighting these critical areas on your chart. By focusing
FREE
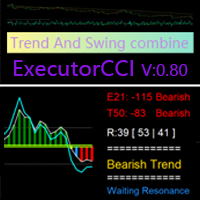
Based on the CCI Trend-Following Principle, Improved to Identify Trend Reversals
This indicator is designed to confirm trends after identifying them using the ( Executor Trend Indicator ) indicator, making it a tool for both trend confirmation and reversal detection. Features Green and Red Histogram: Represents the development of bullish (green) or bearish (red) trends in the current timeframe. Blue Line and Green Histogram (Bullish Confirmation): When the blue line rises above +10
FREE

Уровни Central Pivot Range формируются вокруг центральной точки разворота.
Эти уровни относительно центральной точки разворота могут использоваться для определения многочисленных рыночных поведений и возможных результатов.
Расстояние от центральной точки разворота и цена, которую формируют новые уровни относительно уровней предыдущего дня, могут использоваться для определения направления и силы тренда следующего дня.
Central Pivot Ranges могут выступать в качестве поддержки и сопротивления, п
FREE

Elliot Waves Analyzer calculates Elliot Waves to Help Identify Trend direction and Entry Levels. Mainly for Swing Trading Strategies. Usually one would open a Position in trend direction for Wave 3 or a Correction for Wave C . This Indicator draws Target Levels for the current and next wave. Most important Rules for Elliot Wave Analysis are verified by the Indicator. This free version is limited for Analyzing one Timperiod Waves. Waves are Shown only in PERIOD_H4 and above. Not Useful for Intr
FREE

RSI Grid Scalping Distance (Price go higher after Christmas) The EA was Built for the purpose of scalping the RSI levels by reaching the grid price levels the strategy works like this ( RSI is most typically used on a 14-day timeframe, measured on a scale from 0 to 100, with high and low levels marked at 70 and 30, respectively. Short or longer timeframes are used for alternately shorter or longer outlooks. High and low levels—80 and 20, or 90 and 10—occur less frequently but indicate stronger m
FREE

Индикатор KPL Swing - это простая система технической торговли следующая за трендом, которая автоматизирует вход и выход. Система работает с твердым стоп-лоссом и следующим стоп-лоссом для выхода с прибыльными сделками. Не даются цели, так как никто не знает, насколько высоко (или низко) может двигаться цена. Следующий стоп-лосс блокирует прибыль и убирает эмоции из торговли. Конвертировано с индикатора Amibroker с модификацией.
Идеально в сочетании с KPL Chart Uptrend & Downtrend
FREE

Etot robot rabotayet s peresecheniyem skol'zyashchikh srednikh. Skol'zyashchiye sredniye ispol'zuyutsya v osnovnom dlya otslezhivaniya trendov, osnovnaya tsel' strategii peresecheniya skol'zyashchikh srednikh sostoit v tom, chtoby ispol'zovat' preimushchestva bol'shikh bych'ikh i medvezh'ikh dvizheniy. Vse parametry dostupny dlya redaktirovaniya i prosty v ispol'zovanii, eto eksperimental'nyy proyekt. Ispol'zuyte etogo robota dlya provedeniya issledovaniy i delites' s nami luchshey informatsiye
FREE

Graph configuration and buy and sell signals based on Stormer's (Alexandre Wolwacz, Brazilian trader) swing, position and day trade strategy, described on his youtube channel (https://www.youtube.com/watch?v= 0QZ_NjWkwl0)
The buy and sell indications are based on 2 candle patterns ( Inside Bar [Yellow] and Reversal Closing Price [Blue and Red] ), 3 Moving Averages and 1 Stochastic .
Indicators: Inside Bar - Candle pattern indicating trend continuity, or reversal Reversal Closing Price - Cand
FREE

Continuing the pursuit of better profitability, the Wiki Golden version introduces a new user experience. While the daily order quantity remains limited, its performance is impressive. You can conduct a backtest to see clearer results. Below is the backtested data from January 2022 to December 2023. Wiki Golden has been enhanced with the implementation of simplified parameters compared to its previous versions, providing user convenience. Setup: Target Market : Gold Optimal Timeframe : M30 Ideal
FREE

BUILD YOUR GRID
The expert is a system to help any trader to make a grid of orders (without martingale, lite martingale, or full martingale) easy and simple. Please make your test to find your settings. Default settings are just to take an idea of how the expert works. The expert can make according or contrary grid of orders. You can set the expert to work in hedge mode if the losses are huge. The system uses a high-risk strategy. It's better to test it first in a demo account. Version for MT4:
FREE

Do you love VWAP? So you will love the VWAP Cloud . What is it? Is your very well known VWAP indicator plus 3-levels of Standard Deviation plotted on your chart and totally configurable by you. This way you can have real Price Support and Resistance levels. To read more about this just search the web for "VWAP Bands" "VWAP and Standard Deviation".
SETTINGS VWAP Timeframe: Hourly, Daily, Weekly or Monthly. VWAP calculation Type. The classical calculation is Typical: (H+L+C)/3 Averaging Period to
FREE
БЕСПЛАТНЫЙ ИНДИКАТОР - НЕОГРАНИЧЕННЫЕ СЧЕТЫ - НАЖМИТЕ ЗДЕСЬ ДЛЯ ВСЕХ МОИХ БЕСПЛАТНЫХ ПРОДУКТОВ
SignalXpert был разработан мной для того, чтобы предоставить трейдерам, использующим бесплатный индикатор RangeXpert MT5 , мощный инструмент анализа. Он позволяет одновременно отслеживать до 25 различных активов на разных таймфреймах и распознавать наиболее важные движения рынка в режиме реального времени. Благодаря встроенной функции оповещения, уведомления могут быть отправлены в виде алерта,
FREE

Gold Targets – это лучший трендовый индикатор. Уникальный алгоритм индикатора анализирует движение цены актива, учитывая факторы технического и математического анализа, определяет самые прибыльные точки входа, выдает сигнал в виде стрелки и ценовой уровень ( BUY Entry / SELL Entry ) для открытия ордера . Также сразу же индикатор выдает ценовой уровень для Stop Loss и пять ценовых уровней для Take Profit. ВНИМАНИЕ: Индикатор очень прост в применении. Установите индикатор на график одним к
FREE

Necessary for traders: tools and indicators Waves automatically calculate indicators, channel trend trading Perfect trend-wave automatic calculation channel calculation , MT4 Perfect trend-wave automatic calculation channel calculation , MT5 Local Trading copying Easy And Fast Copy , MT4 Easy And Fast Copy , MT5 Local Trading copying For DEMO Easy And Fast Copy , MT4 DEMO Easy And Fast Copy , MT5 DEMO Расширенные полосы Боллинджера:
1. Рельс Боллинджера изменит цвет в зависимости от направлени
FREE

The Omega Trend Indicator is an advanced tool that has been specifically designed to detect market trends early, and follow them efficiently. The indicator draws two lines. The main (thicker) Trend Line represents the presumed lower or upper volatility limits of the current market trend. A break in the main Trend Line indicates a potential reversal or shift in the movement of the trend. The Trend Line also indicates the best point to place a stop loss order. In Omega Trend Indicator, the Trend L
FREE
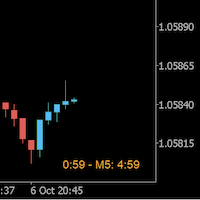
Always wanted to know when the M5 candle closes when you are in M1 ? This indicator allow to display a candle timer (countdown) on the current time frame as well as any higher time frame you have configured for this time frame. So this is easy now to see when the H4 candle closes when you are in H1.
Congifuration Label position, size, color HFT time frame per time frame Any questions or comments, send me a direct message here https://www.mql5.com/en/users/mvonline
FREE

I am a trader specializing in the development of rare , exclusive , high-performance trading bots designed for serious traders who are committed to achieving consistent profitability and success. This free indicator is more than just a visual tool—it powers the Midnight Throttle EA , an automated trading system that executes trades based on the precise market conditions this indicator observes. Midnight Watch : A Pro-Level Tool for Precision Market Analysis. An advanced , multi-functional MetaTr
FREE
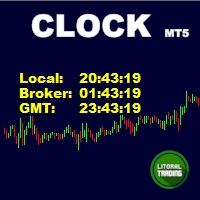
Simple indicator that draws the market hours on chart (broker, local and GMT). Functions: Horizontal distance - from border. Vertical distance - from border. Color - text color. Font - text font. Size - text size. Corner - which chart corner will be drawn. Show seconds - show or hide seconds. Draw as background - candles front or back. Label local - text before local time. Label broker - text before broker time. Label GMT - text before GMT time. Separator - separator between label and time Objec
FREE
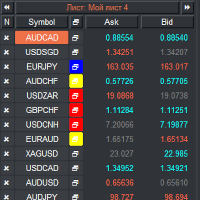
Данный продукт станет платным с мая 2025 года, для новых пользователей. VR Watch list and Linker - приложение скринер для терминала MetaTrader . Облегчает поиск наиболее интересных и техничных финансовых инструментов. Данный скринер применяется трейдерами для торговли на таких биржах как bybit, Московская биржа, Американская биржа, рынок валют и крипто валют, рынок металлов, используется для торговли в проп фирмах. Подбор финансовых инструментов проходит в ручном режиме. Скринер подключает откр
FREE

Understanding the levels of the previous day or week is very important information for your trading.
This indicateur allow to draw Previous day High/Low Previous week High/Low
Congifuration High & Low for: Previous day, week Line Style, color Label position, size, color Any questions or comments, send me a direct message here https://www.mql5.com/en/users/mvonline
FREE

Потому что стиль имеет значение
Я знаю, как надоедает каждый раз нажимать свойства, чтобы изменить цвет свечи, фон на светлый или темный, поставить или убрать сетку. Вот решение, которое можно найти одним щелчком мыши: Три настраиваемые кнопки для выбора нужного трейдерам стиля свечи. Одна кнопка для переключения между дневным и ночным режимом. Одна кнопка, чтобы показать или скрыть сетку на графиках. *****В настройках вы можете выбрать, где кнопки должны отображаться на экране*****. Пожалуйс
FREE

Советник Opening Gap особенно подходит для торговли на гэпах при открытии цен на акции. Поскольку акции обычно растут больше, чем падают, открываются только позиции на покупку. Сделка размещается незадолго до окончания торговых часов и закрывается на следующий день сразу после открытия. Созданный здесь разрыв затем принимается как прибыль. Хорошая прибыль была получена в ходе тестирования NVDA. Этот советник станет хорошим дополнением к вашему портфолио советников.
Преимущества советника:
FREE
The Expert Advisor (EA) is based on the Dynamic Linear Regression indicator ( https://www.mql5.com/en/market/product/49702 ).
User inputs: Number of candles is considered when calculating linear regression; Distance to the top line; Distance to the bottom line; Stop the loss of. The EA executes purchase and sale orders in the market when the value of a line, higher or lower, is reached at the current price, when the lower line is reached, a buy order at market is executed and when the upper li
FREE
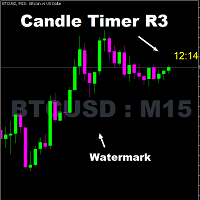
Timer remaining to finish the candle. A simple informative indicator of how much time is left until the current candle ends. In a simple, easy and objective way. In the input parameters, enter the desired color of the clock, the font size and the displacement to the right of the candle. I hope I helped with this useful and free tool. Make good use and good business.
FREE
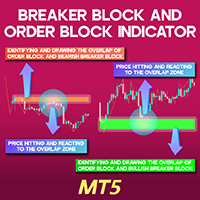
Breaker Block and Order Block Indicator for MT5
The Breaker Block and Order Block Indicator (BB+OB) is specifically developed for traders using ICT strategies to recognize key market zones. This tool employs a unique algorithm to detect intersections of Order Blocks and Breaker Blocks , highlighting them on the chart in green for bullish zones and brown for bearish zones on the MetaTrader 5 (MT5) platform. By utilizing this indicator, traders can improve their market entries and exits, refining
FREE

Closing Price Reversal is a very well known and traded candlestick pattern. This little indicator paints with specific (user-selected) colors the Closing Price Reveral Up and Down patterns, as well as the Inside Bars (as a bonus). Higher timeframes are more effective as with all other candlesticks patterns. Do NOT trade solely on this indicator. Search the web for "Closing Price Reversal" to learn about the several approaches that can be used with this pattern. One of them is combining short/me
FREE

Откройте для себя Ритм рынков: автоматическое тестирование стратегий Price Action Испытайте мощь нашего революционного продукта для бэктестинга концепции Price Action, способного провести многолетнее тестирование за считанные секунды.
Попрощайтесь с сотнями часов ручного анализа и приветствуйте мгновенные инсайты.
Наш автоматизированный инструмент бэктестинга позволяет трейдерам создавать и тестировать стратегии с нуля, а также оптимизировать и совершенствовать свои текущие стратегии.
Автома
FREE
MetaTrader Маркет - уникальная площадка по продаже роботов и технических индикаторов, не имеющая аналогов.
Памятка пользователя MQL5.community расскажет вам и о других возможностях, доступных трейдерам только у нас: копирование торговых сигналов, заказ программ для фрилансеров, автоматические расчеты через платежную систему, аренда вычислительных мощностей в MQL5 Cloud Network.
Вы упускаете торговые возможности:
- Бесплатные приложения для трейдинга
- 8 000+ сигналов для копирования
- Экономические новости для анализа финансовых рынков
Регистрация
Вход
Если у вас нет учетной записи, зарегистрируйтесь
Для авторизации и пользования сайтом MQL5.com необходимо разрешить использование файлов Сookie.
Пожалуйста, включите в вашем браузере данную настройку, иначе вы не сможете авторизоваться.