Смотри обучающее видео по маркету на YouTube
Как купить торгового робота или индикатор
Запусти робота на
виртуальном хостинге
виртуальном хостинге
Протестируй индикатор/робота перед покупкой
Хочешь зарабатывать в Маркете?
Как подать продукт, чтобы его покупали
Бесплатные торговые роботы и индикаторы для MetaTrader 5 - 27

AliPivot Points is a Meta Trader 5 Indicator that draws you the latest pivot points. You can choose from timeframes ranging from 1 Minute to 1 Month. Calculation methods for pivot points includes: Classic Pivot Points Camarilla Pivot Points Fibonacci Pivot Points Woodie Pivot Points You can personalize the line colors, style, and width to suit your preference. The indicator displays values on the right side of the chart. AliPivot Points values can also be utilized by developers for creating Expe
FREE

Сканер Панели CCI для MT5 Сканер Панели CCI для MT5 — это инструмент, который помогает отслеживать уровни Индекса Товарного Канала (CCI) на различных временных интервалах и инструментах, а также предоставляет оповещения в реальном времени, когда обнаруживается новый сигнал. Он удобен в использовании и не требует больших вычислительных ресурсов, что обеспечивает плавную работу на любом компьютере. Ключевые функции Автоматическая группировка инструментов : Сканер собирает все инструменты из вашего
FREE

Удобный трендовый индикатор. Не меняет своих значений. Имеет огромные возможности для настройки. Не требователен к ресурсам компьютера. Создавался для работы в системе BearsHunter. Эксперт МТ5 с использованием данного индикатора: https://www.mql5.com/ru/market/product/30381 Эксперт МТ4 с использованием данного индикатора: https://www.mql5.com/ru/market/product/30383
Параметры:
m1_MA_Mode_1 - метод усреднения(0-9). m1_MA_Mode_2 - метод усреднения(0-9). m1_MA_Mode_3 - метод усреднения(0-9). m1_P
FREE

Цвета генерируются в зависимости от объема торгов и направления рынка.
Анализ осуществляется по направлению цены и объема торгов, если объем торгов превышает расчетную базу система меняет цвет на зеленый, информируя вас о сильном направлении цены на покупку, если торгуемое значение меньше база расчета системы меняет цвет на красный, указывая на сильную цену на продажу.
FREE
Use Day Trading Tracker to keep a record of your earnings across accounts. This indicator will show a dashboard in the Meta Trader chart to show for the profit or loss money in your account. It’s easy to see just how much money you’re making matched betting with the Forex Trading Profit Tracker. Key features: Track your profit over time Check out your stats. Track expected profits against actual profits. Export account history to Excel. MT4 version: https://www.mql5.com/en/market/product/39113
FREE

Several assets in several markets have the behavior of using specific numbers as Force Numbers, where support, resistance and price thrust is created. Let this indicator draw those levels of support and resistance for you. You can also stack it to show different level of Prices! This technique is being used by Tape Readers and Order Flow traders all over the world for a long time. Give it a try. Challenge yourself to study new ways of Price Action!
SETTINGS
What Price reference to use in the c
FREE

Mini One for All Trend Scanner is a trend following multi-symbol indicator that can be used with any input: forex, stocks, commodities,... The panel shows three indicators and six symbols with the trend for every pair (symbol/indicator): up, down or no trend. The indicators are: Average Directional Movement Index (ADX) Moving Average Convergence Divergence (MACD) Relative Strength Index (RSI) You can change quickly the chart by clicking any one of the symbol button in the panel. This feature
FREE

ВАЖНО: ЭТОТ ЭКСПЕРТ ПРЕДНАЗНАЧЕН ТОЛЬКО ДЛЯ ЗАГРУЗКИ ДАННЫХ И НЕ ВЫПОЛНЯЕТ НИКАКИХ ТОРГОВЫХ ОПЕРАЦИЙ Функция советника: Загружать исторические данные точно, правильно и быстро. Необходимость: Иногда мы замечаем, что некоторые индикаторы, содержащие рисунки, графики, линии и стрелки, ведут себя странно при размещении на графике или при переключении между таймфреймами. Рисунки и линии могут неестественно перемещаться на основном экране. Эта проблема возникает из-за отсутствия необходимых данных, к
FREE

Этот продукт предназначен для отображения торговых сессий 15 стран на основе часового пояса вашего брокерского сервера и различных режимов отображения на основе желаемых вами настроек для предотвращения перегрузки графиков и возможности установки сессии в желаемое пользователем время.
На рынке Форекс никогда не заходит солнце, но его ритм танцует в такт отдельным торговым сессиям. Понимание этих сессий, их совпадений и их уникальной атмосферы имеет решающее значение для любого трейдера форекс,
FREE

This Price indicator aid you to read prices of a bar without using native MT5 instuments like crosshair.
The indicator gives you the OPEN HIGH LOW CLOSE and 50% bar prices of the current or one of the previous bar.
Parameter setting are: TimeShift: Used for bar selection (0 stand for current 1 for previous 2 for 2 bars ago) Other parameter are using for esthetics. Each Label can be moved away from its initial position.
FEEL FREE TO REPORT BUG AND REVIEW THIS INDICATOR. THANKS
FREE
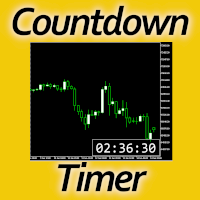
Timing can make the difference between a winning and a losing trade. Therefore, a bar countdown display is a must-have tool for any trader. Knowing exactly how much time is left, before the current bar will close, certainly helps decision-making in real time. Technical detail: This indicator uses the MQL5 function "OnTimer", ensuring the accurate measure of each passing second, rather than relying on the flow of incoming tick information from the server. Most other countdown indicators for MetaT
FREE

O Touch VWAP é um indicador que permite calcular uma Média Ponderada por Volume (VWAP) apenas apertando a tecla 'w' no seu teclado e após clicando no candle do qual deseja realizar o calculo, clicando abaixo do candle é calculada a VWAP baseado na minima dos preços com o volume, clicando sobre o corpo do candle é calculado uma VWAP sobre o preço medio com o volume e clicando acima do candle é calculado uma VWAP baseado na máxima dos preços com o volume, voce tambem tem a opção de remover a VWAP
FREE

Apply to the 5 minute timeframe against the major USD forex pairs. AUDUSD EURUSD GBPUSD USDCAD USDCHF USDJPY Highlights the PropSense Book Levels Turn on/off for Sydney, Asia, London and New York Sessions Shows the Tokyo and London Fixes Turn on/off for Tokyo and London Configure how many historical fixes to show Shows the Sessions Turn on/off visible indication for sessions (supports 4 sessions) Visibly shows the sessions (out of the box configuration for Sydney, Tokyo, London and New York) Hig
FREE

Анализ проскальзывания, предназначенный для высокоточной торговли и всего рынка Он работает как на реальных, так и на демо-счетах и позволяет анализировать все ваши позиции с тейк-профитом и стоп-лоссом, чтобы вы могли анализировать проскальзывание вашего брокера.
Что такое проскальзывание в торговле? Проскальзывание или скольжение — это разница в цене, которая может возникнуть между моментом размещения торгового ордера и его фактическим исполнением на рынке.
Это связано с тем, что с момент
FREE

Trade Performance Journal — Your Visual Trading Summary Tool Trade smarter by understanding your performance.
This Expert Advisor (EA) provides an instant visual summary of your trading results directly on the chart. Whether you’re a scalper, swing trader, or long-term investor, this tool helps you stay on top of your performance metrics with ease. Key Features Flexible Time Analysis
View your performance by Quarter, Month, or Half-Year. Easily switch between display modes to analyze your res
FREE

I’m sharing this EA here for free to support the trading community. I hope it’s helpful, and don’t hesitate to reach out if you have any questions or feedback!
Requirements
Trading pairs all trending Pairs especially USDJPY
Timeframe M1 to H6
Minimum deposit $ 100 Leverage 1:200 Brokers Hedging Pro or ECN Account
Key Features: Versatile Timeframe Trading : Operates effectively on all timeframes, from the swift M1 to the more extended D1, accommodating a wide range of trading strategies and
FREE

SuperTrend Indicator for MetaTrader 5
Ride Trends Like a Pro — Never Miss a Move Again Description:
The SuperTrend Indicator is your ultimate companion for mastering trend-following strategies. Designed to cut through market noise, this powerful tool combines the precision of Average True Range (ATR) with adaptive trailing stops to pinpoint trend reversals, confirm breakouts, and keep you on the right side of the market. Whether you’re trading forex, stocks, crypto, or commodities, the SuperTr
FREE

Основное: Не мартингейл, не сеточник; Работает на всех парах;
Сигналы: В основе хороший рациональный алгоритм. Работа по взаимодействию двух индикаторов: Envelopes и Moving Average (можно задавать отдельный Timeframe для каждого индикатора)
Stop Loss/Take Profit: Присутствует хорошая система money management (есть несколько вариантов trailing stop loss); Присутствуют виртуальные уровни Stop Loss/Take Profit Возможность работать фиксированным лотом, либо "умным" лотом (процент риска от капита
FREE

«HiperCube USD INDEX (DXY /USDX) » — это финансовый бенчмарк, представляющий собой производительность определенной группы активов, таких как акции, облигации или сырьевые товары, стоимость которых выражена в долларах США. Эти индексы помогают инвесторам отслеживать и сравнивать производительность определенных секторов или рынков с течением времени. Выражаясь в долларах США, индекс обеспечивает последовательную меру оценки инвестиций независимо от национальной валюты активов или географического
FREE

https://www.mql5.com A double moving average indicator This indicator uses the system's own two different time period of moving average indicators to reflect the movement of market prices. It is recommended that you use the default parameter Settings, which you can set according to your own experience to get the best predictive power. I hope it can provide some help for your trading.
FREE

Добро пожаловать в HiperCube VIX Код скидки на 25% на Darwinex Zero: DWZ2328770MGM
Этот индикатор предоставляет вам реальную информацию о рынке объема sp500 / us500
Определение HiperCube VIX, известный как индекс волатильности CBOE, является широко признанным показателем рыночного страха или стресса. Он сигнализирует об уровне неопределенности и волатильности на фондовом рынке, используя индекс S&P 500 в качестве прокси для широкого рынка. Индекс VIX рассчитывается на основе цен опционных кон
FREE

Этот советник предлагает функции: многофункциональная панель графиков, продажа, покупка, отложенные ордера, функция реверса, Частичные продажи (автоматически по стратегии), Tralling-Stop (автоматически по стратегии), Три торговые стратегии, Стоп-лосс на день (управление рисками), стоп-лосс (управление рисками), тейк-профит (управление капиталом), Tralingstop и Traling-Step (стратегия), риск на ордер (управление рисками) и многое другое!
Настраиваемые параметры:
Настройки советника
1: Звук (В
FREE

For those Price Action traders who love to trade strong Price points, like today's Opening Price (or even yesterday's Price), here is an indicator to ease the identification of those values, drawn directly on your chart! Opening Price will automatically draw a line showing you this point for you, AND, if you like any OPENing price in the past, not just today's price. A must-have in your Price Action toolbox!
SETTINGS
How many past days do you want to be drawn? Do you want to draw the current da
FREE

QuantumAlert Stoch Navigator is a free indicator available for MT4/MT5 platforms, its work is to provide "alerts" when the market is inside "overbought and oversold" regions in the form of "buy or sell" signals. This indicator comes with many customization options mentioned in the parameter section below, user can customise these parameters as needful. Join our MQL5 group , where we share important news and updates. You are also welcome to join our private channel as well, contact me for the p
FREE

El **Heiken Ashi Smoothed** es una versión suavizada del indicador técnico Heiken Ashi, que se utiliza en el análisis de gráficos de velas para identificar tendencias del mercado y pronosticar movimientos de precios. Este indicador se basa en el promedio de datos de precios para formar un gráfico de velas que ayuda a los traders a filtrar el ruido del mercado.
**¿Para qué sirve?** Este indicador se utiliza para identificar cuándo los traders deben permanecer en una operación y cuándo está por
FREE

Представляем Вам Volatility Doctor Compass – Ваш надежный проводник к прибылям на любом рынке!
Раскройте Секреты Вечных Математических Законов: Окунитесь в суть мастерства торговли с нашей уникальной технологией, укорененной в математических принципах, которые выходят за пределы каждого рынка. Хотя мы не раскрываем секреты, будьте уверены, эта инновация – ваш билет к непревзойденной надежности в любых рыночных условиях.
Революционная Двойная Функциональность: Представьте себе возможност
FREE

Please backtest with the exact balance of your live account before applying to real money. ==> If account balance is too low it may not trade at all!
For MT4 version please contact via private message. martingale version is available here . Strategy description - Detect trend based on EMA18-EMA50-SMA200 alignment in three time frames: M15, H1, H4 - Trade in trend direction and exit when above alignment is broken. - The bot is tuned to trade XAUUSD(Gold). - The bot output is break even in rangin
FREE

Switch Tray is a shortcut tray tool for commonly used trading pairs provided to traders. It can be placed at the bottom of the chart, and commonly used trading pairs can be set by themselves. 1. You can set the shortcut switch button for your commonly used trading pairs. The default is [EURUSD/GBPUSD/XAUUSD/USDJPY/USDCHF/USDCNH]. / slash is the separator. 2. The button of each trading pair is also equipped with the number of open positions of a certain trading pair. 3. Multi-cycle quick switchi
FREE

The TradeQL Indicator is a customizable tool that highlights specific trading patterns on candlestick charts. Users can define patterns through TradeQL queries, which the indicator then applies to the chart, visually representing matches and captured groups. Ideal for identifying complex trade setups in real-time.
TradeQL queries are specified using the TradeQL Language. See https://github.com/abdielou/tradeql for more details. This language is expressed as a regular expression. The language al
FREE

Elevate Your Trading Game with the Ultimate Trade Manager for MT5! Join us at Discord: https://ap.lc/lRslZ Key Features That Traders Love: User-Friendly Interface: Intuitive and easy to use; perfect for pro’s and beginners.
Order types : Market execution and Pending orders
Risk calculation: Determine trade size instantly based on defined risk, so you never have to do the quick calculations yourself.
Fast Execution: Enter and exit trades in the blink of an eye. Speed is profit
FREE

Totally linked to the result of a movement and the duration he had. Its height records how many ticks the asset walked during a given movement, its width shows us the duration that movement had. Its configuration must be in line with the Weis Wave Indicator configuration to observe the movement force and can indicate a possible accumulation or distribution of the movement;
FREE
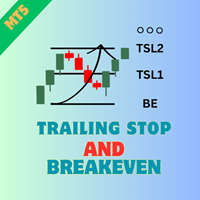
Product Name: Trailing Stop and Breakeven Management EA Description:
This EA (Expert Advisor) is designed to set trailing stops and breakeven levels for trades based on input parameters and a magic number in MT5. It can be used to manage trades placed manually or by any other EA. The EA allows customization of various settings to suit your trading strategy. General Settings: Enable Magic Number (ENABLE_MAGIC_NUMBER): Enable to use a magic number for trades. Set to false for manual trades. Magic
FREE

Индикатор Magic LWMA очень помогает в определении направления тренда. Он может стать отличным дополнением к вашей существующей стратегии или основой для новой. Мы, люди, можем принимать лучшие решения, когда лучше видим визуально. Поэтому мы разработали его, чтобы отображать разные цвета для восходящих и нисходящих трендов. Каждый может настроить это так, как ему больше всего подходит. Установив период тренда, мы можем оптимизировать его для более длинных или коротких трендов для нашей стратеги
FREE
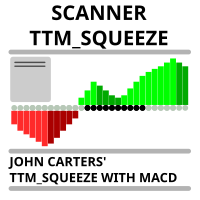
Сканнер рынка по индикатору, опубликованному здесь Скачайте Технический индикатор 'John Carters TTM Squeeze with MACD' для MetaTrader 5 в магазине MetaTrader Market (mql5.com) . Сканируются только инструменты, которые есть в окне Обзор Рынка. Максимальное количество инструментов для сканирования до 5000. Таймфрейм сканирования выбирается с панели таймфреймов терминала. Для использования откройте любой график и присоедините советник к графику, в левом верхнем углу появится кнопка 'Search'. При
FREE

Time and Price Fractal Studies is an indicator that will help you identify certain patterns that tend to repeat themseleves at certail times of the day or at certain prices. It is used to study Fractal Highs ad Lows in relation to time and price. You will get to answer certail questions like: At what time of day does this market usually turn around. At what price does the market turn. Is it at round numbers etc.
FREE

For those traders and students who follow the famous brazilian trader Igor Rodrigues (Mago Trader) here it is another tool he uses: a 2-line MACD specially set with Phi ratios. This MACD is packed with a twist: a Filling Area , to easily and visually spot the corresponding trend on the chart. Obviously, you can turn On and Off this filling feature. If you don't know Igor Rodrigues and you are a brazilian trader and student, just google for him... Very simple and useful indicator.
If you are loo
FREE

Transform your financial chart analysis with our innovative Candle Coloring Indicator. This powerful tool allows you to instantly visualize market trends based on closing prices relative to a customized average. Customized Coloring: Choose colors that best suit your analysis style. Highlight candles above the average in a vibrant color of your choice and candles below the average in another distinctive color. Adjustable Average: Tailor the indicator to your trading strategies by setting the aver
FREE

Индикатор определяет кратко-, средне- и долгосрочные максимумы и минимумы рынка согласно методу, описанному Ларри Вильямсом в книге "Долгосрочные секреты краткосрочной торговли".
Кратко о принципе определения максимумов и минимумов рынка Краткосрочным максимумом является максимум бара с более низкими максимумами по обе стороны от него и наоборот - краткосрочным минимумом бара является минимум с более высокими минимумами по обе стороны от него. Среднесрочные максимумы и минимумы определяются по
FREE

Server Timer
Version: 1.2 The Server Time Clock Indicator is a lightweight and visually appealing tool for displaying the server's current date and time directly on the chart. This indicator updates dynamically every second and provides the following features: Customizable Appearance : Adjust font color, background color, and font size to match your chart's theme. Day and Time Display : Shows the current day, date, and time in an easy-to-read format ( Day{MM/DD} HH:MM:SS ). No Performance Over
FREE

Классический индикатор фракталов является запаздывающим, т.к. для подтверждения образования фрактала необходимо ждать 2 бара. Если этого избежать, то индикатор будет перерисовывающим, т.е. при обновлении максимума/минимума в течении 2-х баров фрактал будет менять своё положение на более позднее. В данном продукте максимально нивелированы оба этих недостатка, при этом совмещены достоинства обоих подходов! Индикатор показывает фрактал сразу в момент его образования, а в случае его обновления показ
FREE

Triple Threat is the latest offering from Algotrading_za It uses Bollinger Bands and RSI to determine entry positions with MACD as confirmation of trend. It also has a time filter to define trading times. This EA is highly configurable and can be optimized to be used on most currencies.
The money management section is also highly configurable and does not make use of any risky strategies like martingale etc..
FREE

Positions panel
This is a panel for counting current icon holdings. Convenient traders at any time to view the position and profit and loss situation. Perfect for traders who like to hold multiple orders at the same time. Main functions: Position statistics Total profit Average price calculation TP price calculation ST price calculation Positions valume
FREE

Simple Trading Panel is a manual tool for safe trading. Monitored by the mentor and indicators. This panel has many useful settings to take your trading to the next level.
Simple Trading Panel offers features:
Adjustable stop loss, take profit, volume, trailing stop with profit in percent, risk ratio, news filter and much more. Test results Simple Trading Panel does not work in the strategy tester!
Recommend Account type: Hedging, Zero, Micro, Standard, Premium or ECN Brocker with low spread
FREE
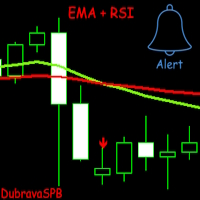
Представляем EMA + RSI – индикатор для торговли, который сочетает в себе анализ экспоненциальных скользящих средних (EMA) и индекса относительной силы (RSI) . При пересечении двух EMA и достижении RSI заданных условий индикатор сигнализирует о входе в сделку с помощью стрелок на графике. Индикатор изначально оптимизирован для валютной пары GBPUSD на таймфрейме 1H , однако пользователь может адаптировать его под свою стратегию. Основные характеристики : Гибкость настроек : пользователь может меня
FREE

Prospector Scalper EA - полностью автоматический советник, ведущий скальперскую торговлю в периоды высокой волатильности при помощи гибридного алгоритма умножения лота. Торговля ведется рыночными ордерами, а процесс принятия решений скрыт от брокера. Данный советник работает на любой паре, но лучше всего работает на EURUSD и USDJPY с таймфреймом M5. Для работы этой системы рекомендуется VPS-сервер. В разделе "Обсуждение" представлены результаты тестирования и оптимизированные настройки. Сигналы
FREE

The THREE DRAGONS is a technical indicator that portrays three mystical Chinese dragons flying through the price chart:
1. The Green Dragon (SeaGreen): - The most agile and fastest of the three - Reacts quickly to market direction changes - Usually leads the movements
2. The Red Dragon (Tomato): - Moves with balance between speed and caution - Confirms movements initiated by the Green Dragon - Its interactions with the Green Dragon may indicate opportunities
3. The Black Dragon (Black): - Th
FREE

Индикатор строит кривую разности значений двух торговых инструментов (валютных пар). Назначение индикатора - наблюдение процессов расхождения и схождения значений двух торговых инструментов. Полученные результаты могут использоваться для торговли по стратегиям статистического арбитража, парного трейдинга, корреляции, и другим.
Стратегия торговли
Индикатор прикрепляется к графику любого торгового инструмента. Во входных параметрах задаются названия торговых инструментов, разность значений которы
FREE

Earlion - эффективный сеточный советник для торговли на валютных парах AUDCAD, AUDNZD, NZDCAD . Для открытия позиций советник использует данные индикатора BB. Выход автоматический и зависит от текущего риска. Главной особенностью советника является возможность минимизировать риск потери депозита при открытии большого количества позиций на одной валютной паре. При достижении указанного количества открытых позиций советник ищет возможность закрыть их с минимальными потерями или вовсе без потерь.
FREE

ATR Moving Average draws a moving average of the standard Average True Range( ATR ) in the same window.
Settings Name Description ATR period
Set Price per iod for ATR calculation
ATR level Set ATR value for thresholding( only whole number, ignore leading zeros e.g. 0.00089 = 89 ) MA Period Set moving Average Period MA Method Set moving average method( Simple, Exponential, Smoothed and Linear Weighted ) MA Shift
Set moving average shift
Enable Alerts ? Generate Alert when ATR crosses Moving
FREE
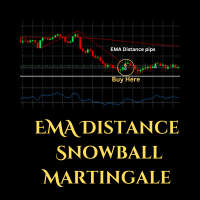
Expert Advisor (EA) that utilizes the basic EMA Distance strategy along with RSI for take profit, and employs support and resistance levels from the Zigzag indicator as stop-loss and take-profit points, you can follow these guidelines: Dow Theory Strategy : This involves analyzing trends using the Dow Theory principles, mainly focusing on identifying primary trends (bullish or bearish) and secondary trends (corrections). You'll need to implement rules for identifying these trends based on price
FREE

Отображает текущую рыночную информацию с ежесекундным обновлением Размер спреда; Размер свопа: для коротких и длинных позиций; Местное время (опционально); Многофункциональная утилита : 66+ функций, включая этот индикатор | Напишите мне если у вас есть вопросы | MT4 версия В настройках индикатора вы можете настроить: Размер шрифта; Цвет текста; Выбрать позиционирование: левый / правый угол графика; Местное время: вкл/выкл; Файл программы должен быть помещен в папку " Indicators ".
FREE

Trading setup could be a simple thing.
Triple Moving Average is a popular trading strategy to analyze market trends. It provides clear signals for identifying uptrends and downtrends based on the relative positioning and crossovers of short-term, medium-term, and long-term. Comparing Triple MA of two different time frame, provide a comprehensive look of price movement.
FREE

If you like this project, leave a 5 star review. Often times we are using brokers that are outside of the GMT-0 timezone, this
not only complicates things, but, it can make seeing when a trading session starts
a bit more difficult than it should. This indicator allows you to set a timezone offset it will draw a vertical line for the: Day. Week. Month. Quarter. year.
FREE
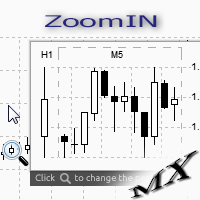
Индикатор ZoomIN MT5 предназначен для быстрого просмотра выбранного бара на младших таймфреймах во всплывающем окне. После запуска индикатор работает в фоновом режиме, не занимает места на графике и не потребляет ресурсы системы. При активации индикатора комбинацией Shift + i (есть возможность изменить в настройках), создается всплывающее окно с графиком младшего таймфрейма. Отображаемый таймфрейм можно изменить щелчком левой кнопки мыши по значку лупы. Чтобы скрыть всплывающее окно, достаточно
FREE

Copy trades with ease using the MetaTrader5 trade copier - the quickest and easiest way to copy transactions between different MetaTrader 5 accounts! This innovative tool allows you to locally copy trades in any direction and quantity, giving you full control over your investments. Designed to work on both Windows PC and Windows VPS, this program is versatile and adaptable to your trading preferences. Whether you prefer to work from your desktop or a virtual private server, the MetaTrader5 trade
FREE

ForexBob Candle Timer Is an amazing countdown time indicator which shows the time remaining for next candle to open. It can be used on any timeframe. It helps to plan your next trading action.
Inputs are simple Color - To change the color of displaying time. Size - To set the size of font Next for settings are used to set the location of time Font - To change the font type.
Please check my other products here https://www.mql5.com/en/market/my
FREE

Revialon – The Art of Adaptive Trading Like a masterful composer shaping a symphony, Revialon lets you orchestrate the market’s rhythm with precision and control. Fueled by ATR-driven volatility analysis and the timing precision of the Stochastic Oscillator , it provides a dynamic framework where you set the rules, refine the execution, and optimize the outcome . Shape Your Trading Masterpiece: Fully Customizable Strategy – Every setting is in your hands, allowing you to build a trading sys
FREE

"Five Minute Drive" indicator that is designed to be used in the 5 minute timeframe only. One of its most important advantages is that it shows the general trend in the upper time frames when looking at the 5-minute timeframe. Therefore, when opening positions in the 5 minute timeframe, when it is in line with the trends in the upper timeframes, you are less likely to be upside down. If you can interpret the curvilinear and linear lines drawn by this indicator on the graphic screen with your geo
FREE

Are you tired of the stress and frustration that come with Forex trading? Introducing G FORCE , the ultimate solution for a seamless and profitable trading experience. This expertly crafted EA (Expert Advisor) is designed to take the emotion out of trading, allowing you to trade with confidence and ease. G FORCE isn’t just another trading robot; it’s your professional trading partner, engineered to generate consistent profits while you sit back and relax. Whether you're new to trading or a seas
FREE

Ever wanted to use StochRSI on MetaTrader5 Terminal which you see and use on TradingView? Now you can use same StochRSI indicator in your MetaTrader5 and enjoy more time in Trading.. You can change StochRSI settings if you want to change and it will be ready to use for you... Now you will not go anywhere to use only indicator there... Open charts , load Indicator this Indicator and you are ready to do analysis in MetaTrader5 and Put Trades when you feel okay with your analysis.
FREE
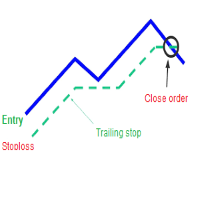
A trailing stop loss is a type of day-trading order that lets you set a maximum value or percentage of loss you can incur on a trade . If the security price rises or falls in your favor, the stop price moves with it. If the security price rises or falls against you, the stop stays in place. With this version, you can run trailing stoploss with currencies (ex start when profit more 1$, trailing stop with 2$...)
FREE

1. Эта система является локальной документарной системой, то есть запускающая и принимающая стороны должны работать с одним и тем же компьютером, так как номер счета MT4 / 5 может быть зарегистрирован на нескольких компьютерах одновременно, так что нужно только посылать клиенту пароль на один счет. Локальная документация очень быстрая и стабильная, поскольку она не связана с интернетом.
2. в настоящее время для приема, загрузка в график требует перехода в входной параметр на счет mt4 / mt5
FREE
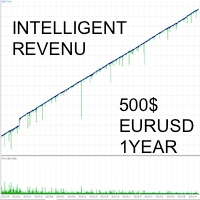
The INTELLIGENT INCOME strategy is a combination of custom indicators and a very advanced trading algorithm. It has been tested with real ticks, and passed the stress test with slippage approximating real market conditions over a period of 5 years. SMART INCOME EA IS FOR THOSE WHO: - HAVE NO KNOWLEDGE PUSH IN TRADING - WANT TO HAVE A PASSIVE INCOME EVERY DAY - WISH TO ATTEND OTHER OCCUPATIONS - WISH TO RISK THE MINIMUM CAPITAL POSSIBLE
FEATURES - Only with the EURUSD pair; The Multi-currency o
FREE

Highly configurable CCI indicator. Features: Highly customizable alert functions (at levels, crosses, direction changes via email, push, sound, popup) Multi timeframe ability Color customization (at levels, crosses, direction changes) Linear interpolation and histogram mode options Works on strategy tester in multi timeframe mode (at weekend without ticks also) Adjustable Levels Parameters:
CCI Timeframe: You can set the current or a higher timeframes for CCI . CCI Bar Shift: you can set t
FREE

SWING EXCHANE BOT & SWING BOT Description
The bot is based of capturing the gains from fluctuation or swings, and exchange them in 4 pairs on 44 Exponential moving averages, period by allowing the orders to execute in differences between quoted prices in the market on open price. Also can be used without exchange and based only on fluctuations on the markets for any pair. Settings Swing bot exchange-Trading style (Arbitrage) (true/false)(Chosen in 4 pairs) Swing bot-Trading Style (Trend) (true
FREE

Description :
Combination MT5 is a professional indicator based on the Stochastic Oscillator and Average True Range (ATR) technical indicators, thus, you can use it with any currency pair and any timeframe.Trade signals from Combination MT5 are drawn on the main chart in the form of arrows. When a blue arrow appears, then this is a signal to buy, when the red one appears then this is a signal to sell. You can set the alerts on/off. The Stochastic Oscillator and Average True Range (ATR) technica
FREE

A price increase indicator calculates range and price changes in percent. It is very useful when you look at the chart. It helps you make decisions to open deals when the price is at the lowest level do not open sell deals and open buy deals and when it is at the highest level do not open buy deals open sell deals, it is not an entry signal for deals but to know the lowest and highest price that will reach in an hour or four hours a day or a week or a month as a whole for the period
FREE

This tool is useful for indicating resistance and support levels It bases on zone in setting to identify top/bottom of candles and and draw rectangle according to those resistance/support level Beside user can edit the zone via dialog on specific timeframe and that value will be saved and loaded automatically. User can determine what strong resistance and support and make the order reasonably.
FREE

GREAR TRADING BOT – это инновационный торговый бот для MetaTrader 5, разработанный для автоматизации стратегий торговли с использованием моделей "Sweep + BOS" и "HTF Sweep + LTF QM". Этот экспертный советник интегрирует расширенные методы анализа рыночных данных, позволяя пользователям выбирать между двумя мощными стратегиями входа. Благодаря гибкости настроек, бот может адаптироваться к различным торговым условиям, проверяя наличие свипов и уровней BOS на различных таймфреймах.
Для стратегии
FREE

Announcement: All EAs (Expert Advisors) from QuanticX are currently available for free, but only for a limited time! To enjoy a Lifetime QuanticX support and continue receiving free EAs, we kindly request you to leave a review and track the performance of our EAs on Myfxbook. Additionally, don't hesitate to reach out to us for exclusive bonuses on EAs and personalized support.
Pillartrade by QuanticX Welcome to Pillartrade - Your Long-Only Trading Ally for US500 Join the forefront of financial
FREE
MetaTrader Маркет - лучшее место для продажи торговых роботов и технических индикаторов.
Вам необходимо только написать востребованную программу для платформы MetaTrader, красиво оформить и добавить хорошее описание. Мы поможем вам опубликовать продукт в сервисе Маркет, где его могут купить миллионы пользователей MetaTrader. Так что занимайтесь только непосредственно своим делом - пишите программы для автотрейдинга.
Вы упускаете торговые возможности:
- Бесплатные приложения для трейдинга
- 8 000+ сигналов для копирования
- Экономические новости для анализа финансовых рынков
Регистрация
Вход
Если у вас нет учетной записи, зарегистрируйтесь
Для авторизации и пользования сайтом MQL5.com необходимо разрешить использование файлов Сookie.
Пожалуйста, включите в вашем браузере данную настройку, иначе вы не сможете авторизоваться.