Смотри обучающее видео по маркету на YouTube
Как купить торгового робота или индикатор
Запусти робота на
виртуальном хостинге
виртуальном хостинге
Протестируй индикатор/робота перед покупкой
Хочешь зарабатывать в Маркете?
Как подать продукт, чтобы его покупали
Торговые роботы и индикаторы для MetaTrader 4 - 75

Ultimate Correlation Scanner (Multi Pair And Multi Time Frame) : ---LIMITED TIME OFFER: NEXT 25 CLIENTS ONLY ---46% OFF REGULAR PRICE AND 2 FREE BONUSES ---SEE BELOW FOR FULL DETAILS Correlations exist because of ongoing patterns in global capital flows.
Correlations are a fundamental market principle that underpin the markets.
And correlations will never go away. Global capital tends to flow (in unison) in and out of risk sensitive currencies.
While at the same time flowing in and out o
Signal V is an indicator that generates trend signal. It generates trend signal with its own algorithm. These arrows give buying and selling signals. The indicator certainly does not repaint. Can be used in all pairs. Sends a signal to the user with the alert feature.
Trade rules Enter the signal when the buy and sell signal arrives. Processing should only be initiated when signal warnings are received. It is absolutely necessary to close the operation when an opposite signal is received. Or t

This is the FXTrader Ariel Real Candle Color . It shows the current candle color in of all timeframe. It helps you to spot trends and supports your Price Action Trading. The indicator can be used on every time frame. Pro Traders can also you use it for scalping in smaller timeframes (M1, M5 and M15). This indicator is not a complete trading system, it is just support. For Details please contact me here or on instagram. Explanation of Parameters Corner: Choose the corner where to display the ind

KT Momentum Arrows Indicator is based on a momentary breakout which is calculated using the bands deviation and emerging volatility in a certain direction. A buy signal is generated when the price close above the upper band and a sell signal is generated when the price close below the lower band. A magnitude coefficient is used as the input which affects the band deviation and volatility at the same time. The coefficient value should be carefully selected and analyzed based on the instrument and

Советник работает на основе принципа определения пиковых ценовых нагрузок в моменты повышения волатильности при наличии соответствующих ценовых паттернов, типичных для текущей рыночной ситуации. Рекомендуется использовать 5-значный поток котировок. Рекомендуемые торговые инструменты: GBPUSD 15m, EURUSD 15m. Настройки Comment to order - Комментарий к ордерам; Risk for Lot - Процент риска для расчета лота; If Risk = 0, lot will be - Если Risk = 0, лот будет таким Max lot - Можно ограничить макси

Gyarados is based on the more flexible Magikarp EA. This version is optimised using previous tick data. Removing all of the compicated parameters, only leaving the settings that matter the most and the trading patterns users prefer. This is an intelligent fully automated EA that utilizes hedging, trending and martingale. This strategy uses Moving Average Convergence Divergence (MACD), Relative Strength Index (RSI) and Moving Averages (MA) for trends. The strategy is based on utilizing trend

BBMA INDI https://www.mql5.com/en/users/earobotkk/seller#products This Indicator marks entry set-up for buy and sell. It will also send alerts when arrow forms, including via push notification to your mobile phone. It is very convenient when you want to be notified of the entry set-up while you are away from your chart. It also calculates maximum pips gained for each 1st set-up. Setting · You could choose two types of alert, pop-up desktop and push notification to your mobile phone. ·
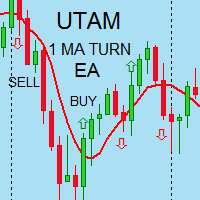
I speak in Hungarian. Magyarul beszélek benne. (Első felvétel. https://youtu.be/MapbQrJ0uPU Első felvétel. https://youtu.be/i2id5O1KPrI Második felvétel. https://youtu.be/Zp2i7QN-IMc Első felvétel. https://youtu.be/h7UbTWiM-Lw Második felvétel. https://youtu.be/y54q4Rasf2A Harmadik felvétel. https://youtu.be/13zYjsoe6ZQ Negyedik felvétel. https://youtu.be/NGiB1AnxxfU ) Nice Day Signalos! Positive building Muving Average Turn. Positive construction for Moving Average Round. If the Muving Average

Full Dashboard EA "is a tool designed to put in your hands the technical analysis tools for most indicators and strategies for 28 pairs of currencies in one chart It is also designed to enable you to trade manually and automatically The chart shows the following :-
All the immediate changes of 28 pairs of currencies for all time periods (M1, M5, M15, M30, H1, H4, D1, W1 ) , Number of points and colors , The green color for up and red color for down The values of the main indicators and the c
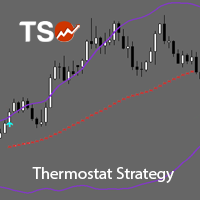
TSO Thermostat Strategy is an indicator that can adapt to the current market conditions by switching from a trend-following mode to a short-term swing mode, thus providing the best possible entry/exit signals in any situation. It is based on the Thermostat Trading Strategy as presented in the book Building Winning Trading Systems with TradeStation by G. Pruitt and J. R. Hill. Strategy The Thermostat Strategy uses different entry and exit conditions based on the current situation of the mark

The principle of this indicator is very simple: detecting the trend with Moving Average, then monitoring the return point of graph by using the crossing of Stochastic Oscillator and finally predicting BUY and SELL signal with arrows, alerts and notifications. The parameters are fixed and automatically calculated on each time frame. Example: If you install indicator on EURUSD, timeframe M5: the indicator will detect the main trend with the Moving Average on this timeframe (for example the Moving
PERFENCTRY will show you exactly when to enter a trade. If the trend changes, it will show the reverse accordingly. It works on all time frames and currencies, stocks, commodities & crypto It does not require a change of settings. The default settings are fine. Just load it on to your chart and wait for the entry signal. This works very well when using Trend Qualifier as a filter. You will wonder how you managed without PERFENCTRY DOES NOT REPAINT once candle is closed
Join my Telegram Ana

About Holy Trend was developed to identify trend and strength.
VIDEO (information and tips) [HERE]
Features
Identifies trend Identifies strength of trend Identifies lines of support and resistance
Easy to analyze Fast signals All timeframes Not repaint (when candle close) No settings required Can be used in Renko charts Can be used with indicator Holy Renko PRO Alerts, email and push notifications
Advantages Sensitive identifier of trend able to identify the long, short movements

Crossovers are one of the main moving average strategies. The first type is a price crossover, which is when the price crosses above or below a moving average to signal a potential change in trend. Another strategy is to apply two moving averages to a chart: one longer and one shorter. When the shorter-term MA crosses above the longer-term MA, it's a buy signal , as it indicates that the trend is shifting up. This is known as a " golden cross ." Meanwhile, when the shorter-term MA crosses below

EA Protrader Gold is a automated Expert Advisor based on Japan candlestick charts.
Automate - EA auto open buy and sell orders based on levels of Japan candlestick chart with the first volume is 0.01 lot and plus more volume follow the fibonaci number if the previous order is lost. If the price go wrong trend EA will open opposit order until get profit. Requirement - Flatform: MT4 - Symbol: XAUUSD - Time frame: M15 - Minimum deposit: 500$ -

Trend Professional is an indicator that generates trend signal. It generates trend signal with its own algorithm. These arrows give buying and selling signals. The indicator certainly does not repaint. Can be used in all pairs. Sends a signal to the user with the alert feature.
Trade rules Enter the signal when the buy and sell signal arrives. Processing should only be initiated when signal warnings are received. It is absolutely necessary to close the operation when an opposite signal is rece
The principle of this indicator is very simple: detecting the trend with Moving Average, then monitoring the return point of graph by using the crossing of Stochastic Oscillator and finally predicting BUY and SELL signal with arrows, alerts and notifications. The parameters are fixed and automatically calculated on each time frame. Example: If you install indicator on EURUSD, timeframe M5: the indicator will detect the main trend with the Moving Average on this timeframe (for example the Moving
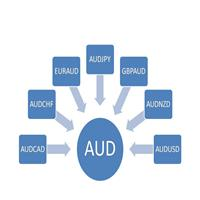
The AUDIndex is the Australian dollar index, which is integrated for the seven currencies of AUDCAD, AUDCHF, EURAUD, GBPAUD, AUDJPY, AUDNZD and AUDUSD.
Through this index, the direction of AUD overall trend can be intuitively understood.
The AUDIndex works better with other indexes in combination. For example, the combination of AUDIndex and JPYIndex can directly reflect the trend of currency AUDJPY.
It is easy to understand that the currency AUDJPY is split into two indices, one is the AU

MQL5 account Somehow The account is temporarily disabled, such as any questions in the use of ITM can add QQ: 178717550 S ignal : https://www.mql5.com/zh/signals/604847 Get your IC Markets Rebeat Discount Account: Click here . Through this link,you will get 3$/Lot.If you apply for it yourself,it is 3.5$/Lot. Are you ready? Do you ever see an EA who cannot stop gaining? Are you boring to find a good EA? Now I offer an full automatic EA,just install it in seconds,money will keep coming.
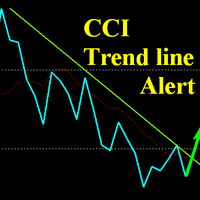
This indicator is an upgrade of traditional CCI on MT4. It can alert and push notificaton (if configured) when : -CCI line cross its MA line -CCI Enter and Exit Overbought and Oversold Zone. These zones can be set by input. -CCI cross line for both Trend line and Horizontal line. It has two working mode: on ClosedCandle and on RunningCandle. With ClosedCandle mode, it only alert when a candle is closed. Trader only draw a line (trend line or horizontal line) on CCI indicator window and the indi
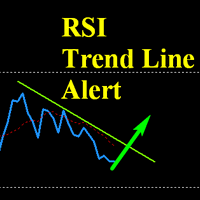
This indicator is an upgrade of traditional RSI on MT4. It can alert and push notificaton (if configured) when : -RSI line cross its MA line -RSI Enter and Exit Overbought and Oversold Zone. These zones can be set by input. -RSI cross line for both Trend line and Horizontal line. It has two working mode: on ClosedCandle and on RunningCandle. With ClosedCandle mode, it only alert when a candle is closed. Trader only draw a line (trend line or horizontal line) on RSI indicator window and the indi

The EA is based on trend trading strategy . Mechanism " trend trading strategy " is a tendency of a financial market price to move in a particular direction over time. If there is a turn contrary to the trend, This mechanism will exit and wait until the turn establishes itself as a trend in the opposite direction, and re-enter when the trend re-establishes. This EA has been back tested for 4 years of real tick data (2019-2022), consistent with the latest trading accounts. Immortal MT4: https:

Trend rollback ea - полностью автоматический эксперт, для валютной пары GBPUSD Тайм фрейм M15 . Советник использует два авторских индикатора, 1 индикатор определяет направления тренда, 2 рисует канал. Советник открывает сделки, когда цена выходит за уровни канала (торговля по тренду) , после убытка робот будет удваивать лот , чтобы быстрее выйти в плюс. Советник не удваивает лот после каждого убытка, для того чтобы не было большой просадки баланса. Также советник использует фильтры , для бо

Easily access to a deep knowledge of the market movement with "M.M. Deepness Arrows"!! This indicator will give you advices on buys and sells after having analized the deepness of the market. The entrance "trigger" will be given after studying each candles' max and min avoiding, this way, the misleading data released by the opening and closure prices (given by the brokers). Thanks to the use of these arrows you'll be able to easily understand if i'ts the right time to buy or sell. If you want th
Signal Trend Arrows is an indicator designed to generate trading signals. This indicator uses a number of different indicators and generates a signal using a number of historical data. It generally tries to calculate the trend return points. These trend returns may be sometimes very large, sometimes small. The investor should act with the belief that the signal may be small. These signals vary according to market conditions. The signals do not repaint. Currency pairs: Any. Work with at least 20
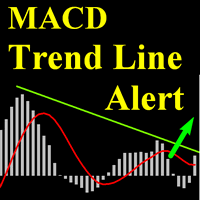
This indicator is an upgrade of traditional MACD on MT4. It can alert and push notificaton (if configured) when : - MACD line cross Signal Line -MACD line cross Zero -MACD cross Trend Line -MACD cross Horizontal Line It has two working mode: on ClosedCandle and on RunningCandle. With ClosedCandle mode, it only alert when a candle is closed. Trader only draw a line (trend line or horizontal line) on MACD indicator window and the indicator will automatically find that line and check if it is cros

Colored Trend Bars indicator is a trend indicator working with a set of algorithms and a set of indicators. Trend finds trends by using many factors while you are there. This indicator has 4 mode features. Mode 1 represents short-term trends. Mode 2 represents medium to short term trends. Mode 3 represents medium to long term trends. Mode 4 represents long term trends. Easy to use and simple indicator. The user can easily understand the trends. This indicator has 3 trend features. Up trend, down

This Expert Advisor is based on Trend Following Systems . The mechanism (stop-and-reverse) technical indicator. Based on a price and time trading system, the indicator is used for analyzing market trends. The indicator trails price as the trend extends over time. It is similar to the Moving Average, as the only difference is that the indicator moves with higher acceleration and may change its position in terms of the price. In general, the indicator moves below the prices as they go up (bull mar

Trade Trend indicator is an oscillator designed to calculate trend reversal points. A set of bar calculations and a set of algorithms to calculate trend reversals. Level probing system with high probability trends. All of these features combine to make it easier for investors to find trends.
Suggestions and Features There are two levels on the Trade Trend indicator. They are at levels of upper level and lower level. The oscillator bar should be below lower level to find the upward trend. And a

Trend Waves indicator is a trend indicator that uses Average True Range and Standard Deviation indications. It is aimed to find more healthy trends with this indicator. This indicator can be used alone as a trend indicator.
Detailed review 4 different trend colors appear on this indicator. The aqua color represents the rising trend. Dark aqua color means the train is getting weaker. pink color represents the downtrend trend. The dark pink color means the trend is weaker. Parameters Stdeviati
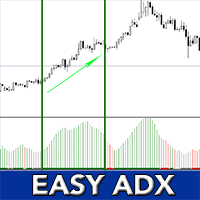
EASY AND SIMPLE STRATEGY - NON REPAINTING - HIGH TIMEFRAME FILTER - EASY TO BACKTEST
*For Desktop MT4 Only *Great For Scalping *Great For Swing Trading *Mobile Alerts, Desktop Alerts *Works On Any Timeframe *Works On Forex, Indices, Crypto *Perfect For New Traders And Expert Traders
We very often use Average Directional Movement Index (ADX) to identify a trend in forex. We use a simple rule: - If the indicator is above level 25, the market is in strong trend and we then study the values
Алгоритм советника определяет текущее состояние рынка - бычий тренд, медвежий, или боковое движения и открывает позиции в сторону предполагаемого ценового движения. Кроме того, в момент принятия торгового решения советник анализирует 4 и 5 свечные формации за определенный промежуток времени. В случае совпадения более 2 формаций с положительным результатом, советник совершает вход в рынок. В качестве фильтра используется индикатор SAR. Наилучшие результаты достигаются на торговых инструментах: GB

Реализация индикации трендового движения с моментами для потенциальных стопов в индикаторе TrendCloud . Может легко употребляться как самостоятельная торговая система. Интерпретировать можно так: расположение курса выше или ниже теней показывают наличие тренда. Переход в тень предупреждает о возможном развороте. Вхождение цены внутрь тени говорит в флэтовом движении. Индикатор отслеживает рыночный тренд с непревзойденной надежностью, игнорируя резкие колебания рынка и шумы вокруг средней цены. П

For watch tread
https://www.mql5.com/en/signals/548990
Anubes is an Expert Adviser making you trading is very easy with low risk and little of time you can get your profit Anubes following the trend with Discipline It will be updated every 3 months to make sure that the strategy is still suitable for the current market condition Features Good at EURUSD, GBPUSD, EURAUD, GBPAUD. Over ten years of back-testing. (10,000+ deals) Do not require fast execution or low spread. EA Settings:you ca

Always Strong indicator, an indicator that uses MacD and Bollinger bands. It is a coded indicator to find trends. It finds these trends by its own algorithm. This indicator requires visual monitoring. It does not give any warning because it needs visual follow-up. The main trendline should turn down to find the down trend. The main trend line should go under the white line and then go under the yellow line. The main trendline should turn upward to find the upward trend. The main trend line shoul

The EA is based on trend following strategy. By mainly using GMMA,this EA catches the trend. Trades is closed if the trend is changed according to GMMA.
Simply put,you can win big by using this EA and keep losses minimum.
What is GMMA?
GMMA means "Guppy Multiple Moving Average". This strategy utilizes 12 moving averages.
Because of that,GMMA is more robust and profitable than simple moving average strategy.
PAIR AND TIMEFRAME The EA is especially made for EURUSD and Daily chart. It is i

THE REVOLUTION Simple Trade is suitable for all type of traders whether you are a Swing Trader, Day Trader or Scalper.
THE REVOLUTION Package consist of 3 EAs which combine into a Single EA which can create many stategies depend on the trading skills used/known by each traders. We provide AUTO_SETTING expecially for beginner or no experience investors which this AUTO_SETTING will trade to achieve 1000 Points or 10%/month, and for traders/investors who have experiences in trading can develop the

Strong Pivot trend indicator is a trend indicator that uses standard pivot calculation and some indicators. The purpose of the indicator is to calculate the possible trends using the pivot point. And to give the user an idea about trend direction.
You can use this indicator as a trend indicator. Or with other indicators suitable for your strategy.
Features The blue bar represents the upward trend. The yellow bar represents the downward trend. The blue pivot point represents the upward trend.

Super Trend Lines is an indicator that calculates trends using a set of channels and using a set of algorithms. This indicator helps to find trend return points. It generally represents an oscillator. This trend tracking system helps the investor to understand small or large trends and determines the direction according to it.
Time frames: M15, M30, H1
Parameters Period : general trend period. Bar : bar calculation setting Channel_Cal : channel calculation period. The smaller the value here,

Dynamic Support and Resistance is the collective work of three traders with several decades worth of experience trading all financial markets. The math behind these levels is unlike anything ever produced in the public trading world. Dynamic S&R is a tool to measure ranging markets, trending markets, and aids in catching the turns of the trends when combined with Dynamic PriceWraps. Dynamic S&R can be used for spot FX, futures, stocks, and is incredibly useful in options trading for all produ
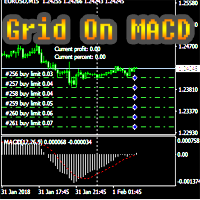
Советник работает по прицнипу сеточной расстановки лимитных ордеров как по тренду, так и против тренда. Направление тренда определяется согласно показаниям стандартного индикатора MACD. MACD можно настроить на любой доступный в МТ4 таймфрейм. Имеется возможность выбирать направление выславления ордеров - по тренду или против тренда. Советник имеет гибкие настройки, которые позволяют адаптировать торговлю под любой торговый инструмент и любые торговые условия. МОНИТОРИНГ СОВЕТНИКА В РЕАЛЬНОМ ВРЕ

This Expert Advisor is using three Moving Averages to find the direction of the trend. There is three different Moving Averages that has to be in the right order and the EA is looking for this in different timeframes to make sure it's in the order to trade. Then the EA will look for both the Stochastic and RSI in different timeframes before everything is looking good. Now it will take a BUY or SELL trade, depending on the indicators. It will set the Stop Loss and Take Profit depending on the hig
小蜜蜂EA是根据MACD指标,KDj指标等多个指标产生共振,结合波浪理论,编译的一个趋势加马丁类型的EA,成功率是非常高的。
使用周期是M30以上的周期,下单的频率不高,大部分时间这款EA是出于观望状态,已有机会,稳准狠的对交易品种进行下单,
关于参数
参数设置有点复杂,但是使用者没必要害怕,我已经把参数调成了最理想的参数,下载就可直接使用,
最少资金不少于3000美金, EA is based on MACD index, KDj index and other indicators resonance, combined with wave theory, compiled a trend plus Martin type EA, the success rate is very high.
Usage cycle is more than M30 cycle, order frequency is not high, most of the time this EA is out of wait-and-see state, has the opportuni
Советник расставляет сетку лимитных ордеров выше и ниже текущей цены согласно настройкам. После срабатывания ордеров советник контролирует текущее состояние прибыли. В случае достижения указанной в настройках прибыли (в валюте депозита), советник закрывает рыночные и отложенные ордера и открывает сетку снова.
Настройки: Initial trading lot - Торговый лот для первого ордера; LotKoef - Коэффициент умножения для каждого последующего ордера; The distance to the first order in the grid - Дистанци
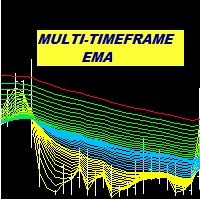
Multi Period EMA A trend indicator based on the exponential moving average. Keeping track of multiple EMA is a more effective way of detecting possible trend development. This indicator allows for the setting of as many as 6 different EMA periods. Unused period parameters can be set to zero to exclude the particular EMA from being displayed on the chart.
Features Up to 6 EMA displayed on chart. Option to select high EMA and Low EMA in order to detect crossovers Alert in event that change in s

Relative Trend Bias
The Relative Trend Bias indicator is a simple indicator that helps you identify the current directional movement bias of a financial instrument based on the number of bars specified. Helps you identify the current trend based on a bar period of your choice Shows you level "safety zones" for reversals Shows you when the trade bias changes while the indicator is active on the chart
Indicator is forward facing. It does not backdraw/backpaint but it can be tested on the indi

Данный индикатор отмечает участки разворота тренда, в точках разворота давая сигнал на вход в рынок в виде стрелок соответствующего цвета и направления движения в виде линий, а также звукового оповещения. Основан на закономерностях рынка FOREX, точных определениях текущего экстремума и нахождения свечных моделей на вершинах/низах рынка. Универсальный алгоритм помогает определить точки разворота указывая стрелками где осуществить вход в рынок. Дополнительно Индикатор не перерисовывается. Выводит

About
Holy Renko is a trend identifier capable of identify small and long market movements. This indicator should be use in Renko Charts.
VIDEO (information and tips) [HERE]
How to install Renko Charts [HERE]
Features
Developed for Renko Charts Easy to analyze Fast signals Not repaint (when candle close) Statistics panel Filters false signals
Alerts, emails and push notifications
Advantages of Renko Chart Easy to install Easy to analyze Filter out the noise of wicks Easy ident

Description
The base of this indicator is an ZigZag algorithm based on ATR and Fibo retracement. The ZigZag can be drawn like a classic ZigZag or like Arrows or needn't be drawn at all. This indicator is not redrawing in sense that the ZigZag's last shoulder is formed right after the appropriate conditions occur on the market. The shoulder doesn't change its direction afterwards (can only continue). There are some other possibilities to show advanced information in this indicator: Auto Fibo on

Индикатор показывает текущий тренд. Он отлично "чувствует" смену тренда. Стрелка-сигнал после закрытия бара не исчезает и не перерисовывается. Открывать ордер в сторону стрелки можно уже на следующем баре после появления сигнала. Пользование индикатором интуитивно понятно. При появлении первой стрелки бирюзового цвета - предпочтительны покупки. Красного цвета – продажи. Использовать индикатор рекомендую на таймфрейме H1. При появлении первой стрелки противоположного цвета и закрытии часового бар

Ichimoku Cloud at a Glance Multi is the intuitive, powerful tool for analyzing the trend, support, resistance, pivots and the currency strength utilizing Ichimoku info from the multiple timeframe of the multiple cross currencies. It let you watch 7 cross currencies' stats in one screen. It also shows the base currency relative strength intuitively. Those 7 currencies' Ichimoku stats are shown in colors and several lines. It also alerts possible entry point and offers one click order entries.

Extended VERSION
Ultimate solution on price action trade system Built Inside One Tool! Our smart algorithm tool will detect the price action pattern and alert upon potential with entry signals and exit levels including stoploss and takeprofit levels based on dynamic and unique calculation. This tool will also filters out market currency strength to ensure our entry are in a good currency conditions based on it's trend.
Benefit You Get
Easy, visual and effective price action detection. Gi

MaxProfitDZ Expert adviser MaxProfitDz v1.4 Recommendations Symbol: ALL PAIRS ..i Recommended EURUSD. Time Frame:1M. Brokers: ALL brokers . low spread/commission, 1:500 leverage Minimum Deposit Recommended : $500 USD
Lot Size for 500$ : 0.01 Use a broker with good execution and with a spread of 0.1-2 points. A very fast VPS is required
Parameters EA TrendON=true (Read the note ) MMType = 2 LotMultiplikator = 1 LotConst_or_not = TRUE Take profit :5-10 pips for accounts with fi
TaiChi4 Tai Chi4EA Tai Chi2EA is according to MACD indicator deviation written a trend oriented EA。 Broker: ECN broker, low communication / Commission, 1:400 leverage, non FIFO or FIFO. If you want to run in different currency pairs, please modify the parameters BM and SM。 Please use default parameters. As the world's most knowledgeable person, I've set the parameters to the optimal parameters, users can directly use, without modification.

Let´s try to make some real money!
Call me profit addicted. I thought why not try to make THE dream come reality. With discipline, a clear strategy and this indicator I focus on entering the perfect trades. This indicator is very easy to use as you will get perfect entry points for Put or Call trades.
The arrows are calculated with: - Momentum parameters - Candle stick patterns - Fundamental Price action
We recommend to combine it with Parabolic, ZigZag or Elliot waves indic

This indicator displays Super Power Beeta trend movement.Indicator is version 2 . Features Multiplier - displays multiplier movement. Multiplier2 - displays multiplier2 movement. Trend - displays indicator trend 1 and trend 2 (true/false).
Background:color - displays background color (true/false).
separate_window - displays trend separate window.(0-1....) separate_window2 - displays trend (background color )separate window.(1-2....) X - move the trend left and right.
Y - move the trend up
The ' MTF MA Cross ADV ' indicator comes from MTF Moving Average Cross with an advanced algorithm . Fast & slow m oving average crosses are used for generating up to four arrows either at bar 0 or bar 1.
Key Features Advanced algorithm to detect changes in standard moving average cross w/arrows. There are many settings which can all be non-repaint for signals at a new bar and at bar 0. NewBarConfirm as 'true' means notifications come from bar 0 & bar 1(false). Audible Alerts, e-mail no

Ultimate solution on price action trade system Built Inside One Tool! Our smart algorithm tool will detect the price action pattern and alert upon potential with entry signals and exit levels including stoploss and takeprofit levels based on the time setting on each market session. This tool will also filters out market currency strength to ensure our entry are in a good currency conditions based on it's trend.
Benefit You Get
Easy, visual and effective price action detection. Gives you th
Советник использует торговлю по экономическим новостям используя низкую, среднюю и высокою новость. Советник настроен для каждой новости отдельно. Торговля ведется по 26 валютным парам и 3 таймфрейма от М5 - M30. Советник использует торговлю по таким индикаторам как: CCI, Standard Deviation, Moving Average, Relative Strength Index, Momentum и MACD . Советник ищет небольшие отклонения цен по индикаторам и для подтверждения открытия позиции использует 3 вида экономических новостей. Для
TaiChi3 Tai Chi3EA Tai Chi2EA is according to MACD indicator deviation written a trend oriented EA。 Broker: ECN broker, low communication / Commission, 1:400 leverage, non FIFO or FIFO. If you want to run in different currency pairs, please modify the parameters BM and SM。 Please use default parameters. As the world's most knowledgeable person, I've set the parameters to the optimal parameters, users can directly use, without modification. The historical data of the test may not be accurate, b

The Stochastic Standard/Hidden Divergence indicator will plot the stochastic (%K and %D), and will also identify and plot standard (regular) divergences between the indicator and the price action, OR it can be set to identify and plot hidden (reverse) divergences between the indicator and the price action. The divergences themselves are implemented as lines (default green for bullish divergence and red for bearish divergence) drawn in the indicator pane. If activated via the Inputs dialog, alert

The Momentum Standard/Hidden Divergence indicator will plot the momentum, and will also identify and plot standard (regular) divergences between the indicator and the price action, OR it can be set to identify and plot hidden (reverse) divergences between the indicator and the price action. The divergences themselves are implemented as lines (default green for bullish divergence and red for bearish divergence) drawn in the indicator pane. If activated via the Inputs dialog, alerts will be genera

The RSI Standard/Hidden Divergence indicator will plot the Relative Strength Index (RSI), and will also identify and plot standard (regular) divergences between the indicator and the price action, OR it can be set to identify and plot hidden (reverse) divergences between the indicator and the price action. The divergences themselves are implemented as lines (default green for bullish divergence and red for bearish divergence) drawn in the indicator pane. If activated via the Inputs dialog, alert

The MACD Standard/Hidden Divergence indicator will plot the MACD, and will also identify and plot standard (regular) divergences between the indicator and the price action, OR it can be set to identify and plot hidden (reverse) divergences between the indicator and the price action. The divergences themselves are implemented as lines (default green for bullish divergence and red for bearish divergence) drawn in the indicator pane. If activated via the Inputs dialog, alerts will be generated when

The CCI Standard/Hidden Divergence indicator will plot the Commodity Channel Index (CCI), and will also identify and plot standard (regular) divergences between the indicator and the price action, OR it can be set to identify and plot hidden (reverse) divergences between the indicator and the price action. The divergences themselves are implemented as lines (default green for bullish divergence and red for bearish divergence) drawn in the indicator pane. If activated via the Inputs dialog, alert

This indicator displays super power trend movement. Features Multiplier - displays multiplier movement.
Multiplier2 - displays multiplier2 movement. Trend - displays indicator trend 1 and trend 2 (true/false). separate_windor - displays trend separate window.(0-1....)
X - move the trend left and right.
Y - move the trend up and down. How to understand the status: If the Trend color is green, trend is up. If the Trend color is red, trend is down.

The arrows are calculated with: - 2 Parabolic parameters - 2 ADX parameters - 4 Stochastic parameters
We recommend to combine it with Parabolic, ZigZag or Elliot waves indicator. Always trade the trend!
If you make sure to draw your trend lines and support/resistance zones you will just have to wait for the signal to appear. Take the trade. For Binary Options it is advisable to set the expiry time to 5-15 min in M1 chart. THIS INDICATOR IS ZERO REPAINT
Best assets to trade: -

The Trend Confirm indicator is a set of indicators and a set of channel movements. The purpose of the indicator is to find a healthy trend and designed to confirm these trends. There are two channels in the trend. The blue channel line is used to confirm the ascending trend. The green trend line is used to confirm the downtrend.
How to use? If the trend line in the indicator goes above the blue channel line, the trend is starting to rise. If the trend line within the indicator falls below the

Oscillator Trend indicator macd, divergence and a set of algorithms is a trend indicator. The aim of the indicator is to generate signals with high reliability using the above-mentioned calculations.
The indicator is very easy to use. Red arrows give sale signal. The Aqua arrows give a buy signal. Thanks to the alert feature, you can easily reach the signals. It works without any setting. It can be used in all time frames. The recommended time frames are m15, m30 and h1.
Parameters Trendline

The Sensitive Volume indicator is an indicator designed to generate trading signals. The purpose of this indicator is to generate signals from the highest probability of trading. Using a number of price movements and a set of indicator properties to generate these signals.
Easy to use, simple and understandable to the user. With alert features, user signals can be reached quickly. Visually the user can easily recognize the signals. This indicator will not repaint. Parameters Trend_Period - p
MetaTrader Маркет предлагает каждому разработчику торговых программ простую и удобную площадку для их продажи.
Мы поможем вам с оформлением и подскажем, как подготовить описание продукта для Маркета. Все продаваемые через Маркет программы защищаются дополнительным шифрованием и могут запускаться только на компьютере покупателя. Незаконное копирование исключено.
Вы упускаете торговые возможности:
- Бесплатные приложения для трейдинга
- 8 000+ сигналов для копирования
- Экономические новости для анализа финансовых рынков
Регистрация
Вход
Если у вас нет учетной записи, зарегистрируйтесь
Для авторизации и пользования сайтом MQL5.com необходимо разрешить использование файлов Сookie.
Пожалуйста, включите в вашем браузере данную настройку, иначе вы не сможете авторизоваться.