Техническое задание
I have a couple indicators from ThinkorSwim(script) i'd love someone to code for MT4.
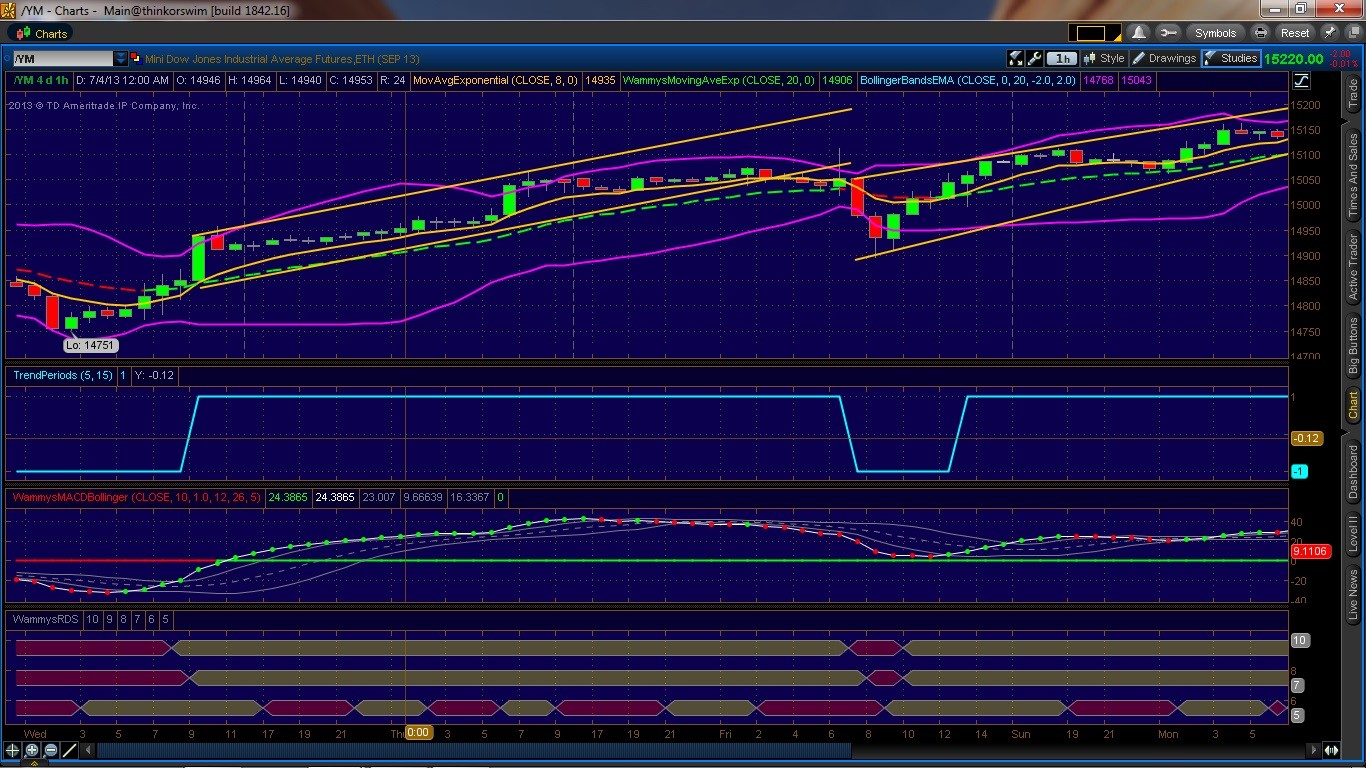
Trendperiod:
TrendPeriod:
This one again is just a typical EMA offered by TOS but just offers a different visual way of seeing things. When short term is above longer ema it draws line at the (1) mark. If vice versa it draws line below at (-1). If you can could you make it so when above its green and when below its red vs how i currently have it its all just one color?
declare
lower;
input fastLength = 7;
input slowLength = 15;
plot
Periods = sign(ExpAverage(close, fastLength) - ExpAverage(close,
slowLength));
Periods.SetDefaultColor(GetColor(1));
MACDBollingerBand:
Here we have a MACD plotted onto its own Bollinger Bands
declare lower;
input price =
close;
input BBlength = 10;
input BBNum_Dev = 1.0;
input
MACDfastLength = 12;
input MACDslowLength = 26;
input MACDLength =
5;
def MACD_Data = MACD(fastLength=MACDfastLength,
slowLength=MACDslowLength, MACDLength = MACDLength);
plot MACD_Dots = MACD_Data;
plot MACD_Line= MACD_Data;
plot
BB_Upper = BollingerBandsSMA(price = MACD_Line, length=BBlength,
Num_Dev_Dn=-BBNum_Dev, Num_Dev_Up=BBNum_Dev).UpperBand;
plot BB_Lower =
BollingerBandsSMA(price = MACD_Line, length=BBlength,
Num_Dev_Dn=-BBNum_Dev, Num_Dev_Up=BBNum_Dev).Lowerband;
plot BB_Midline = BollingerBandsSMA(price = MACD_Line, length=BBlength,
Num_Dev_Dn=-BBNum_Dev,
Num_Dev_Up=BBNum_Dev).MidLine;
BB_Upper.SetDefaultColor(color.gray);
BB_Lower.SetDefaultColor(color.gray);
BB_MidLine.SetDefaultColor(color.gray);
BB_MidLine.setStyle(curve.SHORT_DASH);
MACD_Line.setDefaultColor(color.white);
MACD_Dots.setStyle(curve.POINTS);
MACD_Dots.setLineWeight(2);
MACD_Dots.assignValueColor(if
MACD_Line>MACD_line[1] then color.green else color.red);
plot
zero = 0;
zero.assignValueColor(if MACD_line<0 then color.red else
color.green);
zero.setLineWeight(2);