Работа завершена
Техническое задание
I want the indicator to draw a continuous line on chart derived from the values of (selected in input) MA.
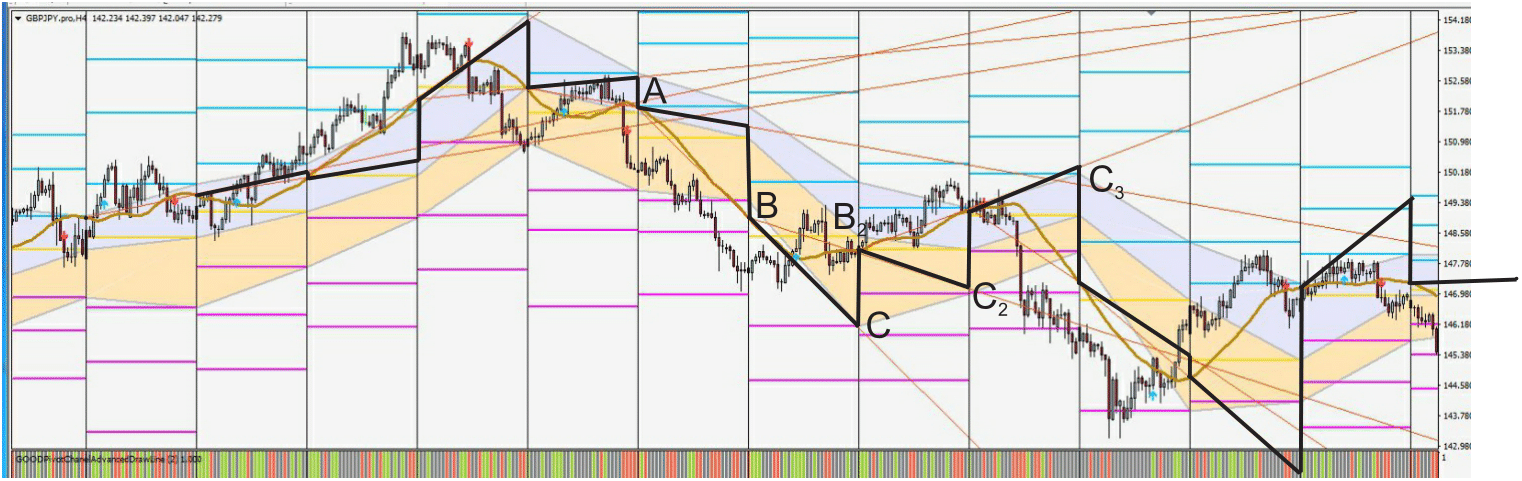
Let us suppose we use a MA with price type = open price. A is the price at which the MA is at the beginning of a period (1) (let us say Daily), and B the price it is at the beginning of next period (2). If we draw the continuation of the line connecting A to B until the vertical separation meaning virtual beginning of next period (3) we have a segment BC which is the representative of the segments of the line I want the indicator to draw. Please look at the image to fully understand.
In the first file C is the projection of AB, and C2 is the projection of BB2.
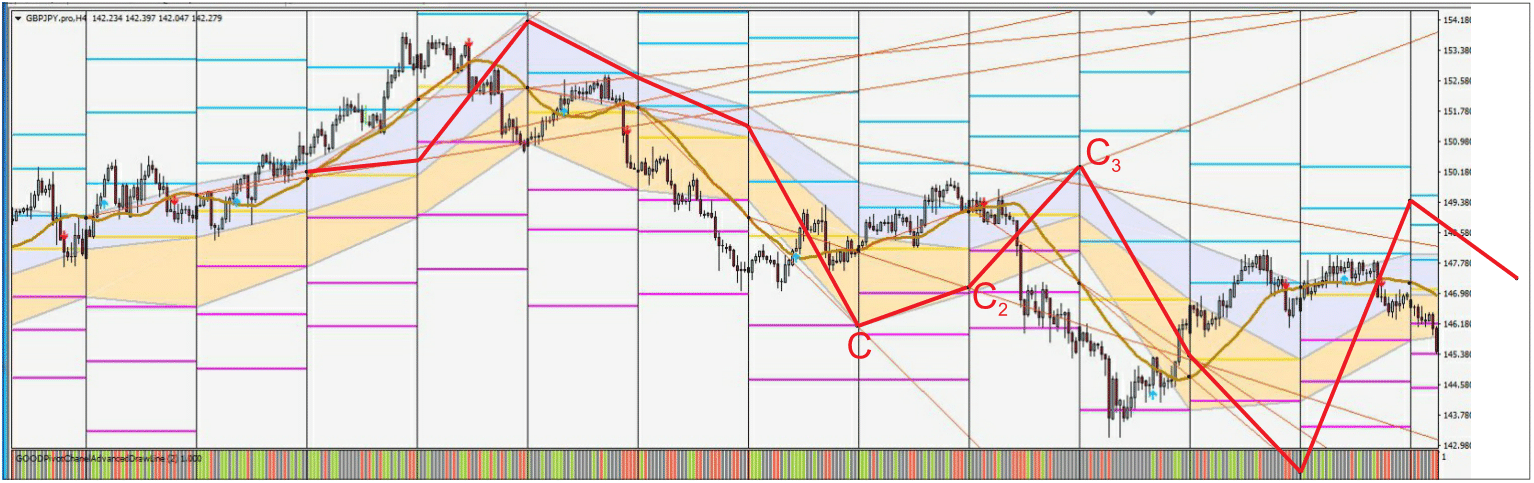
I want 2 modes of display/types of lines : one as just described (and segments must be draw on chart also between C and B2 for example : "vertical connections" to make the line continuous) and the second one connecting "C" values or projected points.
The second file shows the second mode of display.
Possibility to use with an EA (buffers ?), and parameters as period MA, as many MA types as possible, price types (if at close price then the line will be drawn after the first candle is closed), and is wished : arrow plot on main chart when a candle closes the other side of the line.
Only Weekly and Daily seperations are whished (vertical lines for the virtual beginning of next period available on MT4). Is there other periods possible by any way ?
Customisable colors/width/styles for the line and arrows.
Regards