Revised Zigzag Indicator by my idea

Работа завершена

Время выполнения 52 дня

Техническое задание

I would like to revised zigzag indicator asf:

I. Indicator form

1. The parameter fix asf:

   + To use close price on any time frame.

   + Top of wave where there is bullish candlesticks with highest close price.

   + Bottom of wave where there is bearish candlesticks with lowest close price.

   + The lines make drawn frm top of wave to bottom of wave.

   + Bullish Wave make drawn frm bearish candlesticks with lowest close price to bullish candlesticks with highest close price and the same on bearish wave. And it must adapt 02 condition asf:

        / There are min N candlesticks (N is number of candlesticks which will declare on Depth of inputs of indicator). N candlesticks count frm bearish candlesticks with lowest close price to present candlesticks for bullish wave and same for bearish wave.

        / Body of candlesticks frm candlesticks after bearish candlesticks with lowest close price to present candlesticks must be bigger than N times (N is number of times which will declare on Deviation of inputs of indicator) of body of bearish candlesticks with lowest close price for bullish wave and same for bearish wave.

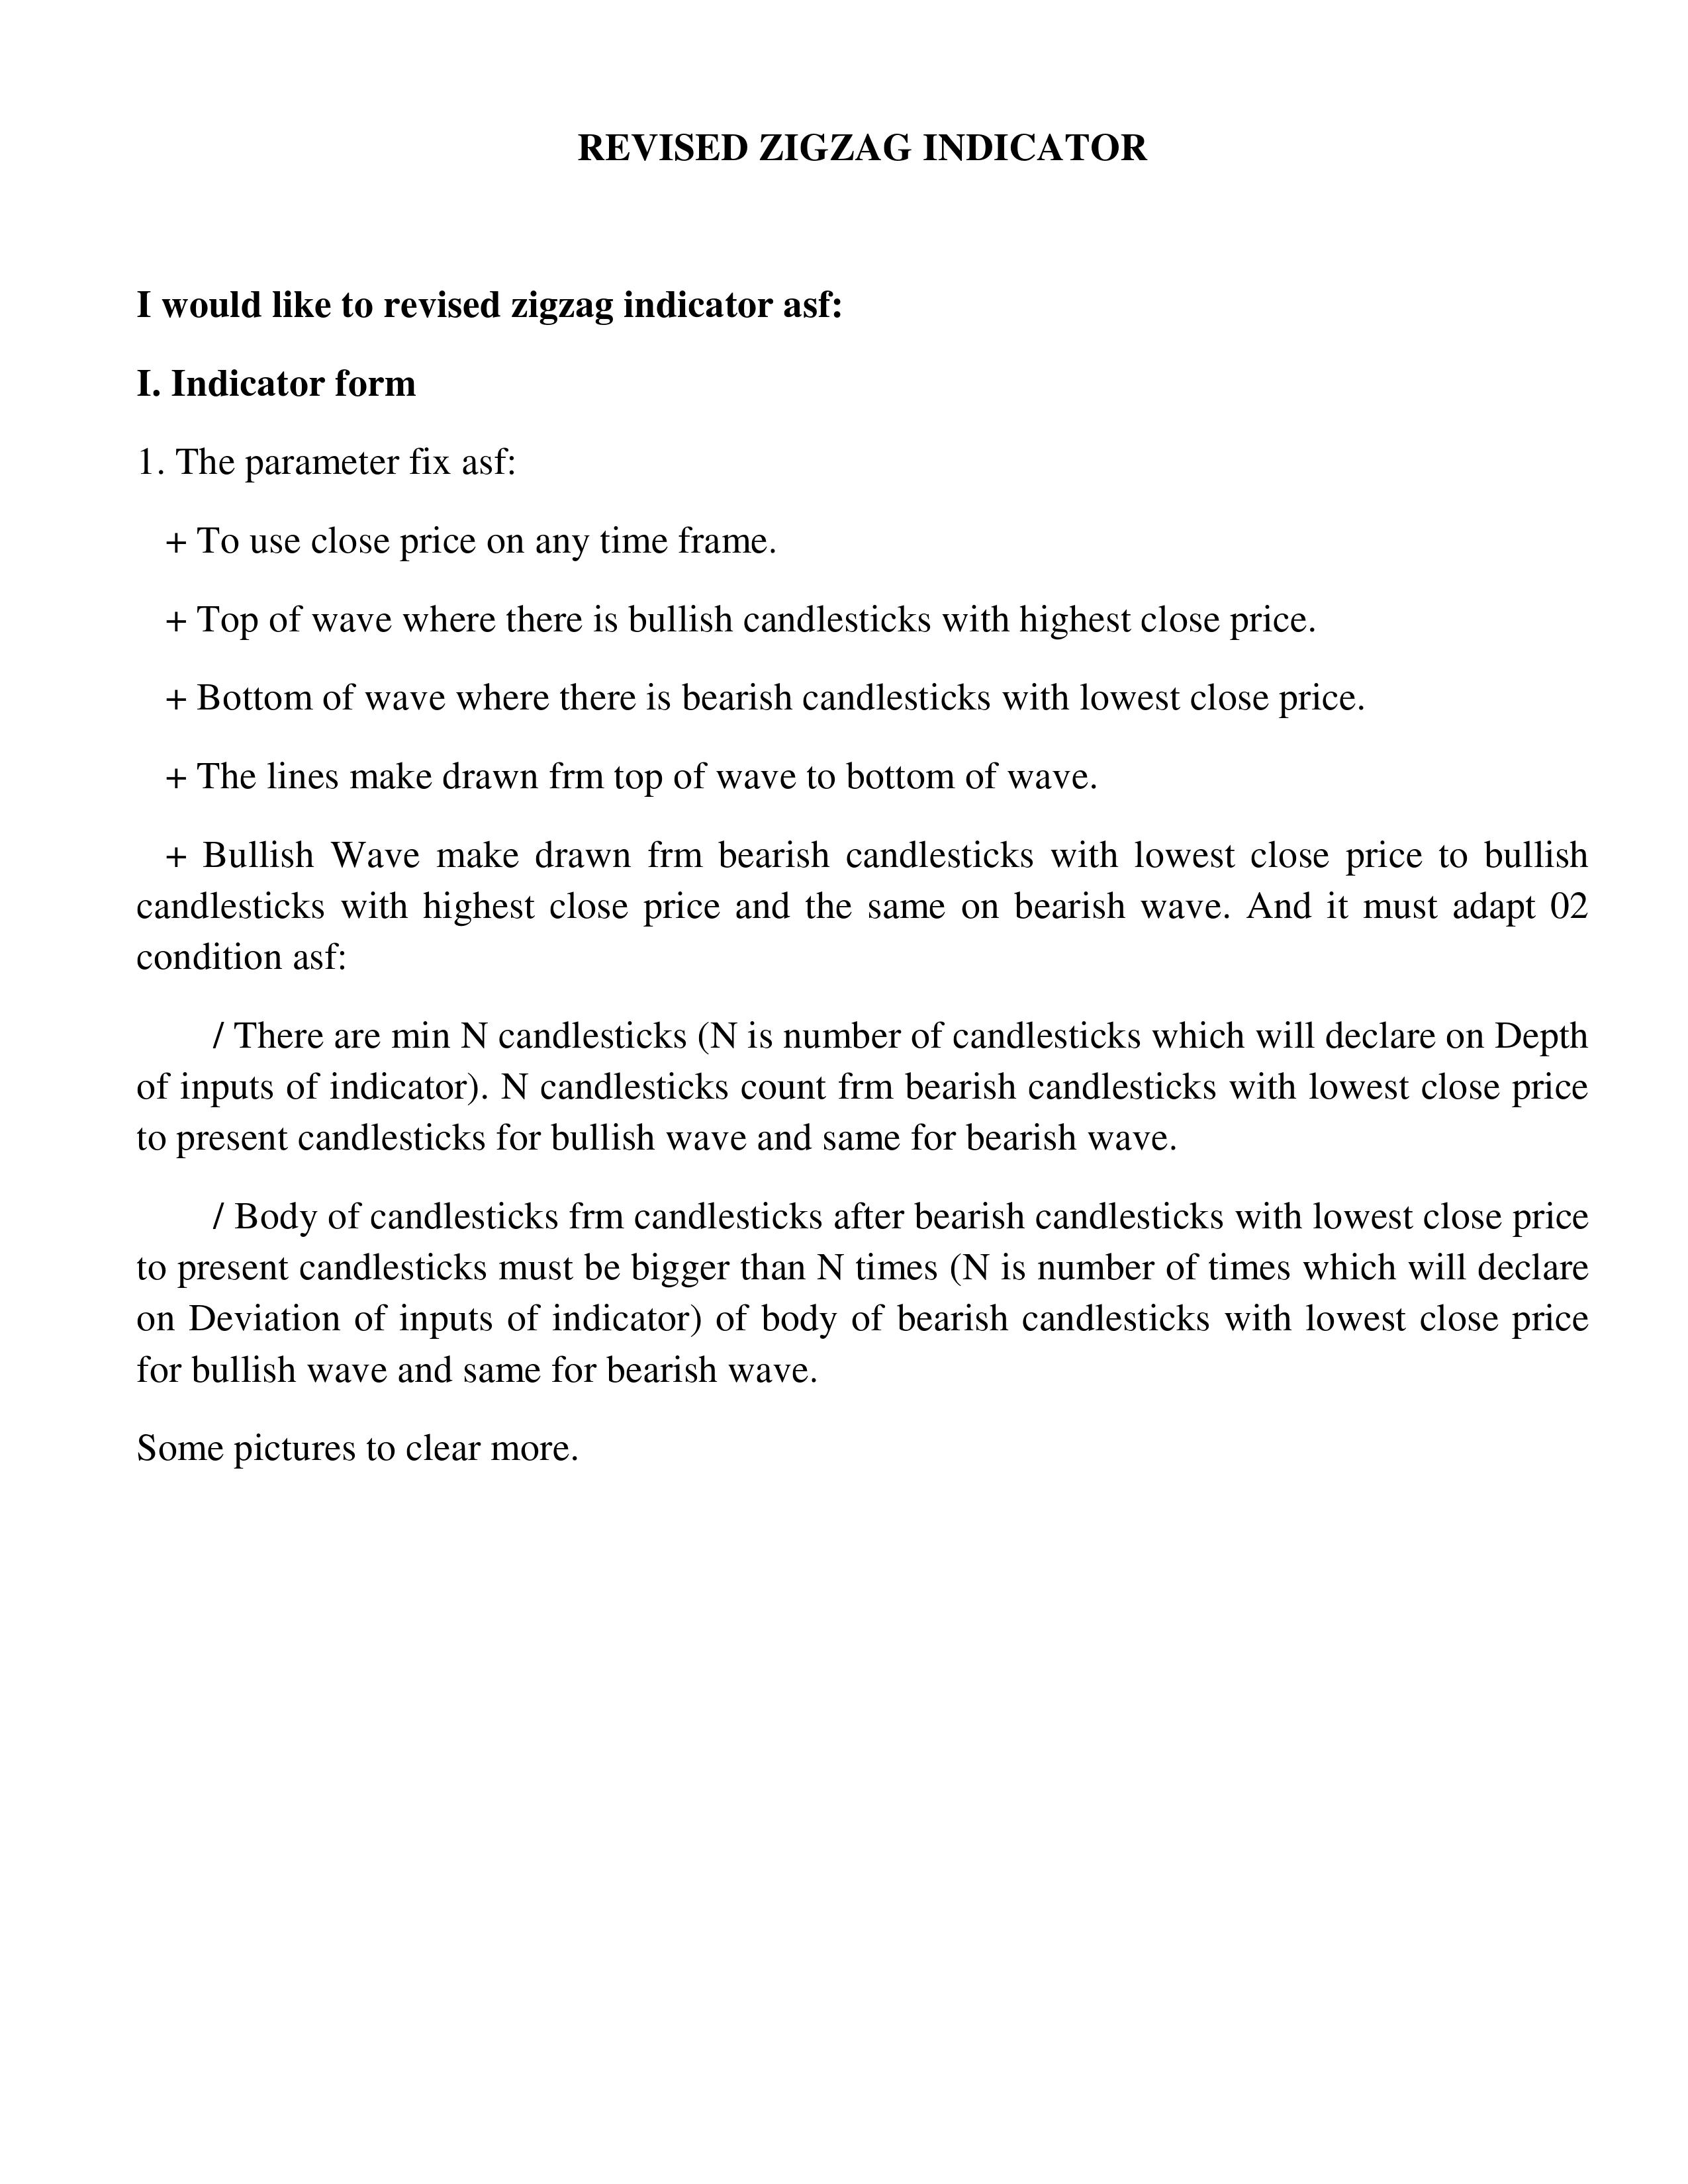
Some pictures to clear more.


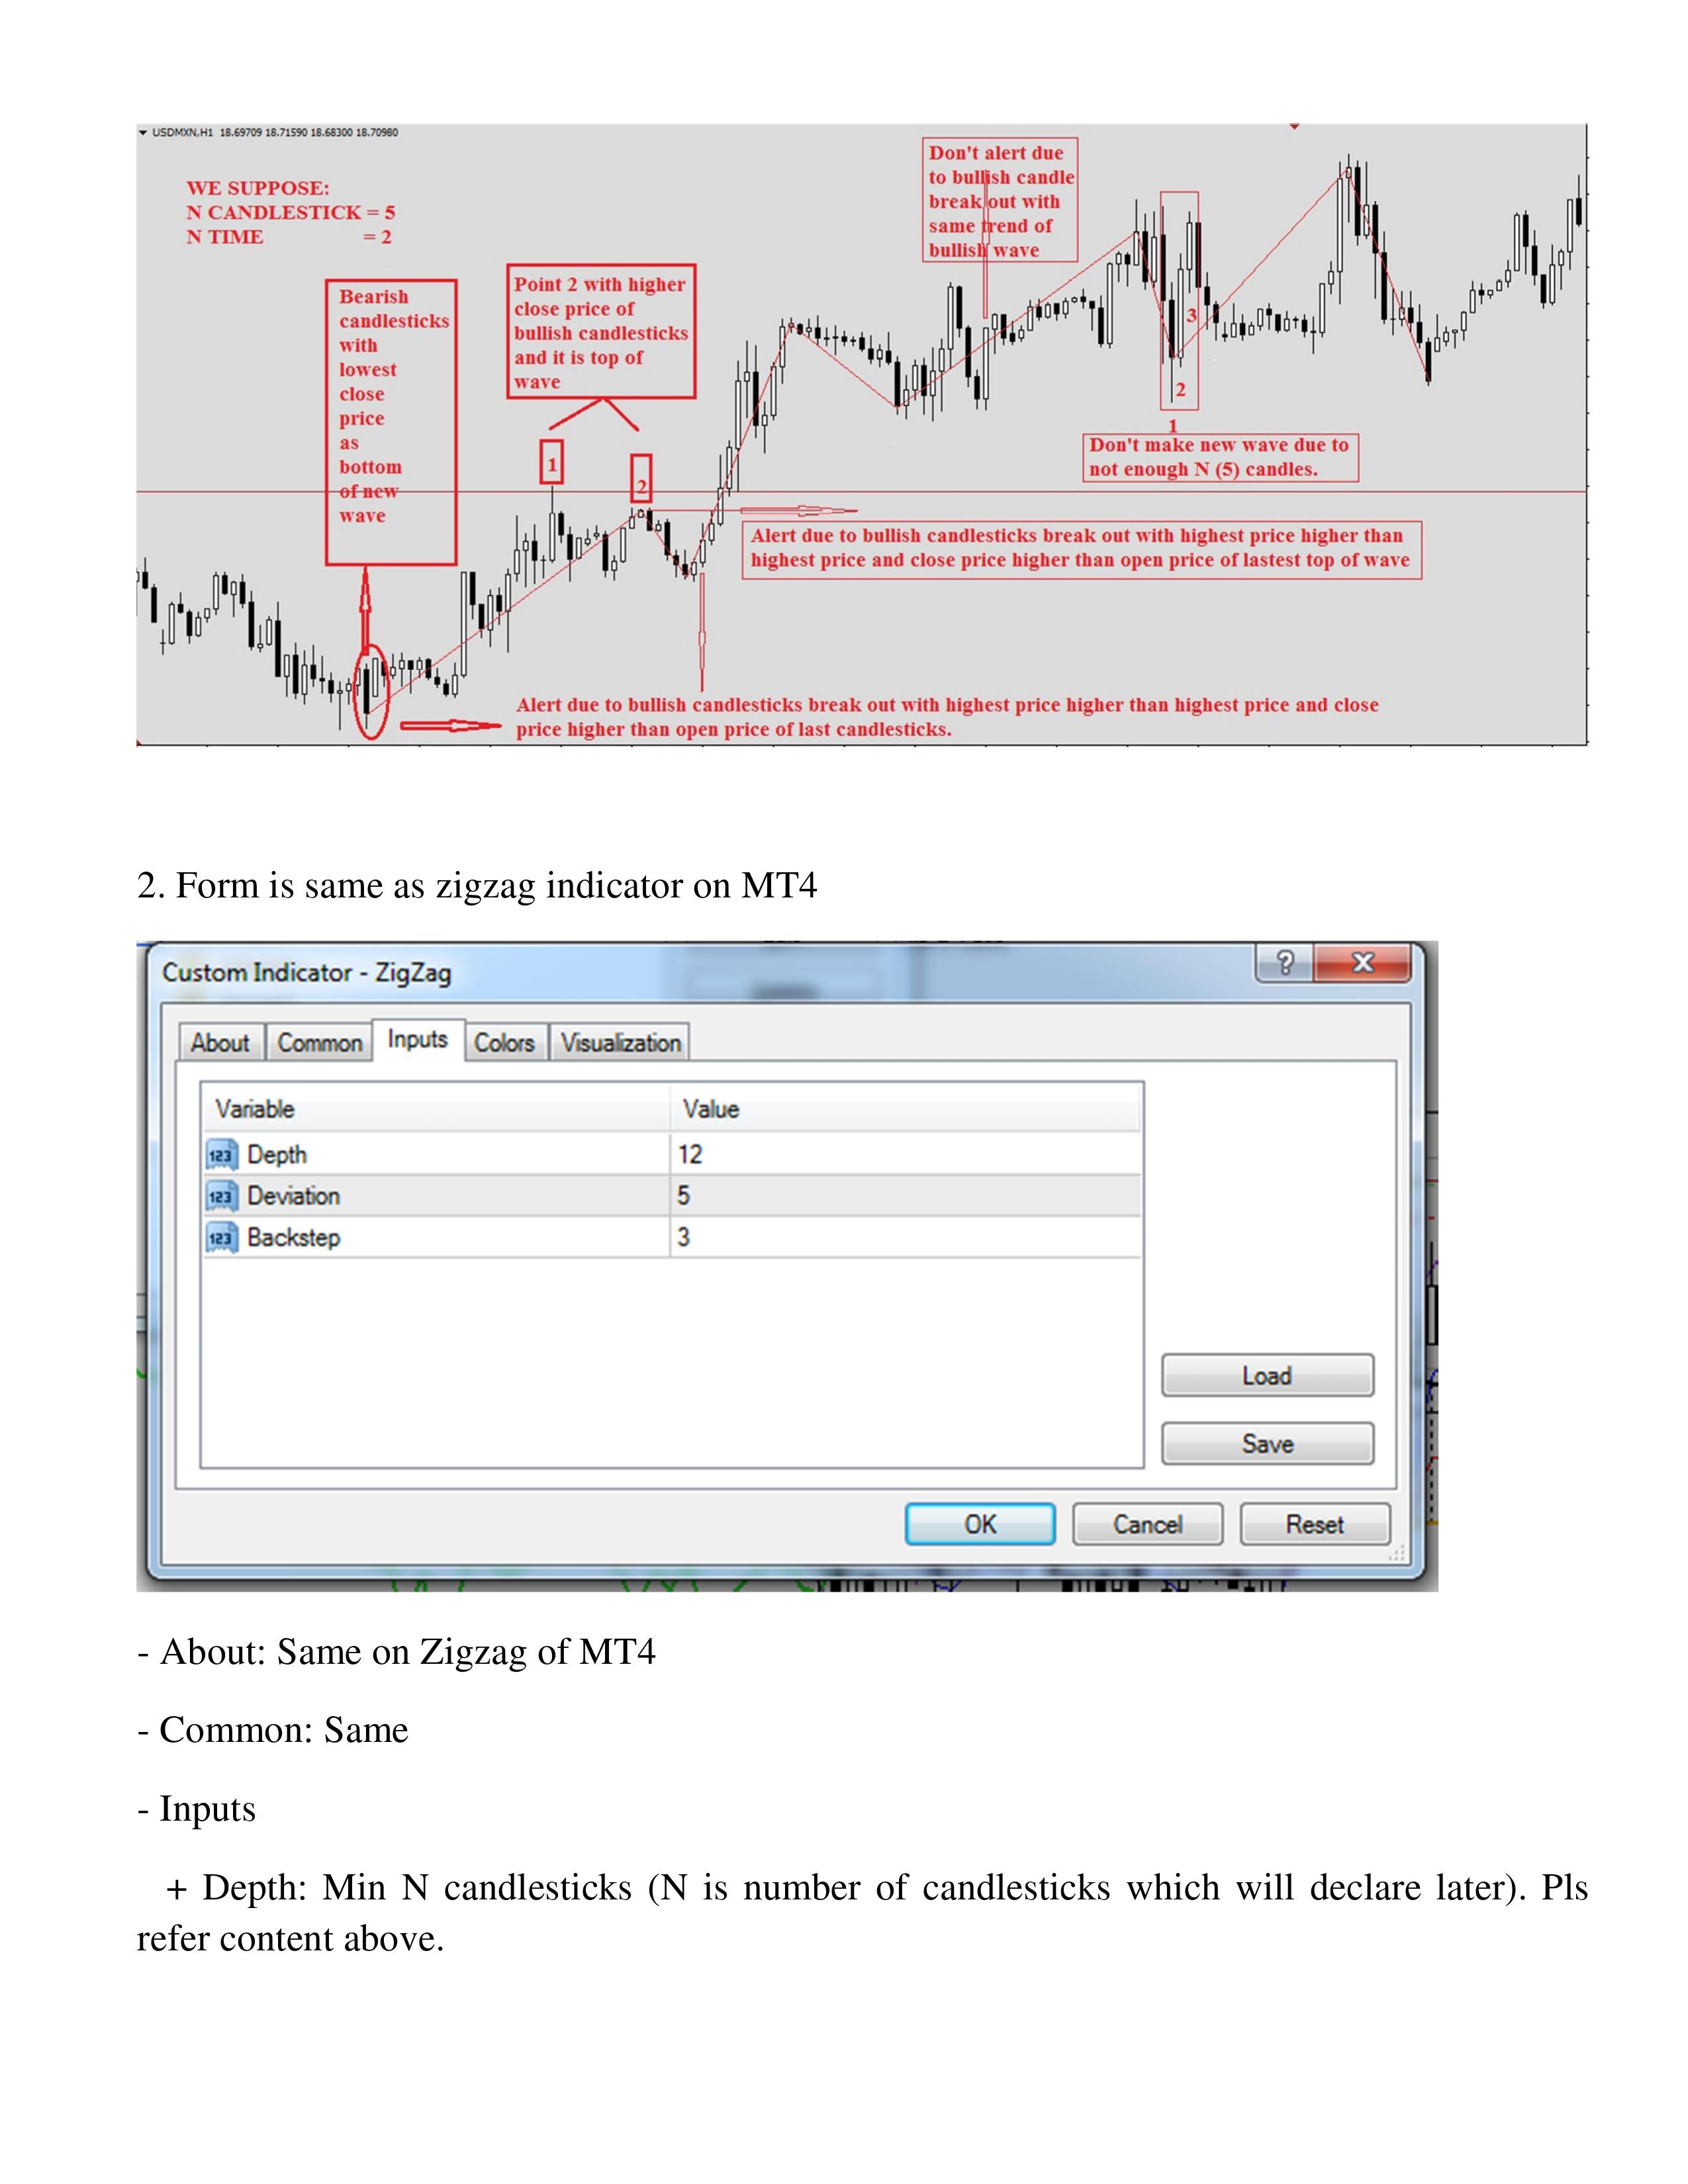
2. Form is same as zigzag indicator on MT4

- About: Same on Zigzag of MT4

- Common: Same

- Inputs

   + Depth: Min N candlesticks (N is number of candlesticks which will declare later). Pls refer content above.

   + Deviation: Min N times (N is number of times which will declare later). Pls refer content above.

   + Backstep: Delete

- Colors: Same

- Visualization: Same


II. Alert

1. Break out of top and bottom of candlesticks

- Only apply for Reversing candlesticks to reverse present trend of wave (Ex: Bearish candlestick break bottom for bullish wave). Candlesticks break out which always doesn’t same trend of wave.


- Bullish wave: If there is min 01 bearish candlesticks with lowest price is lower than lowest price and close price is lower than open price of bullish candlestick before. Indicator will alert if there is any candlesticks after that bullish candlestick to adapt of 02 these condition.

- Bearish wave is same.

2. Break out of bottom and top of wave.

- Indicator will alert if there is any candlesticks with highest price is higher than highest price and close price is higher than close price of candlesticks as top of wave. And same on bottom of wave.


III. Time to complete this indicator: 1-5 days.

= End =


Файлы:

JPG
Example.jpg
190.7 Kb
JPG
0001.jpg
470.8 Kb
JPG
0002.jpg
426.4 Kb
JPG
0003.jpg
422.0 Kb

Откликнулись

1
Разработчик 1
Оценка
Проекты
0
0%
Арбитраж
0
Просрочено
0
Свободен
2
Разработчик 2
Оценка
(258)
Проекты
395
28%
Арбитраж
69
19% / 49%
Просрочено
120
30%
Свободен
Похожие заказы
Hello i need an expert who can help me modify an open source PineScript indicator code to add additional features. ONLY EXPERT WITH PROVE OF WORK SHOULD CONTACT FOR FURTHER DISCUSSION ON THE PROJECT
احتاج شخص عربي يتكلم ويفهم العربية حتى يسهل شرح المطلوب للمؤشر لدي مؤشر واكسبيرت خاص بي بحاجة إلى تعديل الكود المصدري لدي والفكرة تحتاج فعم من المبرمج باختصار اريد مبرمج عربي يفهم ويتكلم العربية حتى يسهل الشرح وفي نفس الوقت صاحب خبرة وتجربة ومتداول على منصة ميتا تريدر حتى يضفي تحسينات على المؤشر ويستطيع عمل الفكرة بكل سهولة وإعطاء النصائح إذا وجد خطأ
Specification for Translating Pine Script Indicators to MQL5 Objective Translate multiple indicators written in Pine Script into MQL5. The translation should be implemented using an object-oriented and class-based approach. Additionally, the indicators should include some specific adjustments as detailed below. Requirements Object-Oriented Design Implement the indicators using an object-oriented paradigm in MQL5
Hello my friend There is a project I will send you the indicator code What is required is to issue three copies of the indicator Version 1 1, Delete the arrows and signals and keep only the red and blue lines and move them (red and blue line buffers) from the Colors section to the Settings section so that they appear as in the picture () Version 2 2, Go back to the first original cursor, move the arrows, signals, red
I have a MetaTrader 4 indicator that I programmed to give arrow signals at entry and exit. What is required, is it possible to program the indicator to be better developed so that it gives a written purchase or sale, not just shares, and also gives the phrase (adjustment zone 1 and amendment 2) when the transaction is reversed, and finally, is it possible for the indicator to change the candles so that when the
In summary 1) The bot will only take Firm Buy and Firm Sell Signals . 2) The bot will use the SL and TP based on the indicator . 3) the risk to reward is 2:1 but when the price reaches 1:1 set SL to Breakeven 4) the bot will take Firm Buy and Firm sell after the candle closes with a firm buy or firm sell 5) make sure to give an option for number of contracts to be traded . 6) Bot will close all the trades EOD
I want my own bot for trading, an effective bot that I do not want to lose, and if it has artificial intelligence, it will be better for trading on a platform
hello programmers, i look for somebode who will enhance changies in my indicator. indicator draws swings bar after bar, but not all swings are drawn correct. full description is in attachements
I need a AI signal generating and executing bot for forex trading. The bot should operate such that when i put it in a chart it will analyze the market, after several minutes it will display whether the trade is buying or selling and then execute a trade. It should display the one minute, five minute,15minute, 30 minute, one hour, 4 hours and daily time frame whether they are buying or selling. If it is buying the
1. Combination of Market Profiles on daily basis a) this should be combined if the bell curve is similar to the previous day. Rotational day (volume - standard deviation). b) If breakout, new range should be drawn Conclusion: Market profile should be combined on daily after the market is closed 2. Use Vwap indicator, with 0.5 - slow trend, 1.0 - normal trend, 1.5 fast trend. The stop loss should be under the trend

Информация о проекте

Бюджет
30 - 80 USD
Исполнителю
27 - 72 USD
Сроки выполнения
от 1 до 5 дн.