Работа завершена
Техническое задание
Trading Strategies
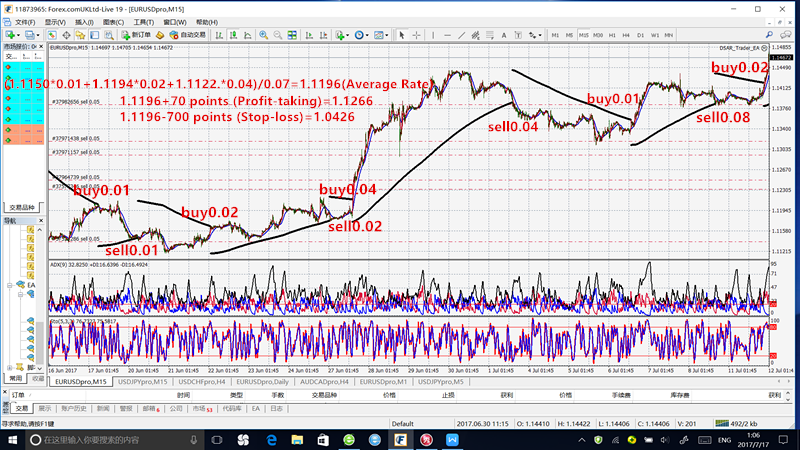
Read the trading varieties from the K-chart. Set buyin positions when the SAR index on the K-chart changes direction. When the price is crossed over the Parabolic index, buy 0.01 share at the first time, buy 0.02 share (double the first time) at the second time (when the price crossed over the Parabolic index at the second time), buy 0.04 share (double the second time) at the third time (when the price crossed over the Parabolic index the third time), the rest can be done in the same manner. The total buyin shares and the average price of all the bought positions should be showed on the right side of the K-chart (in black fonts), and then 70 Profit-taking points and 770 Stop-loss points should be set automatically according to the average price, and red horizontal lines of Profit-taking and Stop-loss should be drawed on the K-chart. Hold the positions until the Profit-taking or Stop-loss are reached or the positions are closed manually. Then enter into the next circulation.
When the price is crossed below the Parabolic index, sell 0.01 share at the first time, sell 0.02 share (double the first time) at the second time (when the price crossed below the Parabolic index at the second time), buy 0.04 share (double the second time) at the third time (when the price crossed below the Parabolic index the third time), the rest can be done in the same manner. The total buyout shares and the average price after setting positions should be also showed on the right side of the K-chart (in black fonts). 70 Profit-taking points and 770 Stop-loss points should be set automatically according to the average price. Hold the positions until the Profit-taking or Stop-loss are reached or the positions are closed manually. Then enter into the next circulation.
If the Profit-taking and Stop-loss are revised manually, EA can’t change back into the Profit-taking and Stop-loss that are set previously.
The Parameter of SAR is (0.001, 0.005).
There is a diagram in the attachment. You can combine the words and the diagram to understand my requirements.