Работа завершена

Время выполнения 126 дней

Техническое задание

I Need  MT5 Fractal Candle Pair Indicator to be Developed and If Successful to be developed in MT5 EA Trading Robot in the Future  

My Project MT5 Indicator Requirements 

1. MT5 Indicator  Name =  Fractal Pair Indicator

2. It Will Identify Buy and Sell Fractal Pair Candles and Put Arrow/Dot Below If there is a Buy Fractal Pair Signal and Put Arrow/Dot Above If there is a Sell Fractal Pair Signal – Arrow/Dot Color Customizable

3. It Will Highlight the Buy and Sell Fractal Pair Candles If There is a Signal – Color is Customizable ( Example: Blue For Buy Signal, Red For Sell Signal)

4. It Will Alert Via Regular Notification and Mobile Alert When There is A Buy and Sell Signal – With Message Such As ( “Fractal Buy EU H1/ RSI Value” ,  Fractal Sell EU M15 / RSI Value” ) 

5. Chart Information on the Chart Customizable Color / Font / Size And Location ( 3 Most Common Font ) 

PAIR/TIMEFRAME = Sample (EURUSD H1) 

Spread = Sample (1 Pip) 

Moving Average Filter = Buy/ Sell ( Buy if Fractal Pair is Above MA/ Sell if Fractal Pair is Below MA) 

RSI Value Current Time Frame = Sample (0 to 90) 

RSI Buy/Sell = RSI Sell ( RSI is 80 to 90 ) 

                      RSI Buy ( RSI is 10 to 20 ) 

6. With Moving Average and Customizable Settings 

This will Filter the Signal and add to Buffer for Buy and Sell Signal 

Fractal Candle Pair ABOVE Moving Average is BUY, Fractal Candle Pair BELOW Moving Average is SELL 

Moving Average Settings 

MA  - On/OFF  - If OFF will Display Both Buy and Sell Signal

MA  Method - Simple Moving Average/ Exponential Moving Average 

MA  Apply to  - Close /  Open  / High / Low / Median Price (HL/2)   

MA  Period – 14 - Default 1 (Changeable)   

MA  Shift - Default Zero (Changeable)   

7.  RSI Settings – for display on Info as RSI Value = Sample RSI 90/ RSI 10

RSI Period = 14 (Default) Changeable 

RSI Apply to Close Only 

8. IMPORTANT.  It Will Put The Signal into Buffer as Buy And Sell For EA Future Use 

Buy Buffer  = Bullish Fractal Pair Plus Above Moving Average

Sell Buffer  = Bearish Fractal Pair Plus Below Moving Average 

9. Time Period = will check for Fractal Pairs during specified hours 

Start Time = 01:00 

End Time  = 23:00

10. Number of Bars to Check for Fractal Pairs = Example: 300 Bars

11. IMPORTANT – Will Provide Source Code For Future Upgrades and Development

12. IMPORTANT CODER MUST BE Communicating Regularly with the Client For Updates/ Issues / Concerns

********

ILLUSTRATIONS/ PICTURES FOR REFERENCE 

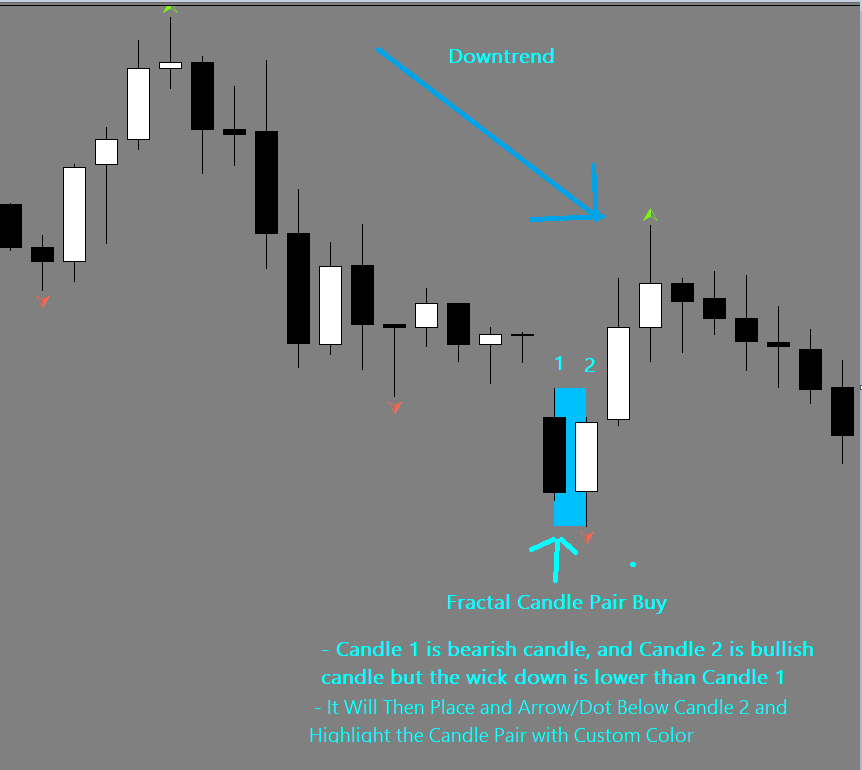
Fractal Candle Pair Buy Picture

Bullish Fractal pair .. previous candle is bearish.. current candle is bullish but the wick of the current candle is lower than the previous bearish candle... It Will Put a BUY Signal Arrow/Dot BELOW the current candle and put that in a buffer for BUY Signal 


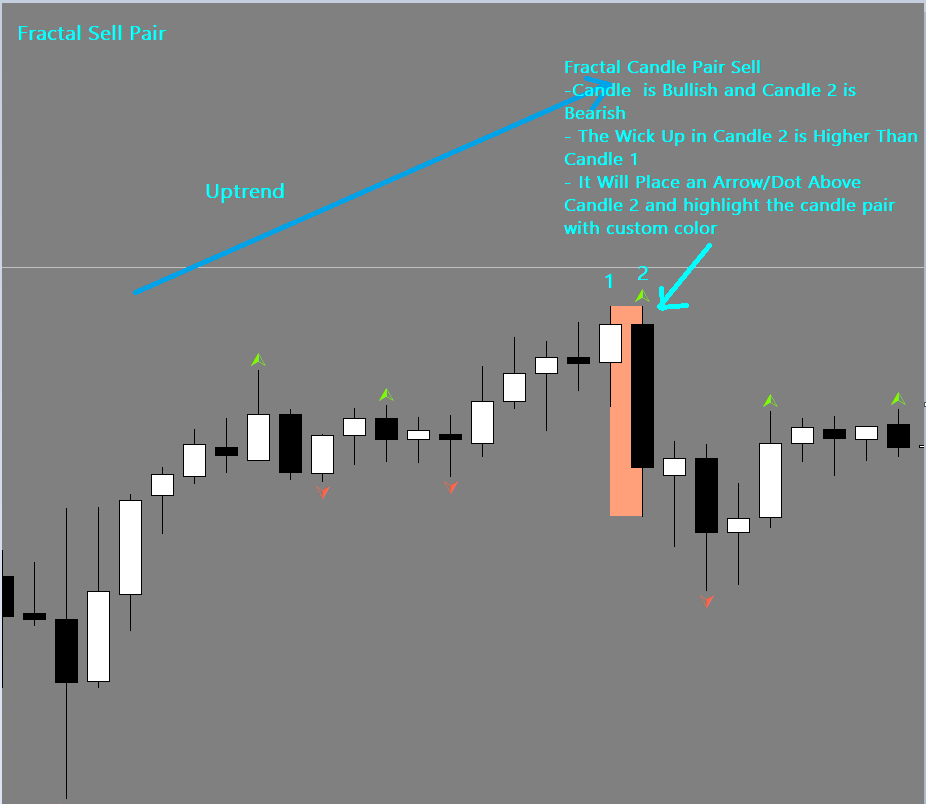
Fractal Candle Pair Sell Picture 

Bearish Fractal Pair.. Previous candle is Bullish.. Current candle is Bearish and the wick of the current candle is above the previous bearish candle... It Will Put a SELL Signal Arrow/Dot ABOVE the current candle and put that in a buffer for SELL Signal


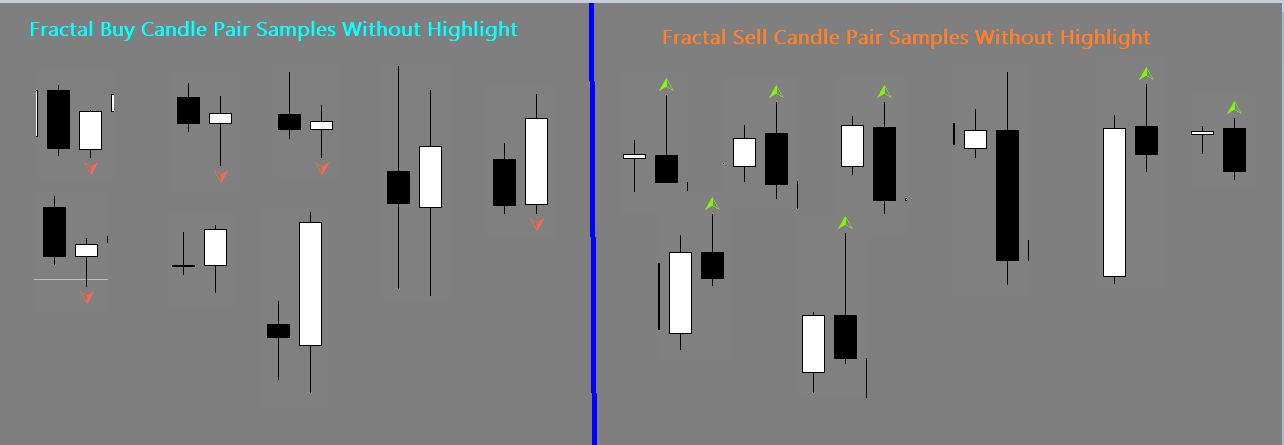
Fractal Candle Pairs Sample Pictures For Reference 

END


Откликнулись

1
Разработчик 1
Оценка
(11)
Проекты
13
38%
Арбитраж
0
Просрочено
2
15%
Свободен
2
Разработчик 2
Оценка
(17)
Проекты
18
28%
Арбитраж
4
50% / 25%
Просрочено
1
6%
Работает
3
Разработчик 3
Оценка
(8)
Проекты
11
0%
Арбитраж
11
18% / 73%
Просрочено
2
18%
Свободен
4
Разработчик 4
Оценка
(3)
Проекты
1
0%
Арбитраж
2
0% / 100%
Просрочено
0
Работает
5
Разработчик 5
Оценка
(139)
Проекты
181
24%
Арбитраж
23
22% / 39%
Просрочено
13
7%
Свободен
6
Разработчик 6
Оценка
Проекты
0
0%
Арбитраж
0
Просрочено
0
Свободен
7
Разработчик 7
Оценка
(563)
Проекты
932
47%
Арбитраж
301
59% / 25%
Просрочено
124
13%
Работает
Похожие заказы
1. Combination of Market Profiles on daily basis a) this should be combined if the bell curve is similar to the previous day. Rotational day (volume - standard deviation). b) If breakout, new range should be drawn Conclusion: Market profile should be combined on daily after the market is closed 2. Use Vwap indicator, with 0.5 - slow trend, 1.0 - normal trend, 1.5 fast trend. The stop loss should be under the trend
Make a 10000 plus script trading Expert advisor with detail and make it flawless with no errors no tiny mistakes and make it in mql 5 language. Make it adjustable for it to be able to trade on its own and not be disturbed and make it study the chart and be able to trade any currency pair. I have zero experience and I would just like to copy and paste the code in MetaTrader. Can you make it be compatible with both
I need a trading bot, My strategy works with the 1hour timeframe .My stop-loss should be put using Atr of the candle multiply by 1.5 then the value will be added or subtracted from my entry depending on if it's a buy or sell and my entry should be a candlestick pattern also in addition to when the 3 Ema corresponds .When the 8Ema is above the 20Ema and they are both above the 100Ema it is a buy and when the 20Ema is
i need someone who can remake this indicator to a winning strategy. i need someone who can make my signal on that indicator to appear fast on the chart... let me know if you can
see trade open on every tick seconde ok forex pair us us30 if is current running at 40170.00 so open 2 trade buy stop and sell stop both in every tick pending order of buy stop will 40171.00 and sell stop pending order will be 40169.00 buy stop will open at 40171.00 and tp will be 40173.00 and SL will be 40169.50 ok if buy stop hit sell stop order automatically will be close now if sell stop order open at 40169.00 so
Need ea according to stochastic divergence (both hidden and regular) plus candlestick flip .. need for experinced developers to complete my order with 99percent accuracy. So bet for it the budged is fixed and other plugins will be added in the v2
I need a chart to replicate/track my equity + Balance Curve into my mt4. Also this chart i need to be able to add Stochastic / Bollingerband / Moving average on the equity/balance curve. Besides the equity curve i would like the indicator to show the Line-chart of my win + 1 and my loss -1 which results in a win-loss curve. ( i will discuss this with the choosen developer in depth. ) More information on what i want
Hi, I need a robot, which wil get instructions to trade in 3 symbols at the same time based on few parameters and calculations. Example: There is 1 symbol called Gold-Near and the rate for it is 1000-1002 If i specify that when the rate reaches 1050, it should sell 1 lot Upon execution it will have to sell 1 lot of cme gold, buy 3 lots of mcx gold and buy currently (lots will be based on calculation). All the
are you aware of the Monday Range Strategy? https://www.youtube.com/watch?v=7B_yBBFx6z8 5pm EST time sunday - monday 5pm est and it has to be on the H1 chart , minimum 1:2 Risk to reward and break even function after 1:1
Need EA programmer to create an MT4 EA that will be able to leverage trades in favour of the market direction ,the EA should be able to operate to any broker. The EA must trade on a clear trend not when the Market is ranging. More will be explained once your application has been accepted for the job

Информация о проекте

Бюджет
30+ USD
Исполнителю
27 USD
Сроки выполнения
до 14 дн.