Custom ADR (Average Daily Range) indicator needed

MQL5 Индикаторы C++ C# Forex

Работа завершена

Время выполнения 4 часа
Отзыв от заказчика
The developer responded well to my request and was quick to fix any errors.
Отзыв от исполнителя
Great customer, prompt communication, clear specs, recommended+

Техническое задание

This is how classic ADR works:

The Average Daily Range shows the average pip range of a Forex pair measured over a certain number of periods.

The calculation of the daily range of a currency pair is a relatively easy process. You simply take the distance between the daily highs and daily lows of a currency pair.

You can configure it to take into consideration as many periods as you want.

Let’s see an example of how the ADR calculation works:

Say that we adjust our ADR indicator to take into consideration five days. The distances (range) between the highest and the lowest point of each of these days are:

n1 = 560 ticks/points

n2 = 270 ticks/points

n3 = 780  ticks/points

n4 = 300  ticks/points

n5 = 420  ticks/points

The ADR calculator formula is as follows: ADR = (n1 + n2 + n3 + n4 + n5) / 5

And now we apply the values to the formula ADR =

(560 + 270 + 780 +300 + 420) / 5

ADR = 2330 / 5

ADR = 466 ticks/points

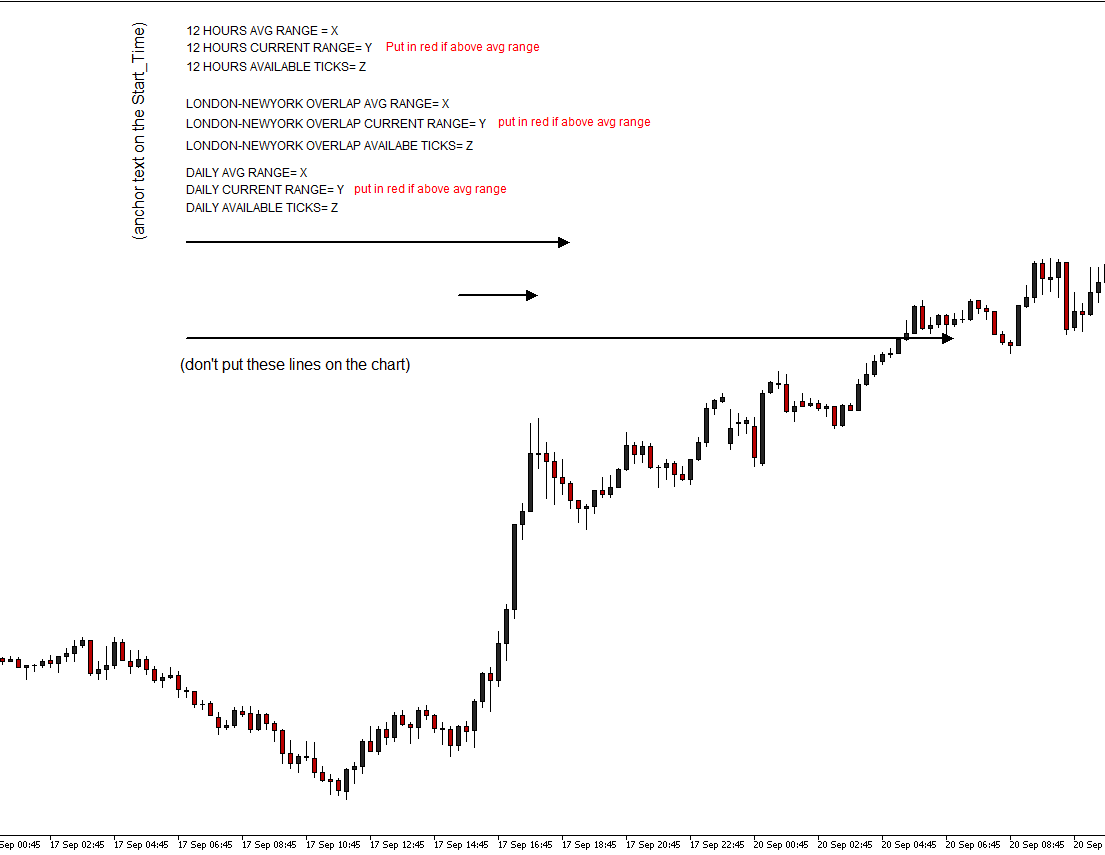
This is what I want:

Name of the indicator: Ranger

I want to be able to see the average range, the current range & the available ticks of three different periods.

-12 hours range 

-London New York overlap 

-24 hours range (Daily)

The start time of the calculations must be set to variable so that I can adjust to my brokers time.

input int Lookback = 5;

input int Start_Time= "07:00"; //07:00 to 19:00 = 12 hours & 07:00 AM to 07:00 AM = 24 hours/Day

input int LondonNewYork_Start="15:30";

input int LondonNewYork_End="18:00";

I want the data from the previous day to remain on the chart.

If the current range is greater than the avg range; put in red.

Anchor the text on the Start_Time variable.

Put the calculations in ticks (points).

Refer to the attached image for a visual.

Thanks!

Файлы:

PNG
Ranger.PNG
31.4 Kb

Откликнулись

1
Разработчик 1
Оценка
(63)
Проекты
68
25%
Арбитраж
12
42% / 42%
Просрочено
4
6%
Свободен
2
Разработчик 2
Оценка
(3)
Проекты
3
0%
Арбитраж
8
0% / 75%
Просрочено
0
Свободен
3
Разработчик 3
Оценка
(180)
Проекты
195
46%
Арбитраж
0
Просрочено
5
3%
Свободен
4
Разработчик 4
Оценка
(96)
Проекты
143
76%
Арбитраж
0
Просрочено
2
1%
Свободен
Похожие заказы
hello there I need a copy trade for mt4 can ANYONE help me with and let discuss on how to go about it kindly send me message to signify and let discuss mind you i need this urgently let connect to discuss and conclude
Hello there, am in need of an expert pinescript programmer who can work on an existing code to add some indicators and features. Please bid if you understand pinescript well and can work on existing code
TIME FRAME: 15 MIN LOT SIZE: 0.01 CANDLE START TIME: 2:00 CANDLE END TIME: 2:14 ENTRY BUFFER: 1 SL BUFFER: 1 TARGET $: 10 MARTINGALE % : 200 (All the above data should be adjustable) Details: 1. We have to mention candle start time and end time (ie: 4.00 to 4.59). If the candle breaks the high of the given time it should go for buy. If it breaks the low of the given time it should go for sell. 2
I need help with creating a website traders chatroom, it must show traders online,offline,inactive. the chatroom top section must show four clocks with different times and time scale like this.. the chatroom must have a history data of up to 10days, then longer history must be deleted automatically. if you have better chatroom please say your recommendations
dreams good and have a great Cash out from your smart phone , tuyoywuiy glamorous flood see full idk idk slow so dolls stupid sis workouts who's spark koalas oral waits also doggo idk
It is using EMA/SMA for triggers of long or short (green long/red short) and the line above or below is the stop loss, profit triggers would need to figure out or allow it until next trigger. Already in thinkscript And add parameters
A “grid” display style like the attached image. User can choose up to 3 EMA’s to monitor on up to 6 Time Frames. If the EMA slope is greater than 0 = Green If the EMA slope is less than 0 = Red If the EMA slope is 0 = Black The grid should be customizable on it’s size, colors, and placement on the chart. Each EMA should update per tick. A label at the top of the grid should read “SLOPES” Indicator 2: A “grid” display
Requirement: 1. Convert Pivot source code .mq4 to Sierra Chart mq4 source code is provided .mq4 as attached .mq4 2. upon conversion to add a button code on Sierra chart .cpp to allow display/hide the pivot line in Sierra Chart ---- *no need alert, make it light without any alert, just a button to display/hide pivot line will do :) to continue, pivot font text also no need I"ve mark with red cross to remove see
I have 2 (indicators) I coded and I use on Tradingview I just need converted to use on Ninjatrader i will be looking for great developer to bid for it and for more details
Hello, I'm seeking a freelancer with access to a ready-made server solution for an educational forex project. Requirements: Ability to control or manipulate live or historical trading data. Platform to execute simulated trades with exaggerated outcomes. Tools for real-time trade simulation (white-label or virtual dealer solutions). If you have a suitable server or can help me find one, please reach out with details

Информация о проекте

Бюджет
30+ USD
Исполнителю
27 USD