I want a MQL5 indicator that can set up a csv data file for analysis in Excel for backtesting of a simple trading method based on counting priceline bars as entry triggers .
The indicator will serve two purposes:
1.Backtesting trading strategy by using Index 1 (counting from left) with no spread and generating a comprehensive csv spreadsheet as well as a summary of output as a text file. I am 70+ and an Excel novice.
2. Forward testing trading strategy by using index 0 adding actual spread statistics and commission for the calculation of wins and loss to the statistics.
Visual environment
Display a trading plot divided in two bands starting from any Price to which I assign 0 and 100 index including data window.
Backtesting will require Start Date and Stop Date inputs.
Forward testing will require Daily HH:MM:SS start and Date.
Trading method
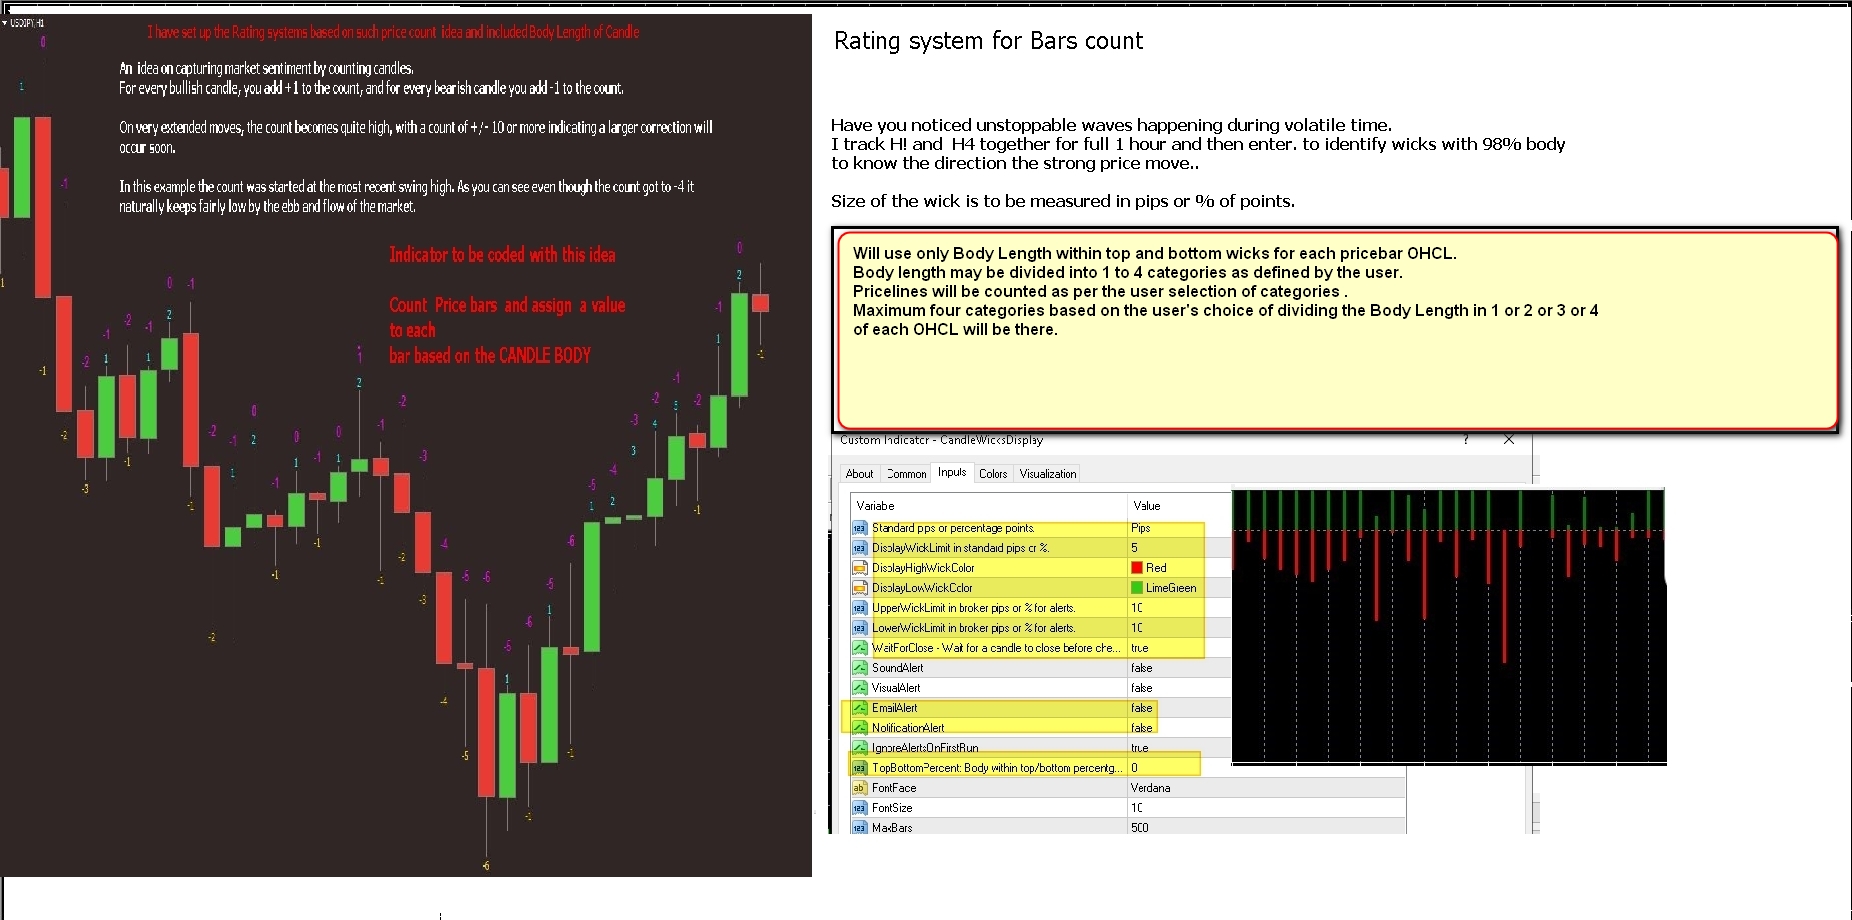
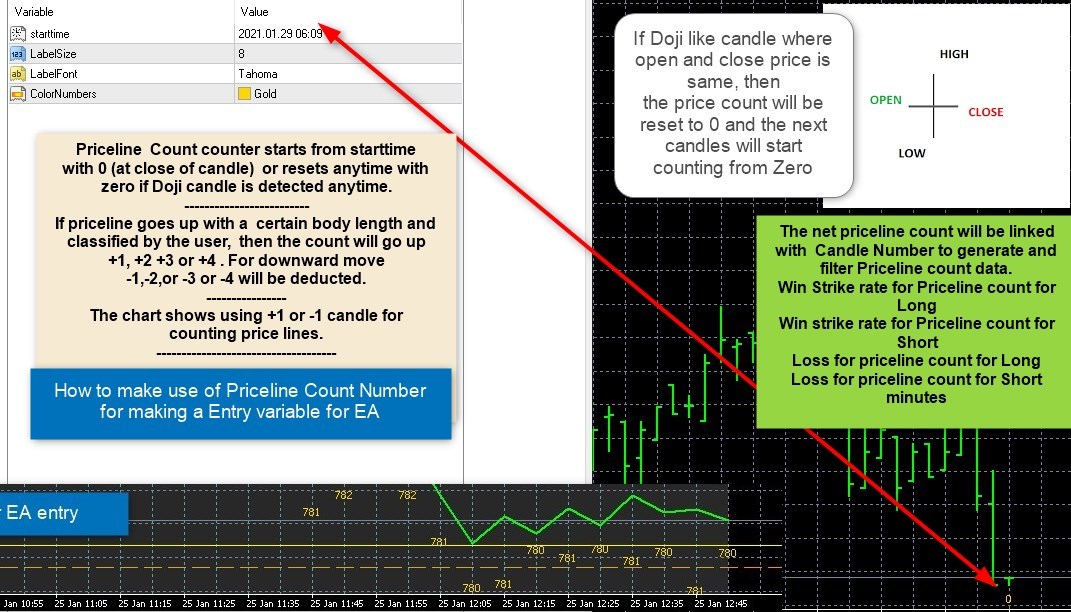
It will involve counting Priceline bars count based on the body strength of candle providing weightage and ranking in terms of maximum 4 levels of Body Strength % . Indicator will give a choice of using from 1 to 4 levels of weightage as defined by the user.
Backtesting of trading methods will create csv data with signal buffers. Buy, Sell, TP exit, Stop Loss exit by Pips, Stop loss exit by Minutes/ chart TF
Backtesting will require Start Date and Stop Date inputs.
Forward testing will require Daily HH:MM:SS start and Date.
Trading method will involve counting of Priceline bars based on the body strength of candle providing weightage and ranking in terms of maximum 4 levels of Body Strength % providing a system of counting. Indicator will give choice to user to use one level or two levels or three levels or four levels based on percentage of each price level bar wicks length. No upper or lower vicks just use Middle Body length.
Похожие заказы
I need a chart to replicate/track my equity + Balance Curve into my mt4. Also this chart i need to be able to add Stochastic / Bollingerband / Moving average on the equity/balance curve. Besides the equity curve i would like the indicator to show the Line-chart of my win + 1 and my loss -1 which results in a win-loss curve. ( i will discuss this with the choosen developer in depth. ) More information on what i want
I want to export the live feed from my market watch to my technical analysis software. They have provided me an api also. Is there a way that their api can be integrated and take rates from my mt5 client terminal
Starting from scratch, I need a solution to develop my own crypto trading and exchange platform. This platform should compare prices across various exchanges like Coinbase, Binance, KuCoin, and Unocoin, as well as different cryptocurrencies. The solution must identify opportunities to buy on one platform and sell on another for a profit, transferring funds to my personal wallet instantly for security. The bot should
I need a AI signal generating and executing bot for forex trading. The bot should operate such that when i put it in a chart it will analyze the market, after several minutes it will display whether the trade is buying or selling and then execute a trade. It should display the one minute, five minute,15minute, 30 minute, one hour, 4 hours and daily time frame whether they are buying or selling. If it is buying the
looking for help to get my ibkr automated, i have strategies already built in composer and have JSON for them, i really just need to he setup and explanation on how to maintain it and add new strategies
I need a AI signal generating bot for forex trading. The bot should operate such that when i put it in a chart it will analyse the market, after several minutes it will display whether the trade is buying or selling. It should display the one minute, five minute,15minute, 30 minute, one hour, 4 hours and daily time frame whether they are buying or selling. If it is buying the arrow should be green and if it is
Using Bollinger Band only. When price closes above upper BB, open Buy. If the length of the candle body that closed above the upper BB is more than Y pips, then do not Buy and remove the EA. Otherwise, continue to open Buy if crosses and close above upper BB and the number of positions is not more than Max No of Positions. The user will choose either Buy or Sell only. When price closes below the lower BB, close all
The expert Advisor will place trades during high-impact news releases. it will then close trades by trailing stop methods after reaching the breakeven points. It should be built in such a way that it will allow adjustments of parameters like opening distance points, initial stop loss, breakeven points etc
Hello freelancers here, I need an expert to help me with coding my script which is already working in pinescript, Moreover, i want a system whereby i can sell my trading bot and can give access with a license, I need an expert that can help me with this
I need an EA which only trades the news data. The EA has to analyze the news-data and needs to classify them into categories. The Strategy includes the following points and this features needs to be included : 1. Filter for news Data : Pairs : USD ● EUR ● AUD ● GBP News Events : GDP Unemployment rate (initial claims) CB Consumer Confidence (US) Retail sales Consumer Price Index (CPI) Purchasing Managers' Index (PMI)