Техническое задание
Hello, recently I asked for a supply and demand indicator from a programmer, but he did not succeed. I would like a supply and demand indicator that shows on a single time frame, all the other time frames. with a color legend for each time frame.
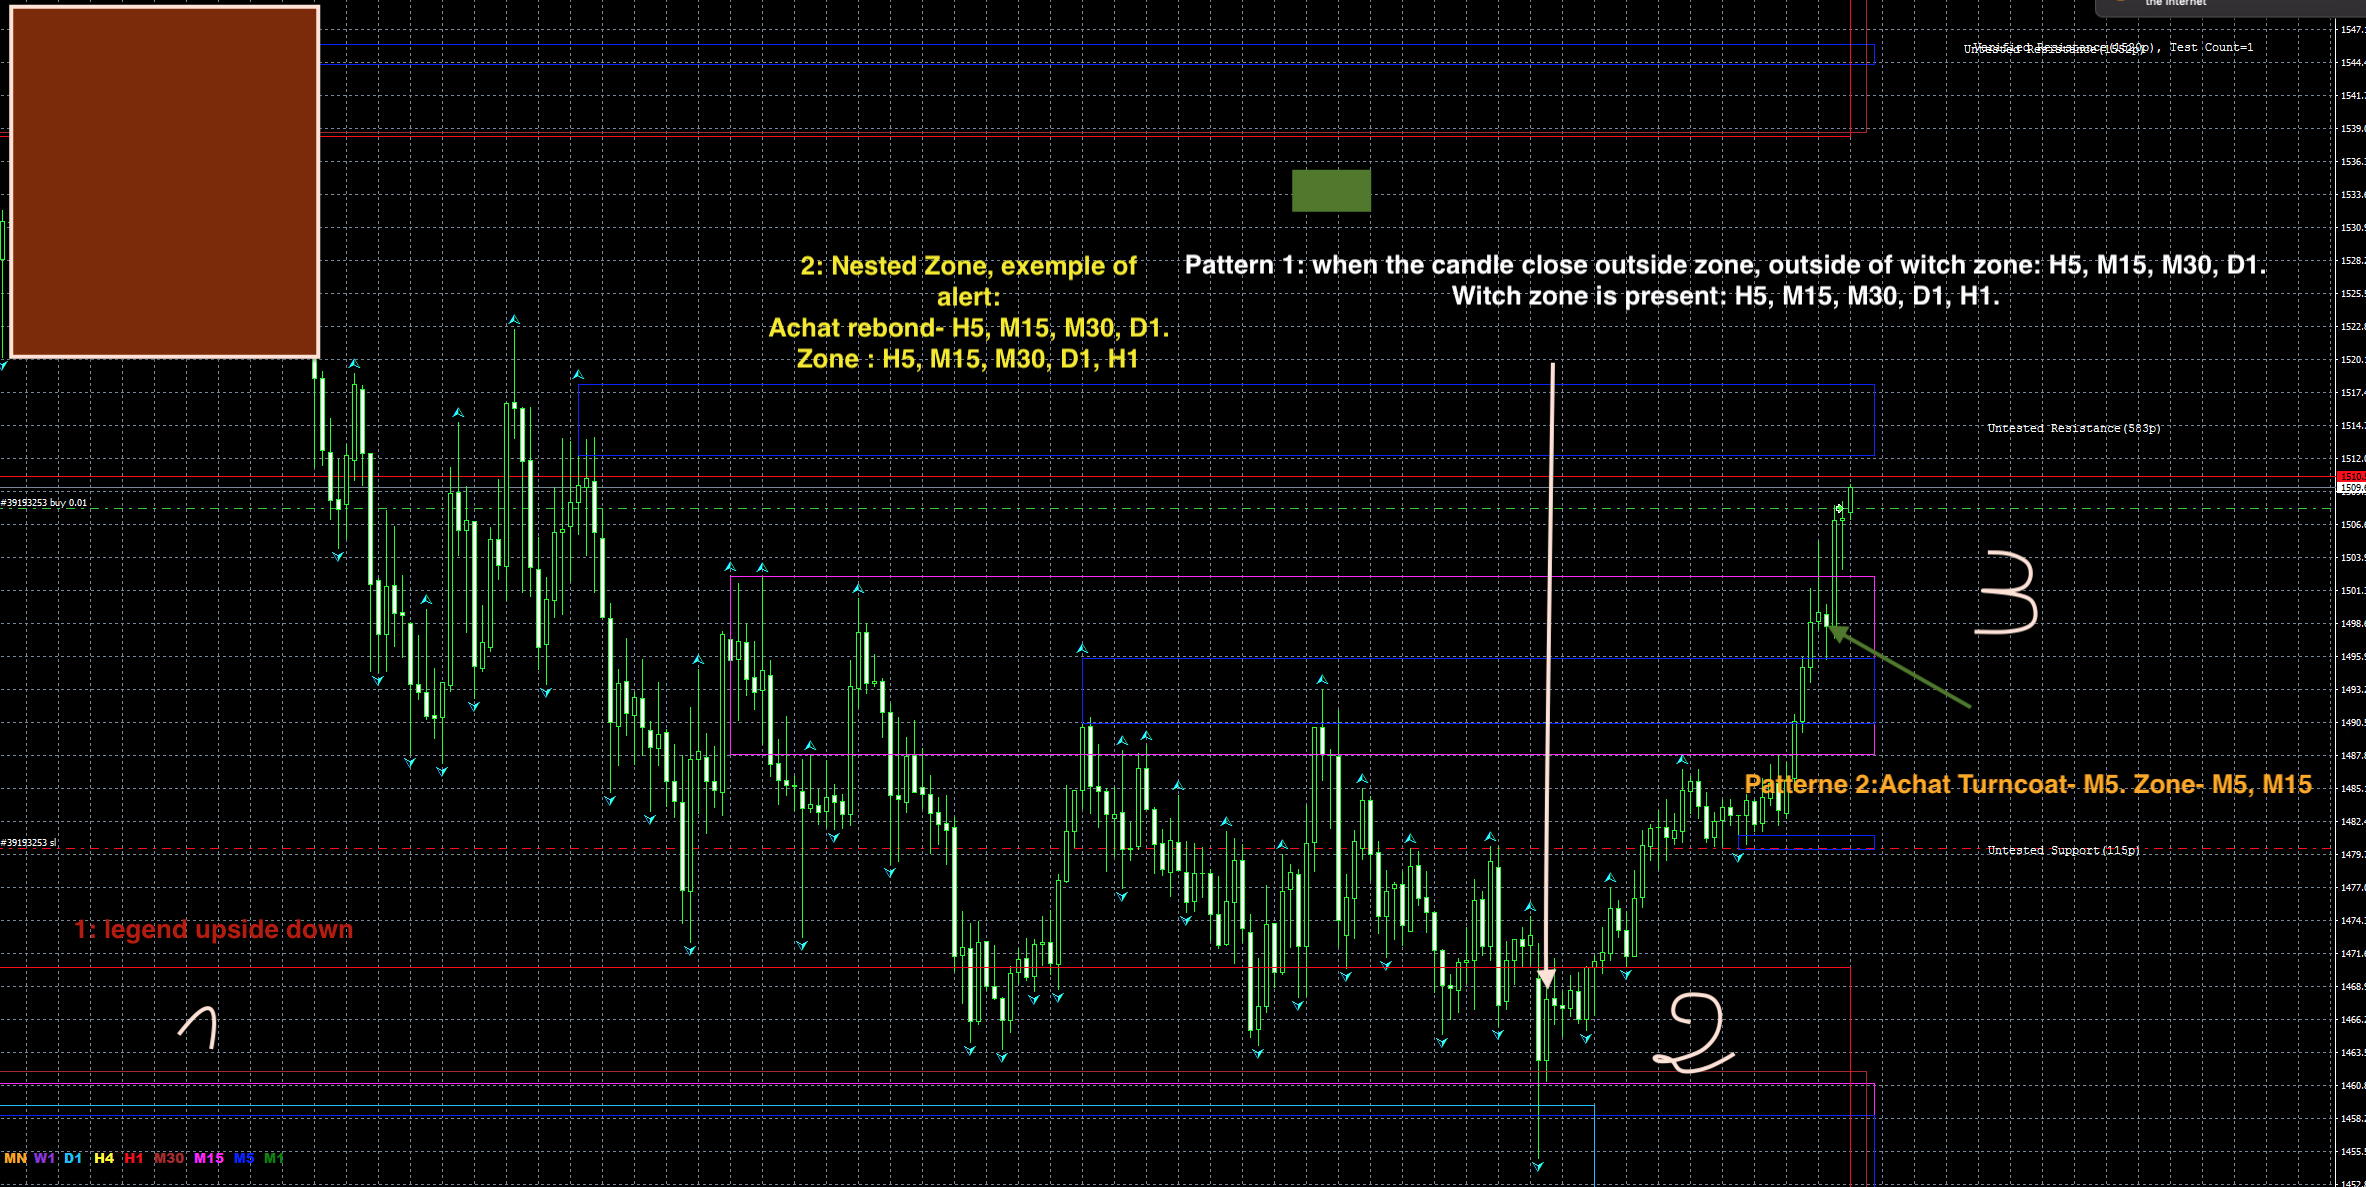
Example: violet in H1, all rectangles showing an area, whether it is offer or demand, will be violet.
The
programmer was close to the goal, but the indicator too heavy, did not update.
He
also failed to manage the alerts I want to attach to the indicator.
Since we find several zones of several time frames, when the candle is closed, the price comes out of one or more zones, it must specify which zone is at stake. It must also specify the areas that touch, are inside, or overlap the affected areas. This is clearer on the drawing.
He has to send the mobile alert.
Finally, the indicator place on an asset, must be able to scan the other assets to send any alerts on other selected assets.
You can find the source indicator, but I think we need to rewrite an indicator from the beginning, in order to avoid an overloaded code.
You also have the indicator created by the programmer, which gives a good graphic image, but which is false at the level of alerts, and which does not update on the graph.
And a drawing of what I illustrate.
Very sorry, i'm french so i have some problem to understand, but i can! :)
THX.